
The risk of capitulation in the crypto-currency market is diminishing as Bitcoin (BTC) consolidates. Indeed, as losses for short-term investors decline, exchange platforms are experiencing a wave of outflows showing strong demand. On-chain analysis of the situation
Bitcoin is not out of the woods yet
The price of Bitcoin (BTC) is consolidating and printing a series of higher and higher lows, a sign that the current bearish phase may be coming to an end.
However, the possibility of a further fall in price, leading participants to capitulate, is quite plausible given the many latent losses still being held by short-term investors.
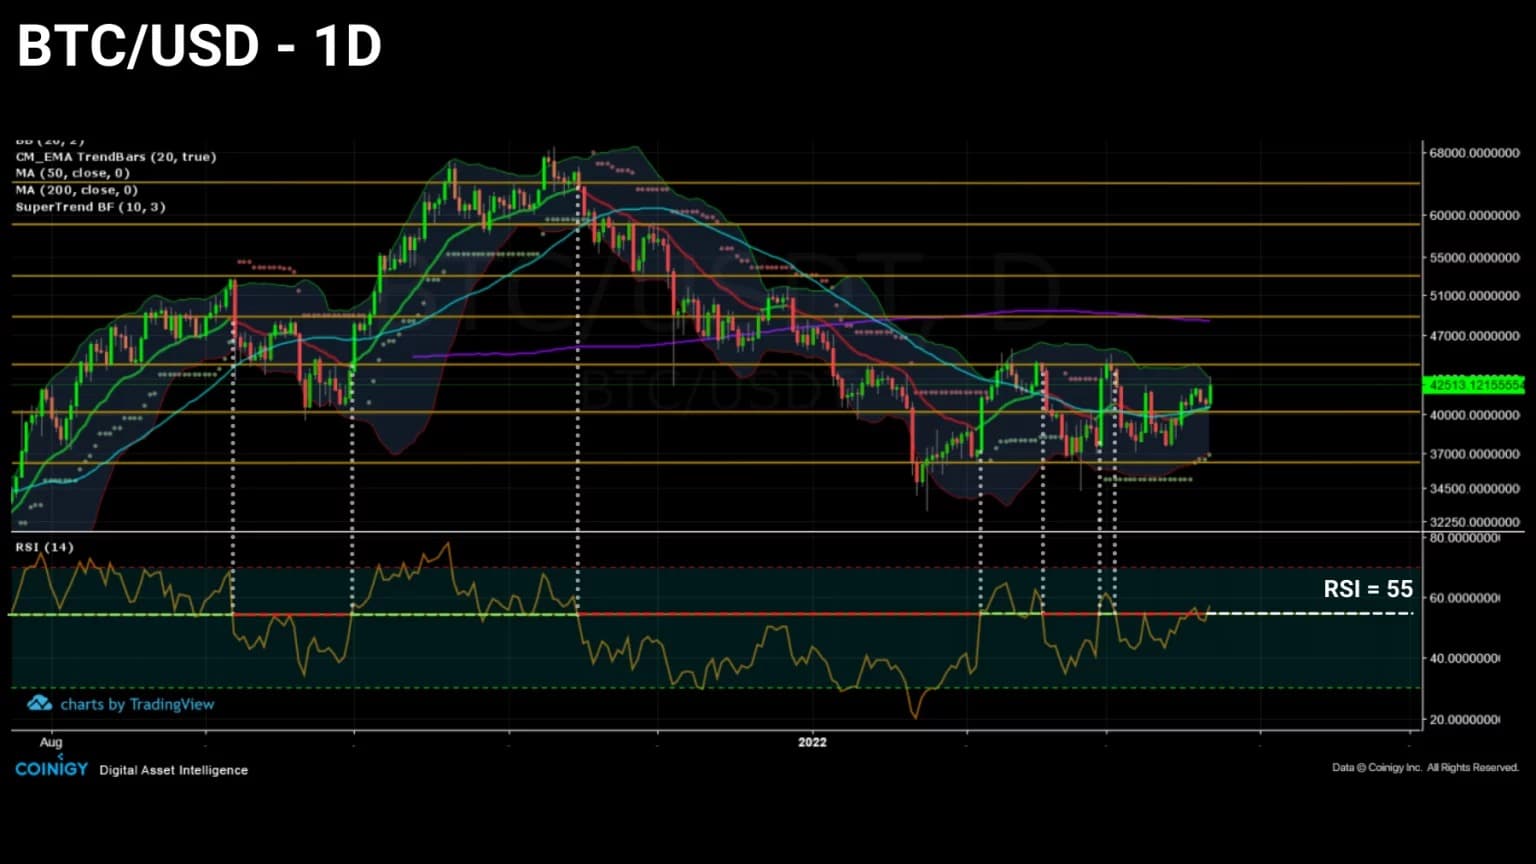
Figure 1: Daily Bitcoin (BTC) price
This week, we will analyze the market from the perspective of the profitability status of its cohorts, with a specific focus on short-term investors, who are more likely to react negatively to large swings in the BTC price.
In addition, we will study the evolution of the inflows and outflows of the exchange platforms’ portfolios, but also of the miners’ portfolios in order to get an overview of the market’s buying and selling behaviour.
A quarter of participants still losing money
Let us begin this analysis by noting that the market – across all entity types – is currently composed of 72.6% of participants in profit and, by subtraction, 27.4% in loss.
Thus, within the current market structure, just over a quarter of investors are still carrying latent losses, representing selling pressure that should not be ignored.
This minority has a special role to play as their behaviour will determine the extent of the potential capitulation that would occur if the price of BTC were to invalidate the $33,000 support.
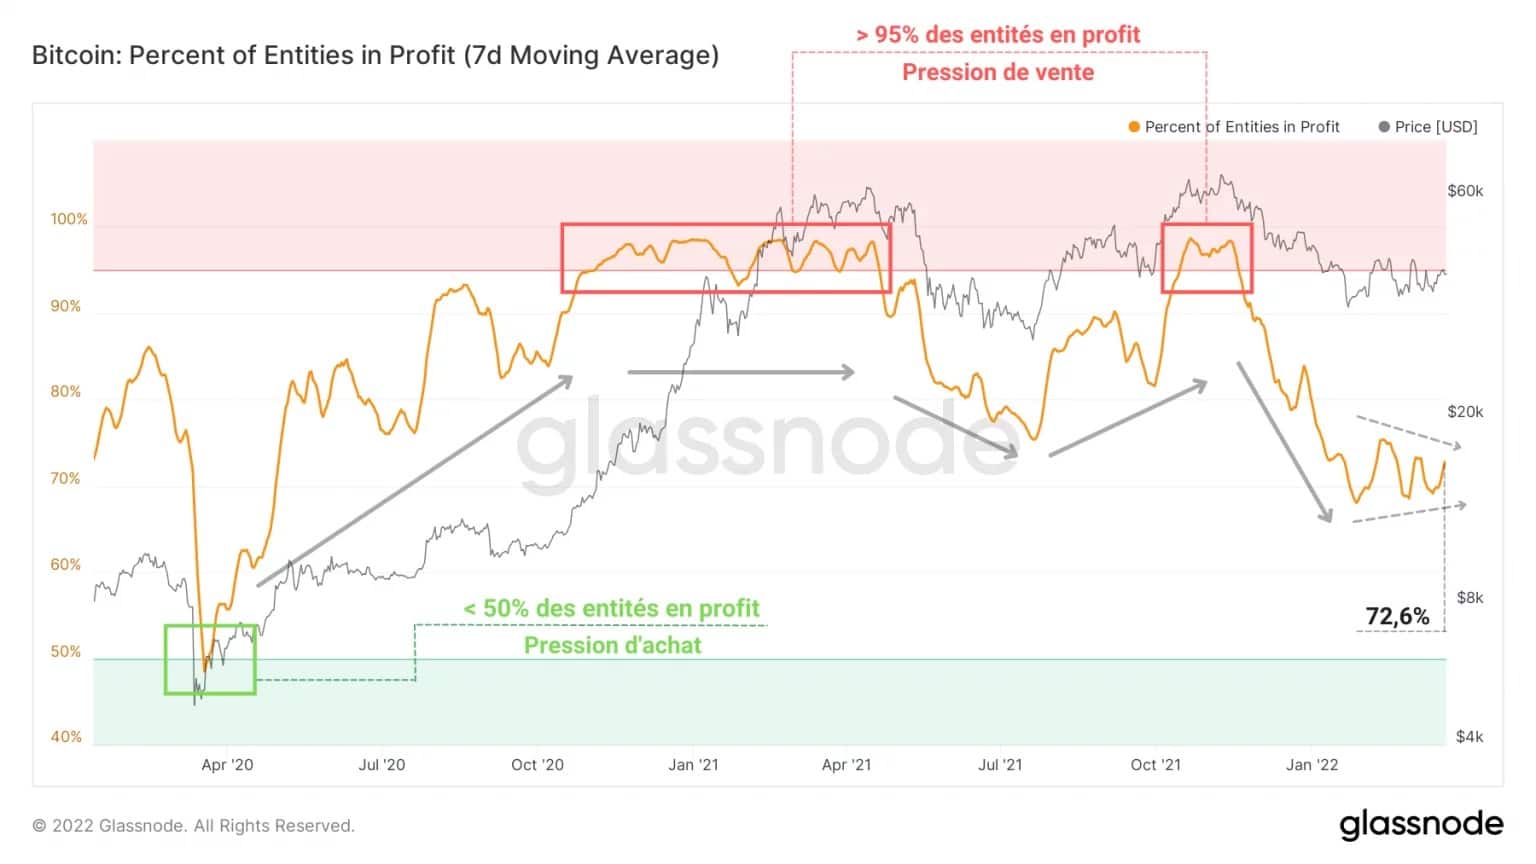
Figure 2: Percentage of entities in profit
Digging deeper, we can see that 14.1% of the outstanding supply is held by short term investors in loss (STH) and 13.3% by long term investors (LTH).
This is a far cry from the low point of the May-July 2021 correction, when loss-making STHs accounted for 22.9% of supply compared to 6.4% for LTHs.
It is surprising to see that at such a late stage of the correction, these two cohorts share a very close portion of the supply of loss-making BTC.
However, the spending behaviour of STHs, which we have been studying assiduously for several months, is by far more emotional and reactive to volatility than that of LTHs.
It is therefore statistically more likely that short-term investors will panic at the sight of a decline and lead to a wave of spot and derivative liquidations in their wake leading to a capitulation event.
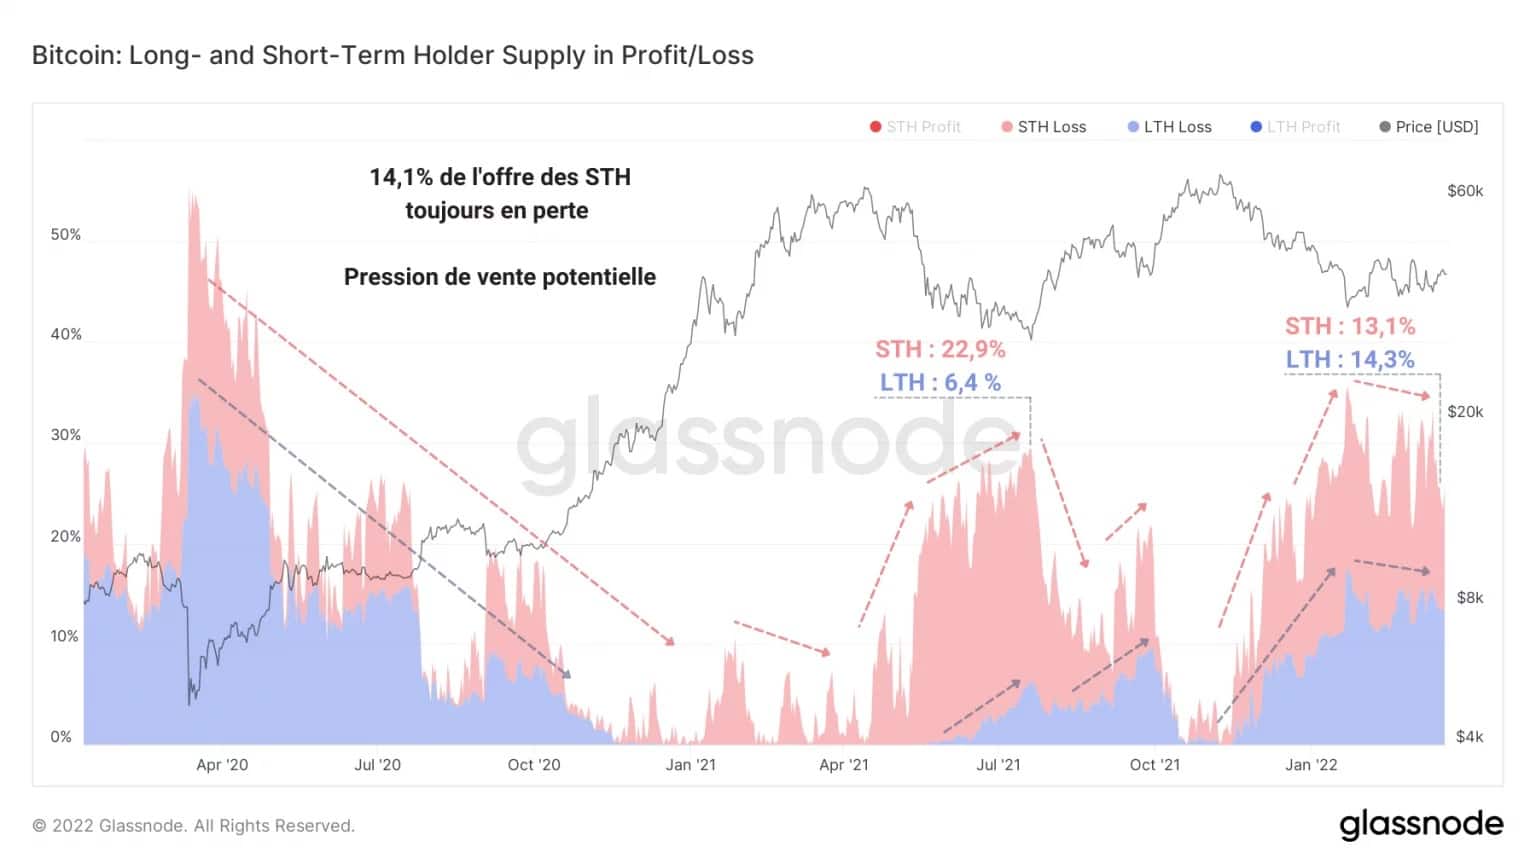
Figure 3: Supply in a state of loss
However, this final move is not the sine qua non for ending a bear market phase. Indeed, the BTC price can still make a trend reversal without drawing more blood.
To illustrate this point, the chart below shows the evolution of the volume of loss-making transfers (by which we mean the volume of BTC worth less than their base cost) over the last two years.
We can observe a clear growth of this measure during the correction in progress since November, moreover higher than that which occurred during the capitulation of May 2021.
Furthermore, with daily volume of around $145,000, this curve appears to be testing its support line, a sign that:
- less BTC are incubating latent losses as the price consolidates;
- fewer BTC in a loss position are being transferred, indicating HODL behaviour by investors.
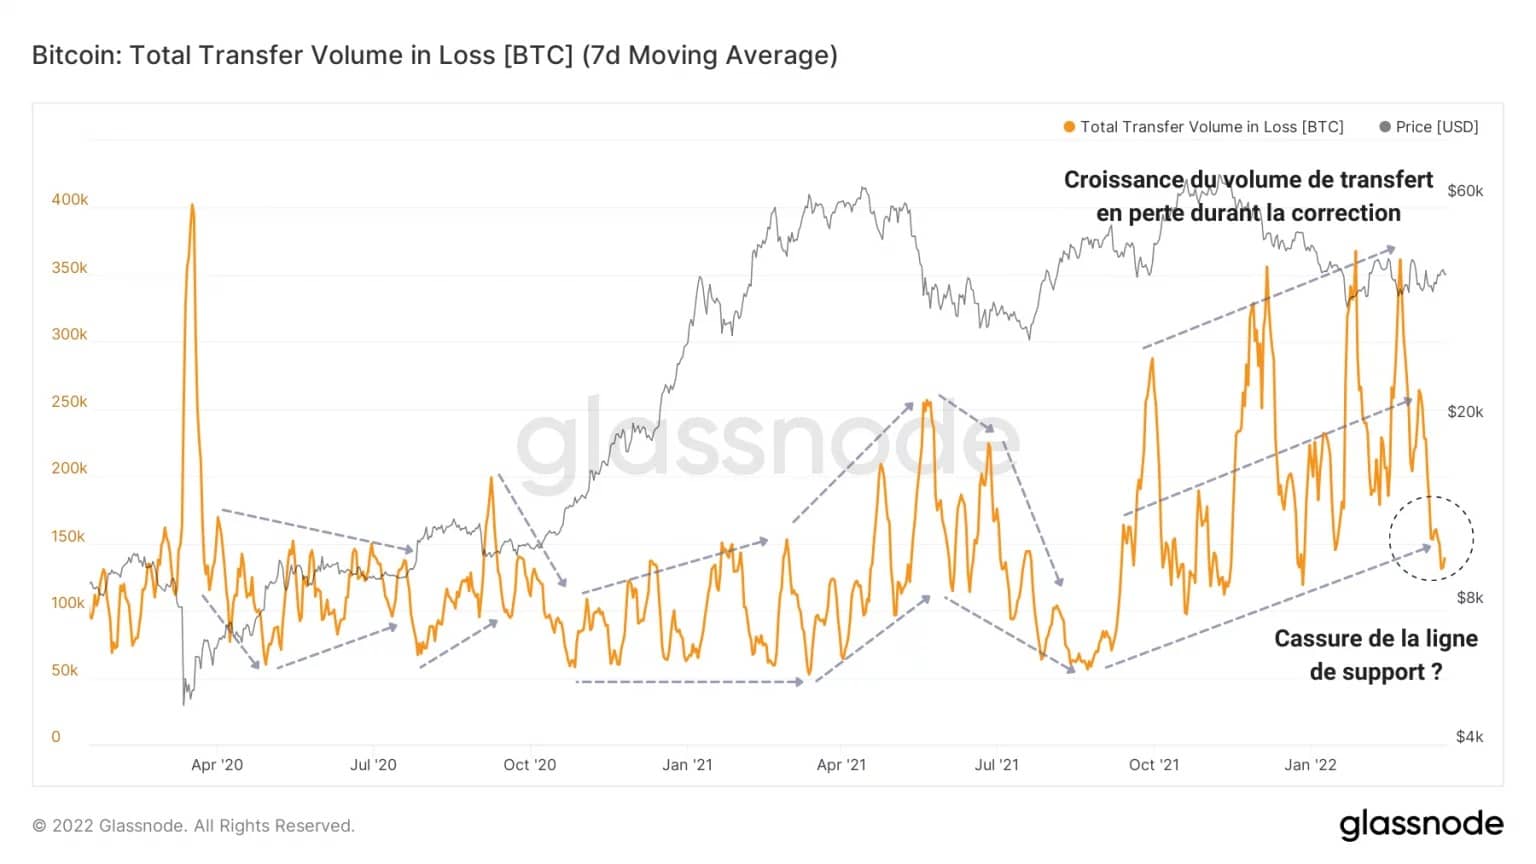
Figure 4: Transfer volume in loss
Furthermore, the observation of loss taking suggests that the market as a whole is less inclined to dispose of BTC in a loss-making state.
The Realized Loss to Value (RLV) ratio is the ratio of realized losses on the chain to the realized price of BTC and compares the losses incurred by the market with its overall cost base.
This metric can be used to more accurately identify episodes where large volumes of losses are being realised, indicating large corrections (RLV ☻ 0.01), capitulation (RLV ☻ 0.02), and therefore rare buying opportunities.
A quick reading of the LOS indicates that, unlike the events of March 2020 and May 2021, the market has not suffered enough losses to characterise a capitulation.
Furthermore, a decline in loss taking is clearly observable over the past two weeks, indicating that participants are adopting a less bearish bias than at the start of 2022.
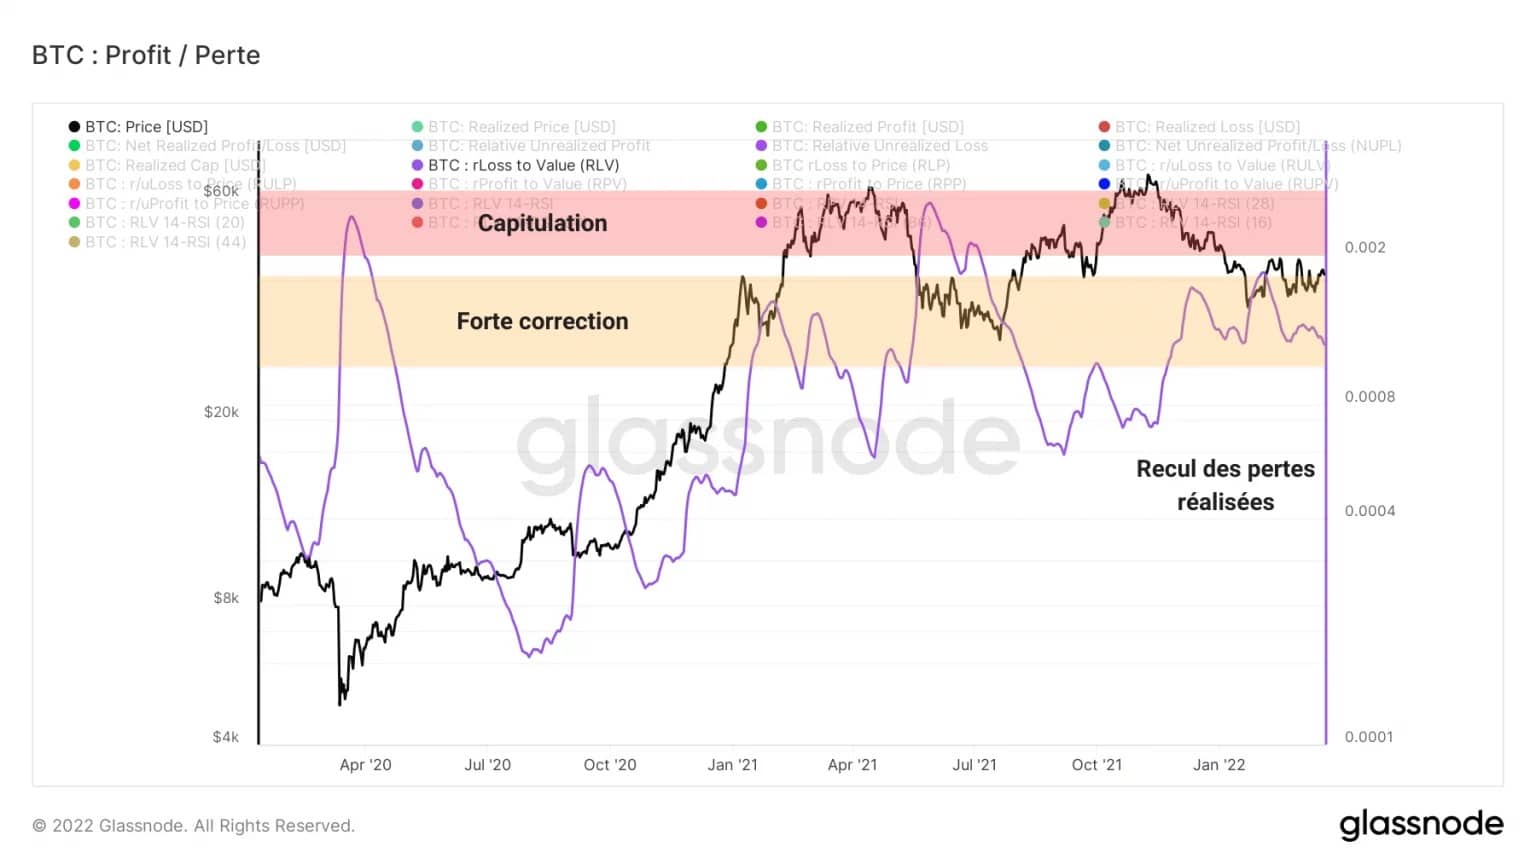
Figure 5: RLV ratio
STH selling pressure is gradually decreasing
Let’s look at the STH cohort for a moment. Short-term investors known for statistically holding their BTC less than 155 days, they are often associated with top buyers and bottom sellers.
Most importantly, these entities are much more likely to react epidermically to market movements. In particular, they are more prone to panic buy and panic sell behaviour, but also to the excessive use of leverage.
In this case, the following graph shows that the realised price of STH, the aggregate cost base of this cohort, is around $45,900.
This implies that the majority of STHs are holding BTC below their cost base, increasing the likelihood that they will be spent if the price falls.
If such a capitulation were to occur, an important level of support will be found near $24,000 to $25,000, the current realised market price level. Indeed, it is highly likely that participants will seek to buy back at the level symbolising the overall market cost base.
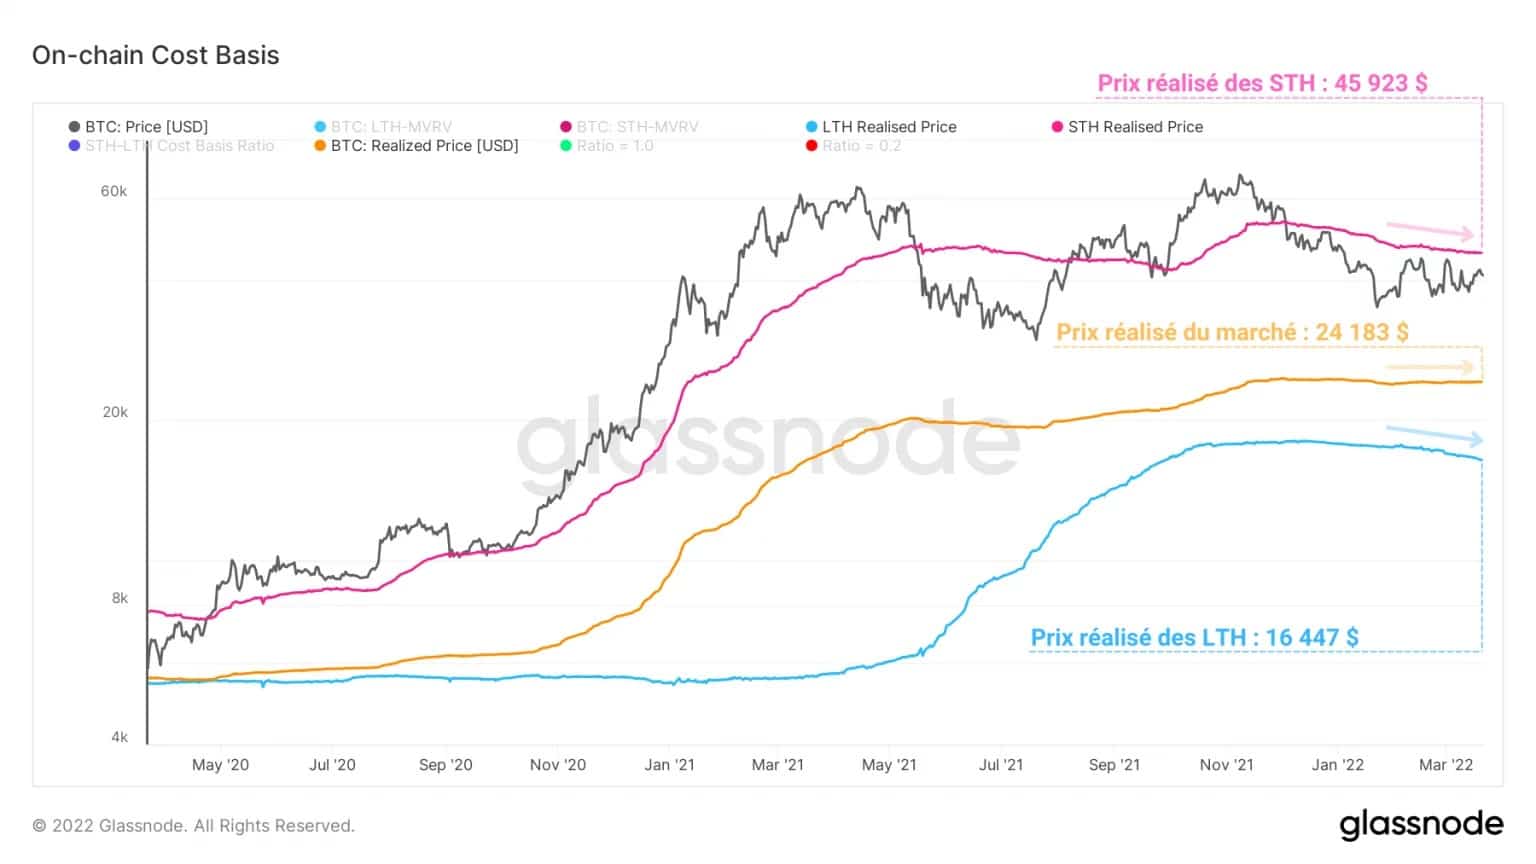
Figure 6: On-chain cost base
In addition, the STH-SOPR describes since December a very particular behaviour. This indicator is calculated by dividing the realised value of a BTC less than 155 days old (in USD) by the value at the time of purchase, which is equivalent to dividing the price sold by the price paid.
This ratio highlights the periods when the STH cohort spends their token at a loss (red) or profit (green) and allows for the identification of reversals in spending profitability occurring in tandem with medium-term market trend movements.
Currently below their break-even point, a large proportion of STH still sell their tokens at a loss. Moreover, we can see that four tests of this threshold (STH-SOPR = 1) have taken place without allowing the indicator to break free.
These resistances indicate a certain willingness on the part of the STHs to leave their position as soon as it approaches a low loss threshold. By selling close to their cost base, STHs induce selling pressure on the price of BTC.
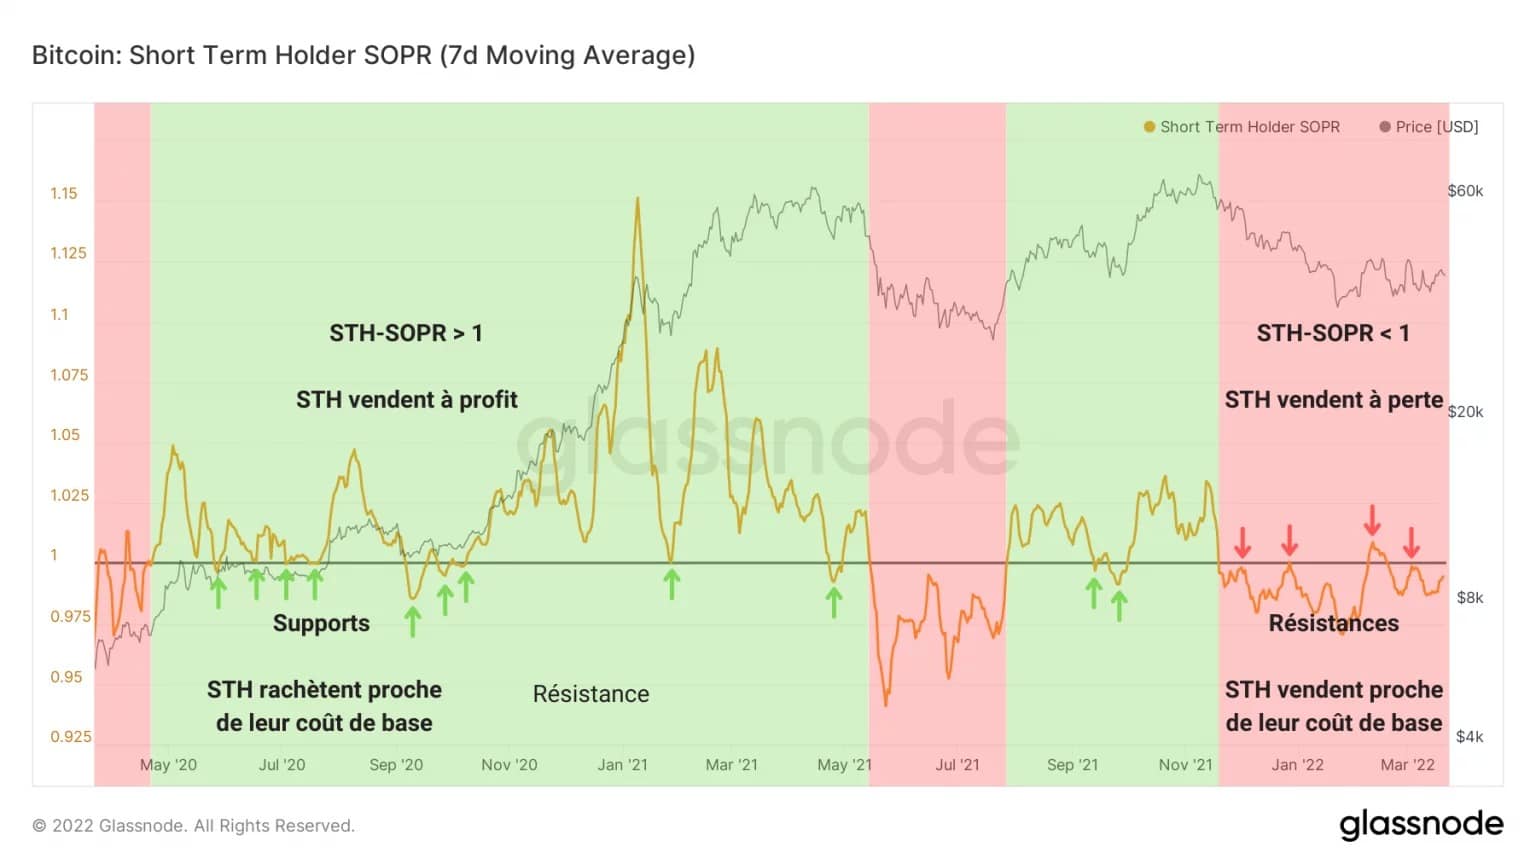
Figure 7: STH-SOPR
It is therefore legitimate to question the extent of the latent selling pressure held by this cohort, whose total volume represents 13.1% of the supply in circulation, or nearly 2.48 million BTC.
The STH-NUPL, obtained by dividing net unrealised profits by the unrealised loss of UTXO less than 155 days old, is used as an indicator to assess the HODLing behaviour of short-term investors.
A meaningful observation is then offered to us: whereas in June and July 2021, the latent losses of STHs had continued to grow throughout the correction, we are faced here with the opposite phenomenon.
Indeed, from February to March 2022, the unrealized losses held by STHs have gradually decreased, in concert with the consolidation of the price between $36,500 and $43,000.
It is encouraging to see that this potential selling pressure is clearly following a downward dynamic, reducing the risk of capitulation, which is lower than in May 2021.
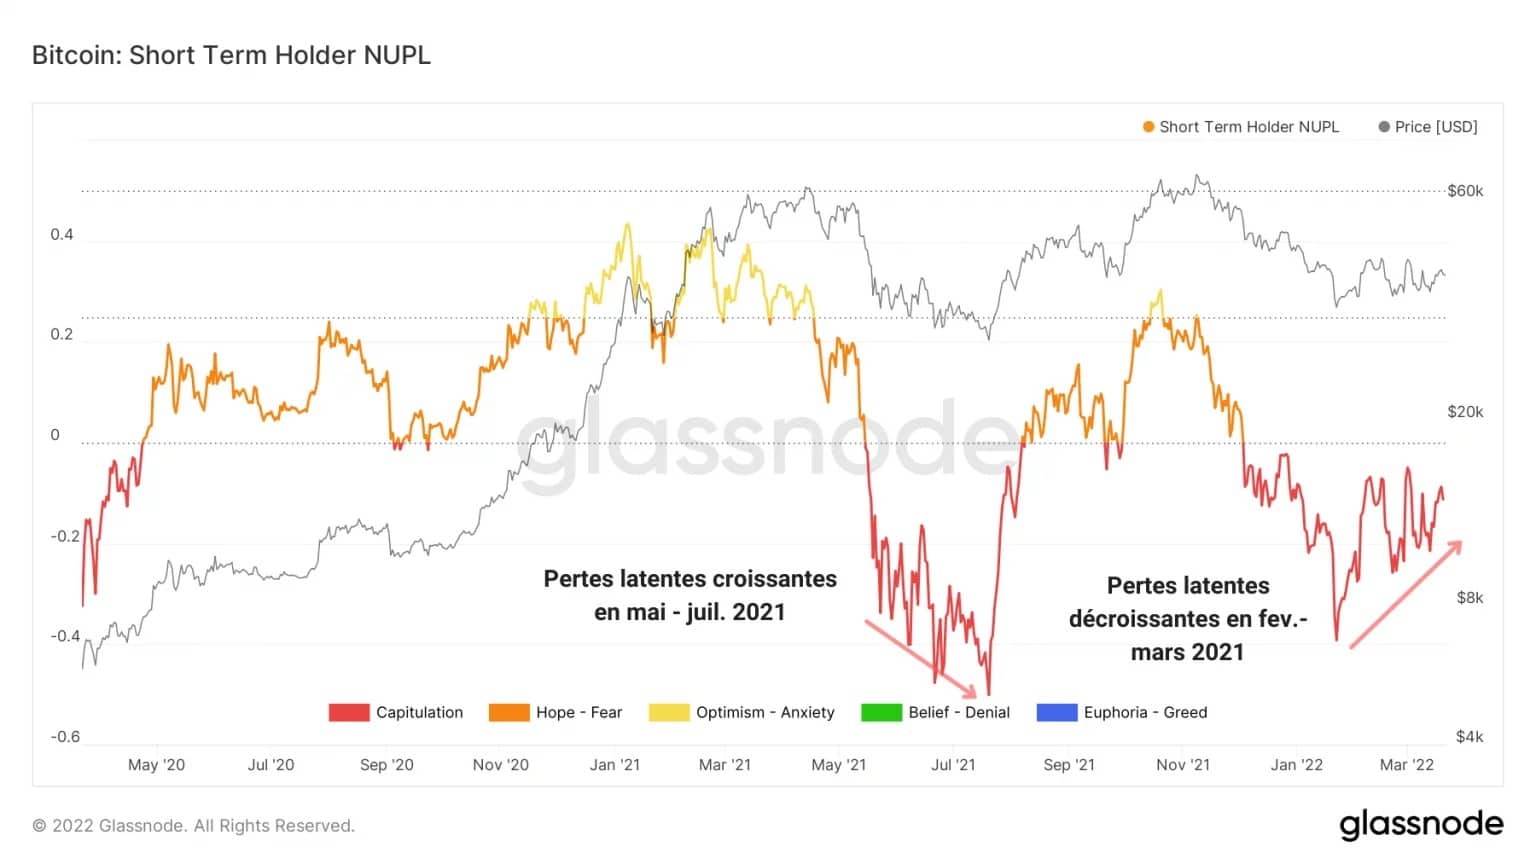
Figure 8: STH-NUPL
Large outflows indicate sustained demand
Let’s now turn to the flows of deposits and withdrawals from exchange platforms and miners to broaden our reading prism.
As we have seen in previous analyses, correction phases tend to provoke large volumes of deposits on exchanges, a sign that some participants are transferring their BTC to sell them.
However, this is not the case in the current market structure: since December 2021, the dominance of outflows has been growing and signals a wave of massive withdrawals, often reaching a volume of more than a thousand bitcoins per day.
Moreover, the drop in the volume and frequency of incoming flows indicates a decline in the bearish bias. To put it another way: since December, more BTC have been leaving the exchanges than have been transferred in.
This is a very encouraging behaviour, indicating a sustained demand and a low willingness to leave the market
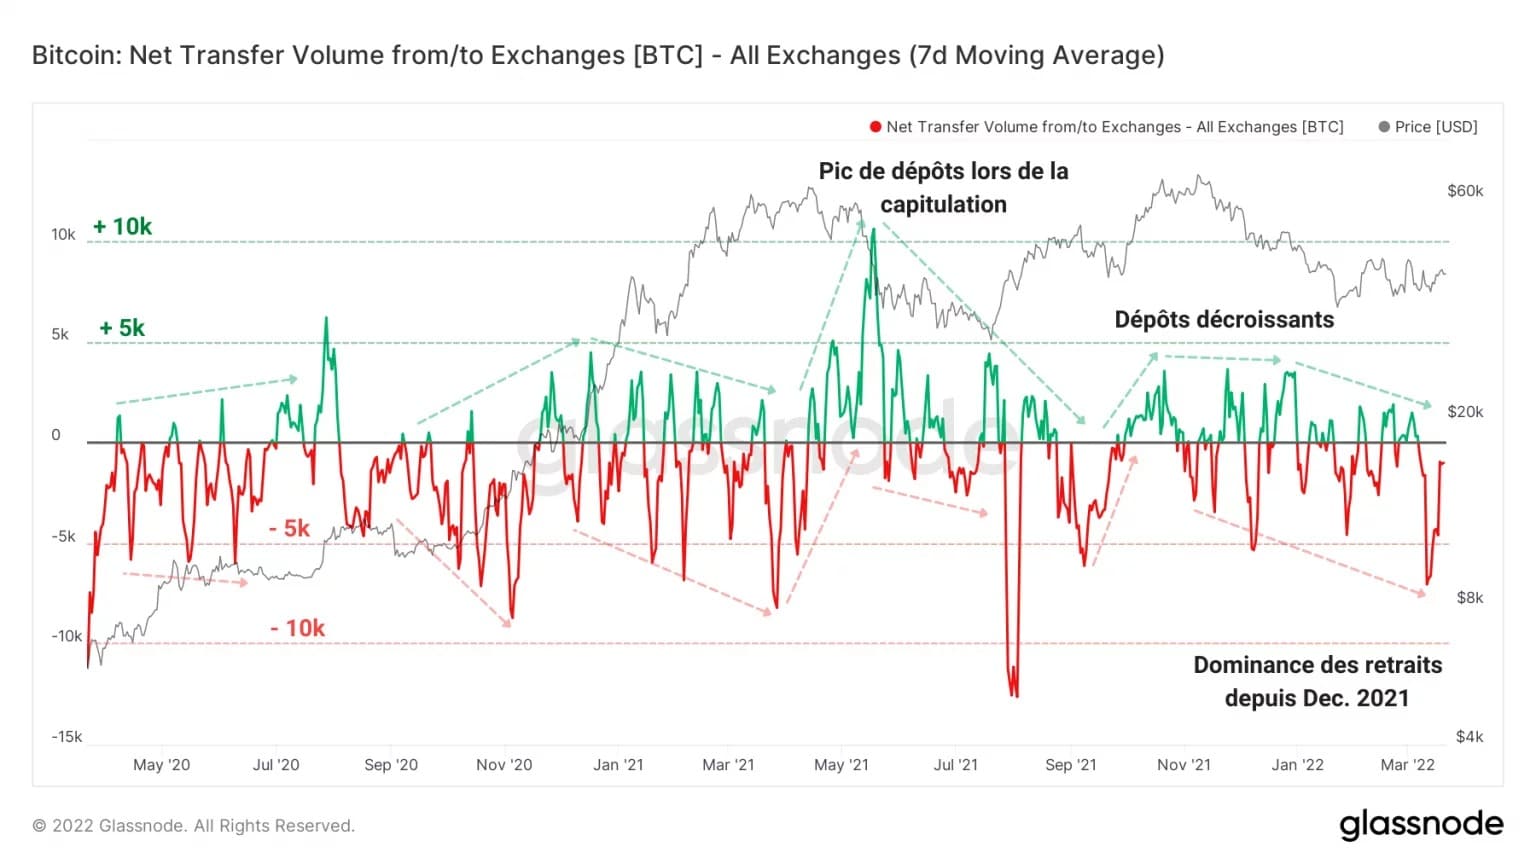
Figure 8: Net flows from exchanges
Similarly, the miners’ cohort does not seem to be particularly selling. Their low spending of less than 100 BTC per day signals that they are not considering the possibility of inducing additional selling pressure on the bitcoin price.
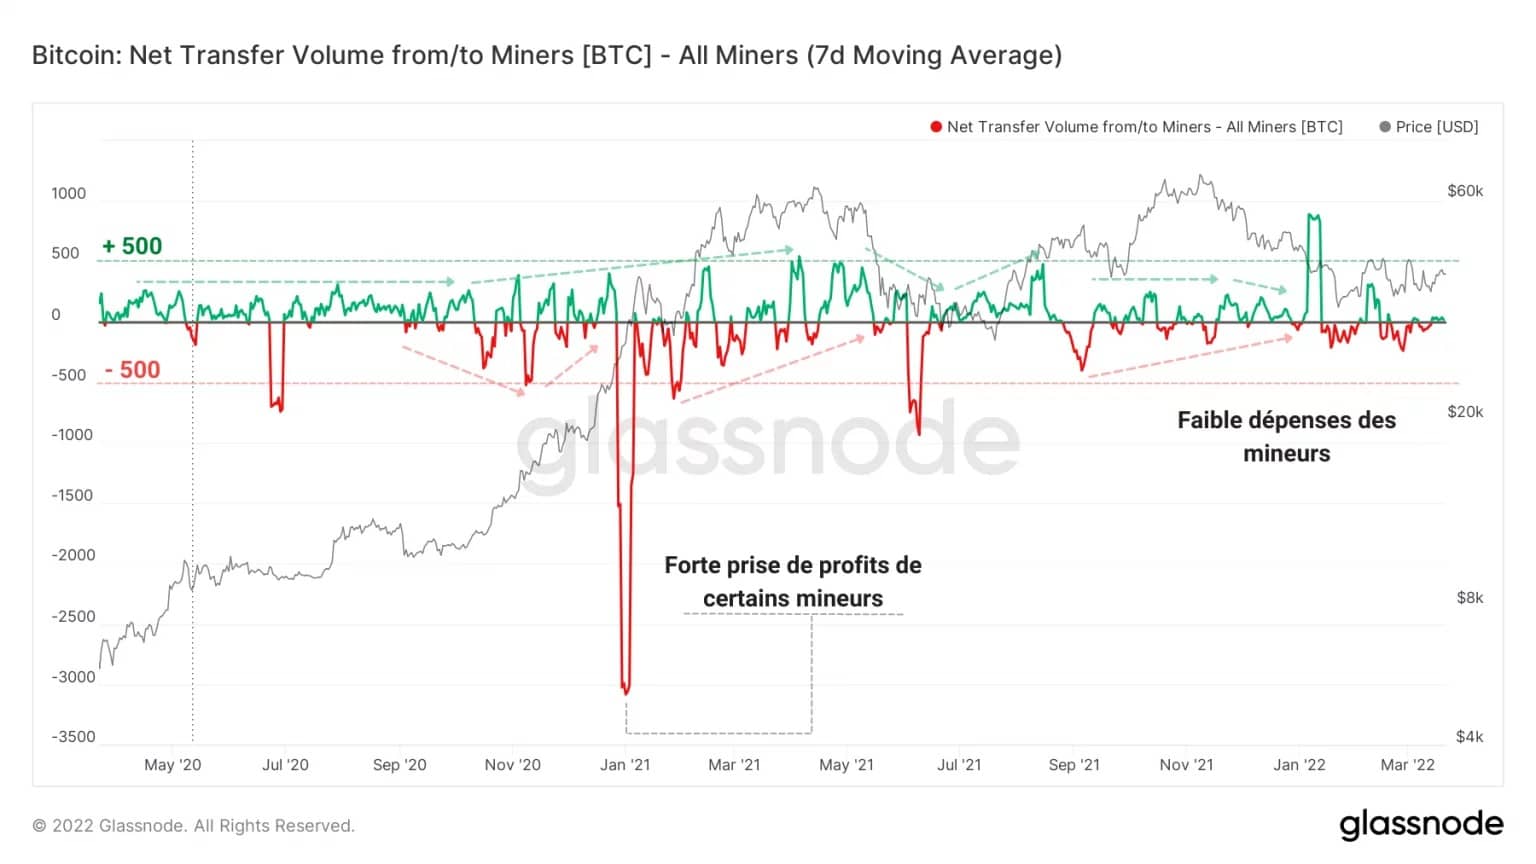
Figure 9: Net miner flows
Before closing this analysis, let’s quickly note that the bitcoin reserve dynamics of the exchange platforms have been undergoing a drastic structural change since summer 2020.
As shown in the chart below, it appears that a group of 4 exchanges, consisting of FTX, Binance, Bitfinex and Kraken are experiencing an unequivocal appreciation in their reserves.
With a combined 509,000 BTC in June 2020, these platforms now hold over one million BTC, an increase of 117% in two years.
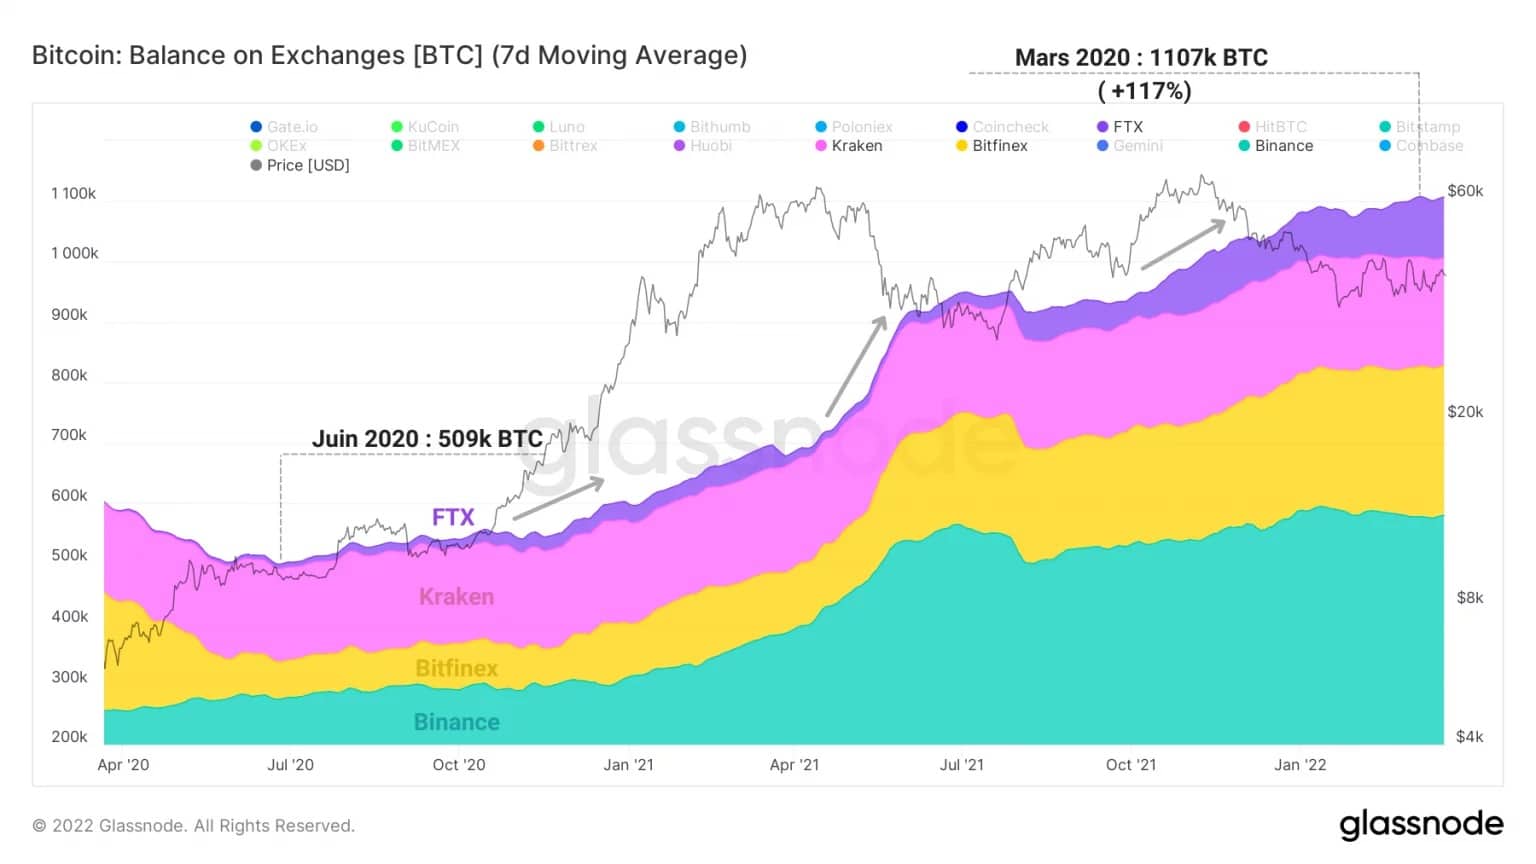
Figure 10: BTC reserves of Bitfinex, Binance, FTX and Kraken
Conversely, the other exchanges are experiencing a significant decline in their BTC holdings, which we study regularly. Having lost more than half of their reserves, the totality of these centralized platforms agglomerates together 1.4 million BTC.
We should also note the case of the Huobi exchange, which went from 362,000 BTC in July 2020 to 12,800 BTC in March 2022, i.e. a 96% drop in its reserves.
It is therefore clear that 4 major exchanges now control a little less than half of all so-called “liquid” BTC, a dynamic that does not seem to be slowing down as the weeks go by and that we will be following closely over the coming months.
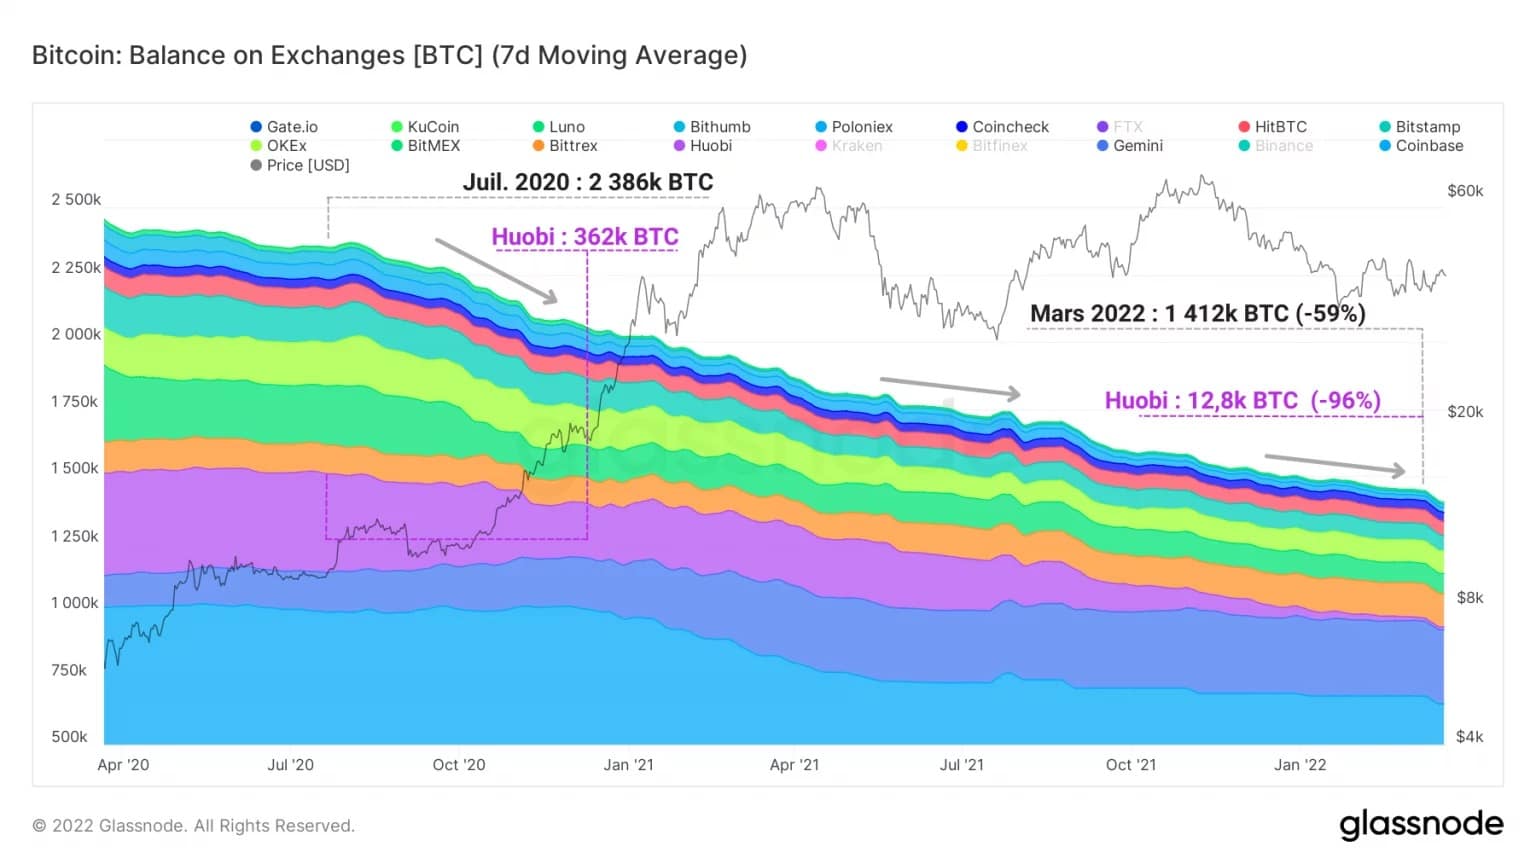
Figure 11: BTC reserves of other exchanges
Summary of this on-chain analysis
Finally, the profitability status of the market tells us that a similar proportion of BTC is held at a loss by LTHs and STHs. By the nature of their behaviour, the latter can potentially induce selling pressure on the market price, although the losses realised on the chain are decreasing, in terms of frequency and volume.
Currently below break-even, STHs continue to sell BTC close to their cost base and put selling pressure on the price, which tends to diminish as the bitcoin price lateralizes.
Exchange platforms are experiencing a wave of outflows despite the correction and are showing strong demand. Moreover, miners, like the market as a whole, are transferring very little BTC to exchanges, indicating a lack of willingness to leave the market.
Although the likelihood of a capitulation event is decreasing, volatility could soon be on the rise and could once again shake the market, both up and down. Let’s try to be cautious until there is a serious reversal in the trend.