
While the Bitcoin price surpassed its all-time high of $69,000 at the very beginning of the week, the altcoin season has yet to get underway, while BTC’s dominance continues to grow. When the altcoin season is in full swing, how will we know who can and who can’t climb back up to their respective ATH?
Price of an altcoin and market capitalization, the key is here
For the first time in its young history, the Bitcoin price reached its all-time high several weeks before BTC halved. The next reduction in the mining premium will take place around April 15, and in the past, BTC has accelerated upwards towards its ATH in the weeks following halving.
The Bitcoin price is therefore ahead of its usual cycle, and the reason for this is well known: the Bitcoin Spot ETFs, which continue to record daily inflows. BlackRock now holds over 200,000 Bitcoins – that’s huge, and it’s only the beginning.
This ETF parameter will also have the effect of delaying the altcoin season, by prolonging the upward trend of BTC dominance for a few more weeks. But we’re already in a mini alts season, with many tokens having validated their long-term bullish reversal technically.
So now’s the time to build up a bag of cryptos to make sure you’re on the train when the altcoin season kicks off.
Next, how do you know which ones can and can’t join their respective ATH? You need to distinguish between the price of a token and its market capitalization (market cap = number of tokens in circulation * token price). If an altcoin’s supply has risen sharply from the previous bull run, then it will be less likely for the token to join its ATH.
In order to compare what’s technically comparable, we therefore ideally need a fairly close supply of tokens between the 2021 bull run and the 2024 bull run. The best option is therefore to perform a market cap analysis on each token.
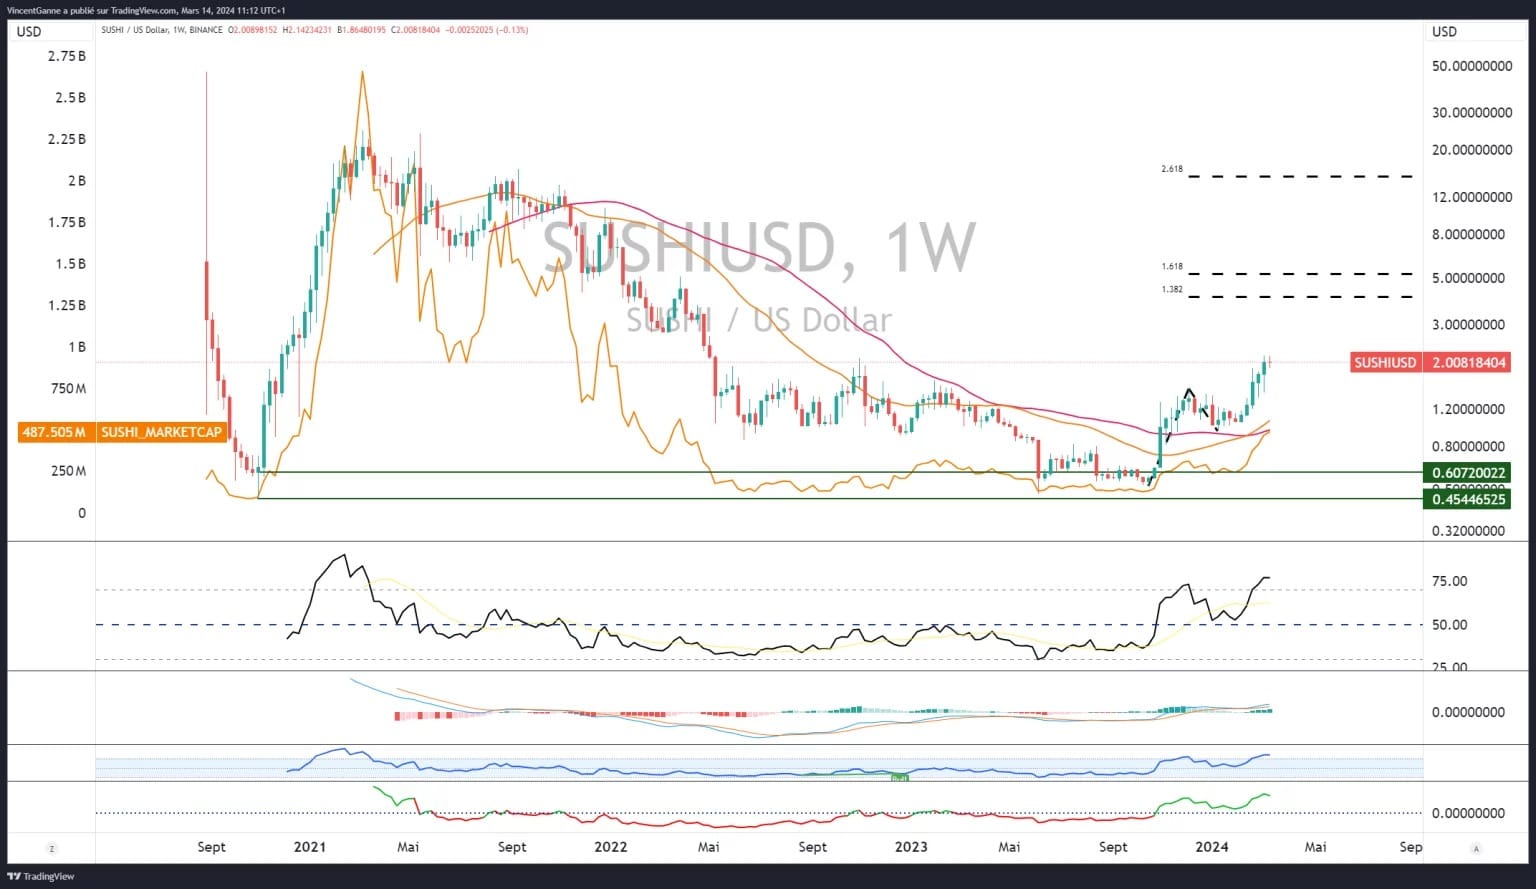
Chart representing the weekly Japanese candlesticks of the token SUSHI/USDT with its market cap on the left y-axis
Bitcoin, the technical challenge of preserving the ex-ATH
A quick word on Bitcoin to conclude. The market surpassed its former all-time high at the very start of the week, and the charting challenge now is to preserve the new support of US$69,000 to further develop the uptrend towards the next theoretical resistances.
If, on the contrary, BTC were to reintegrate its ex-ATH, then a major correction would take place towards 60K.
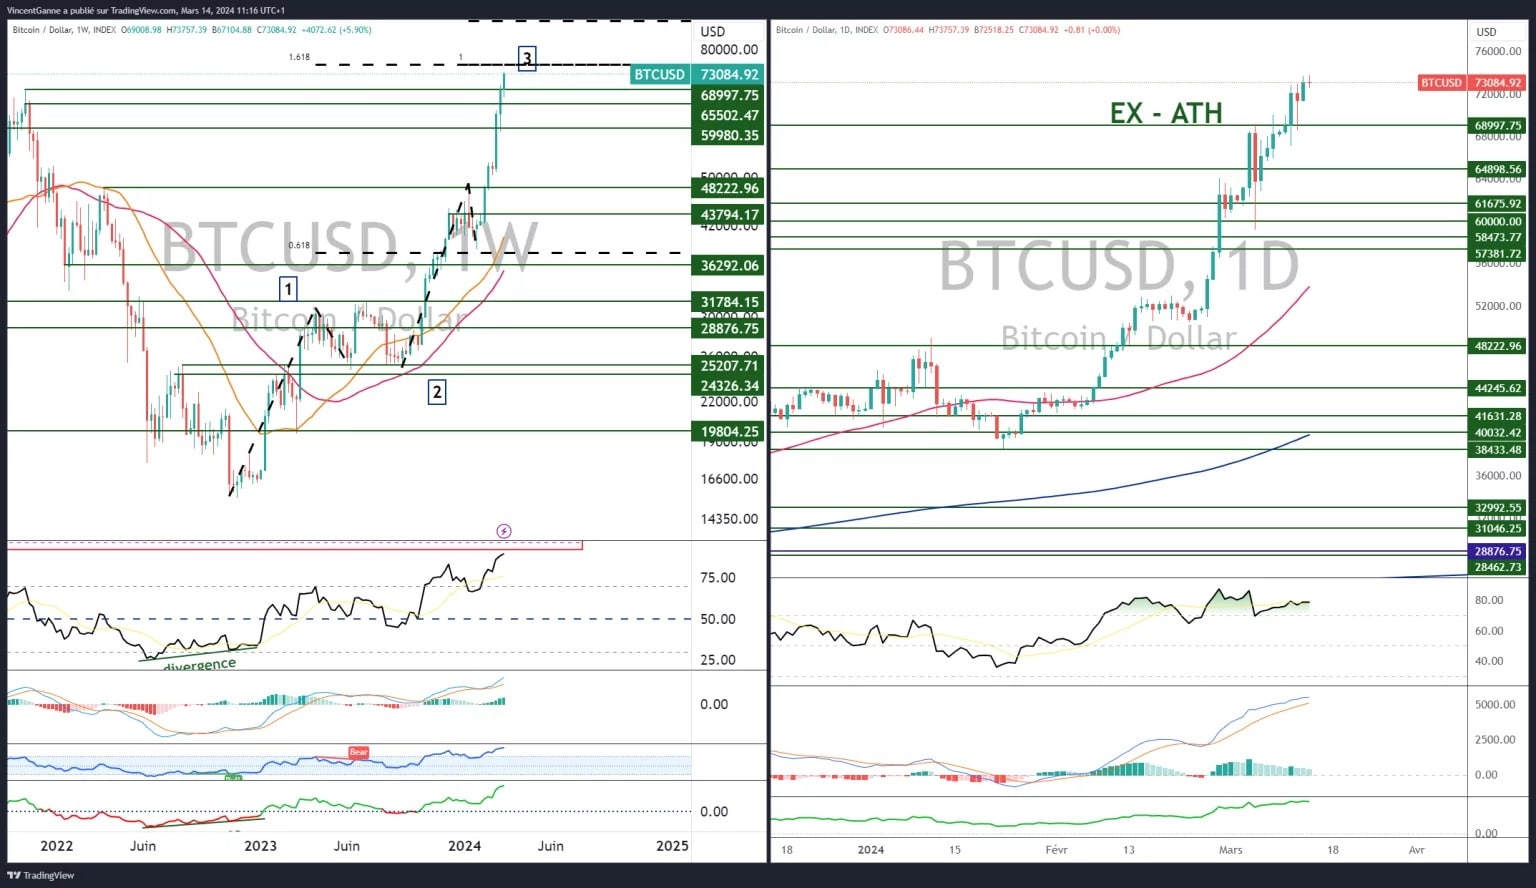
Chart showing weekly (left) and daily (right) Japanese candlesticks for BTC/USD