
As the magnitude of losses realized by short-term investors declines, a volume of more than 2.3 million BTC that changed ownership in the $18.5k-$22k price range is providing support for the time being. However, the selling pressure stored up by long-term investors has yet to be fully expressed.
Bitcoin tests top of range
Bitcoin (BTC) price is pushing above the high end of the range established over the past two months following the forced closure of tens of millions of dollars of short positions yesterday.
As the final redistribution phase is in full swing, one of the dynamics that allows us to identify the transition from a bear market to a bull market is the exhaustion of selling pressure from participants.
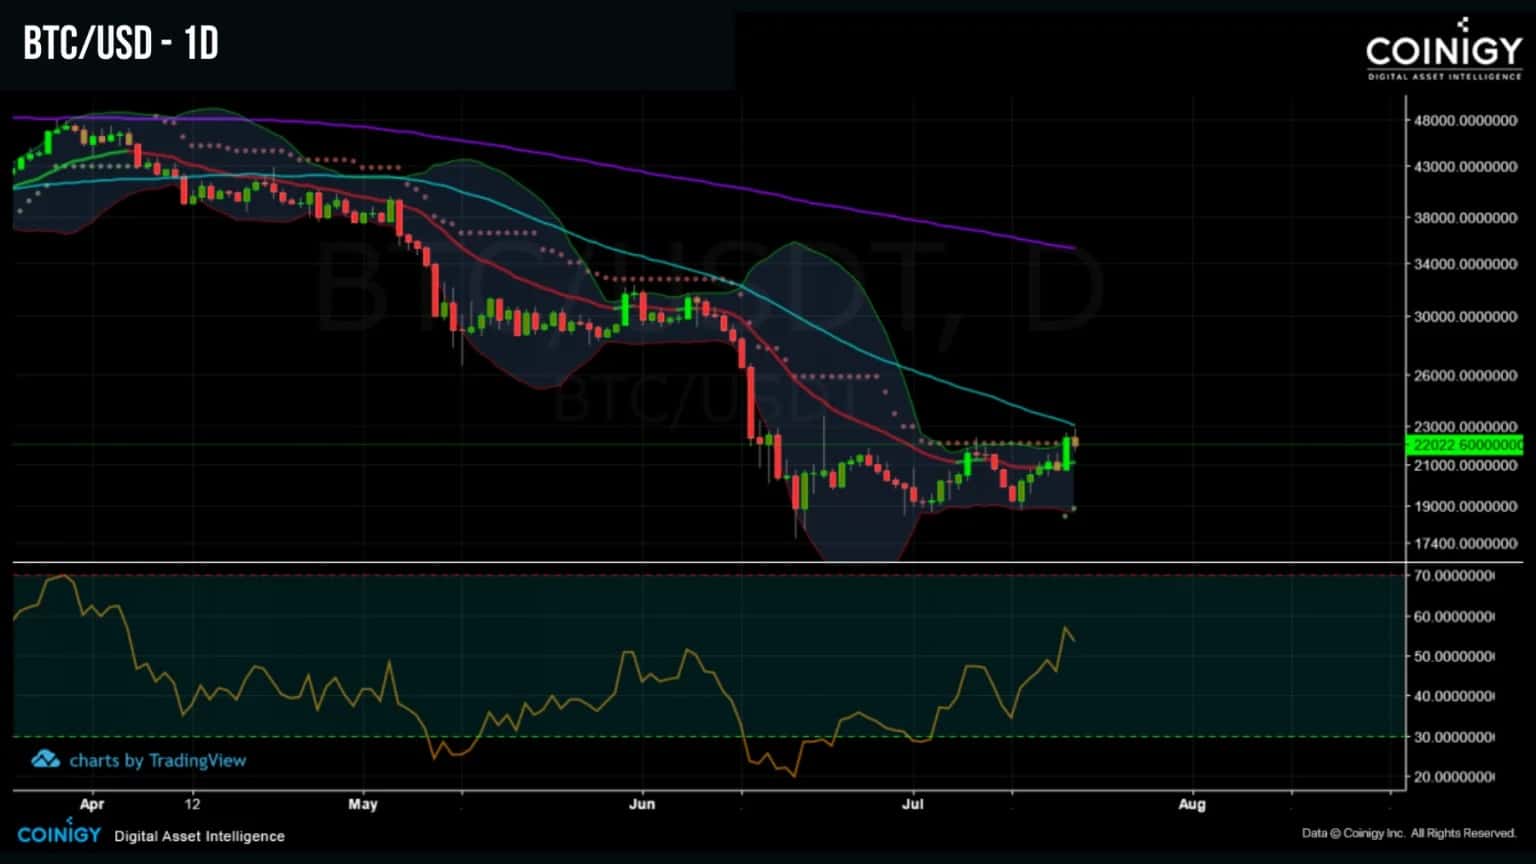
Figure 1: BTC daily price
In order to assess the remaining selling potential following the two bearish episodes of May and June, we will analyze this week:
- the formation of an onchain support level at the former ATH;
- the degree of profitability of short and long term investor spending;
- the fall in bearish momentum of the BTC price.
Strong support level
If we take a longer view, it appears that the current bear market has produced one of the worst monthly performances in BTC history.
Closely rivaling a historic drop of -38.5%, when BTC plummeted from $13.3 to $8.2 in August 2011, the month of July 2022 records a drop of -37.9%.
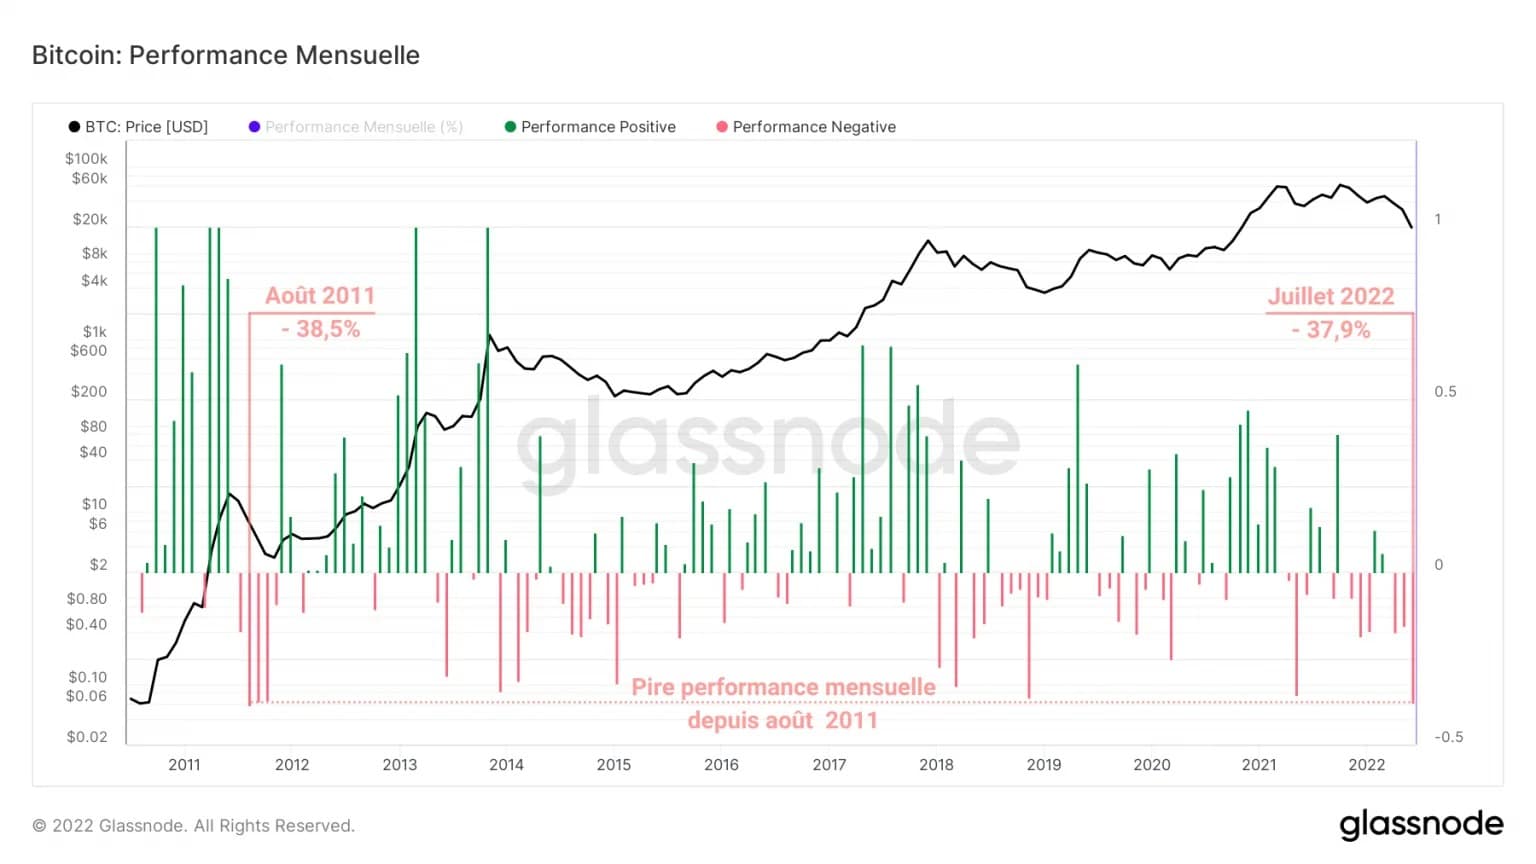
Figure 2: Monthly performance of bitcoin (BTC) price
Following such a record high, it is fair to ask whether we are closer to the end of the bear market than the beginning and whether the worst is behind us.
Given the current record levels of speculation, and despite the installation of strong demand, it is too early to say with certainty that a further decline is impossible.
Since the price broke through the $20k level, the popular belief that the ATH of the previous cycle was an untouchable bastion has been shattered.
That said, while this area has caused some to panic and sell, many investors have identified a rare buying opportunity.
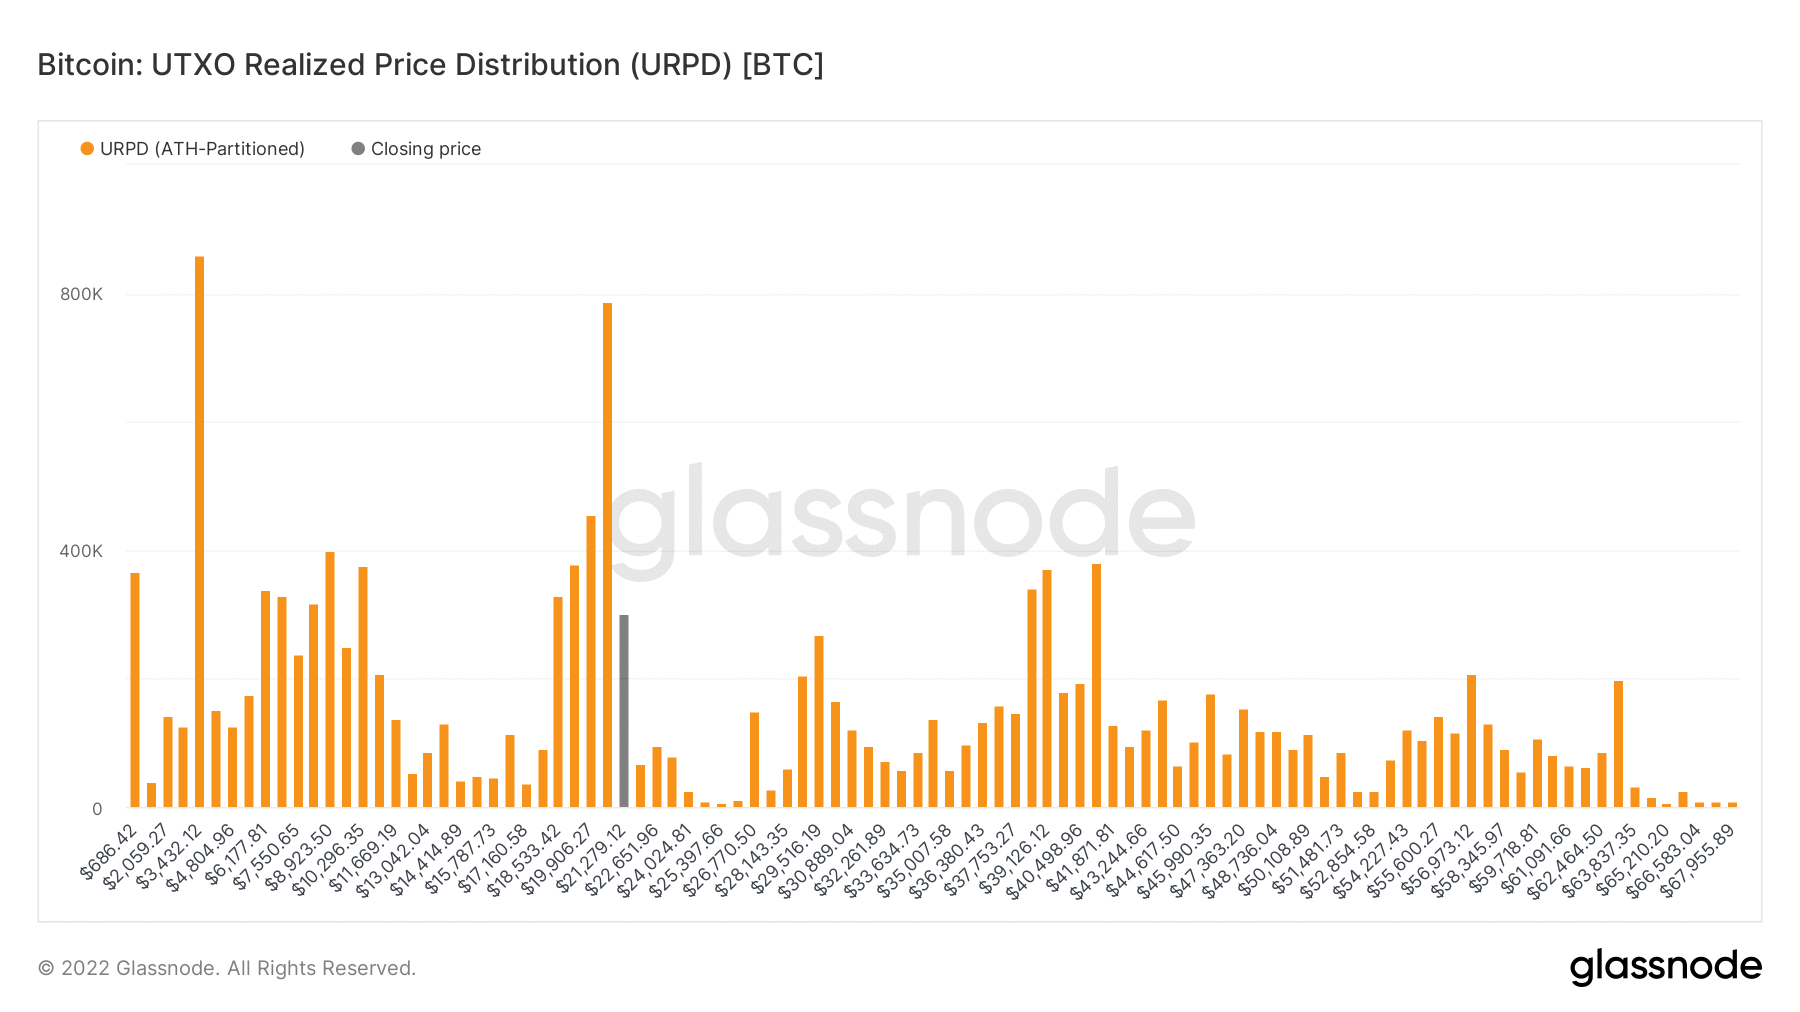
Figure 3: Evolution of the distribution of the realised price of UTXOs (1 May – 19 July)
As a result, more than 2.3 million BTC (12.4% of the outstanding supply) changed hands in the $18.5k to $22k price range
Now established, this strong cluster of trading volume provides a level of onchain support associated with the cost basis of new incoming entities, with the potential to turn into a bear market floor.
Transferring selling pressure to the long term
By studying the degree of profitability of losses/profits made by participants during recent price declines, it is possible to identify their spending behaviour and observe accelerations or slowdowns in their selling pressure.
For short-term investors, we can observe an increasing loss realisation ranging from -6% to -9.9% from 11 May to 16 June.
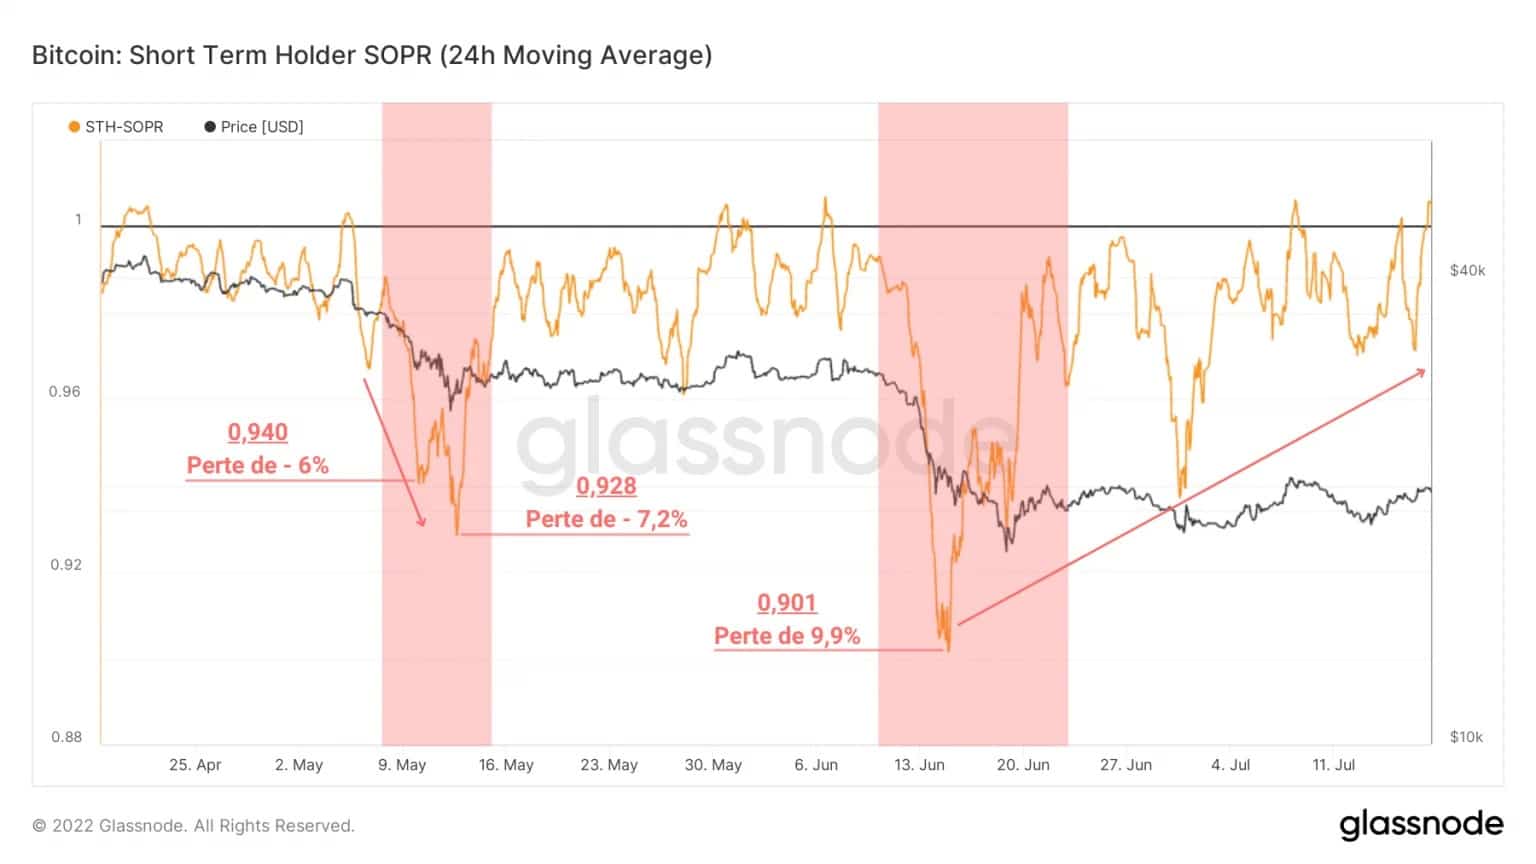
Figure 4: Profitability ratio of short-term investors’ expenses
Following the decline that brought the market to the $20k mark, the return on investment ratio for this cohort has gradually moved closer to the neutral zone (STH-SOPR = 1).
This dynamic can be observed at the end of short, medium and long term corrections and signals that the selling pressure associated with this cohort is easing following several months of forced distribution.
The profitability of spending by the long-term investor cohort, which includes all coins older than 155 days, has fluctuated greatly, while maintaining an overall downward trend.
Indeed, we can measure an increase in the magnitude of the loss taken by these entities, ranging from -21.5% in May to -40.9% in June.
In contrast to short-term investors, more seasoned investors are currently making huge losses, a sign that their beliefs are being tested.
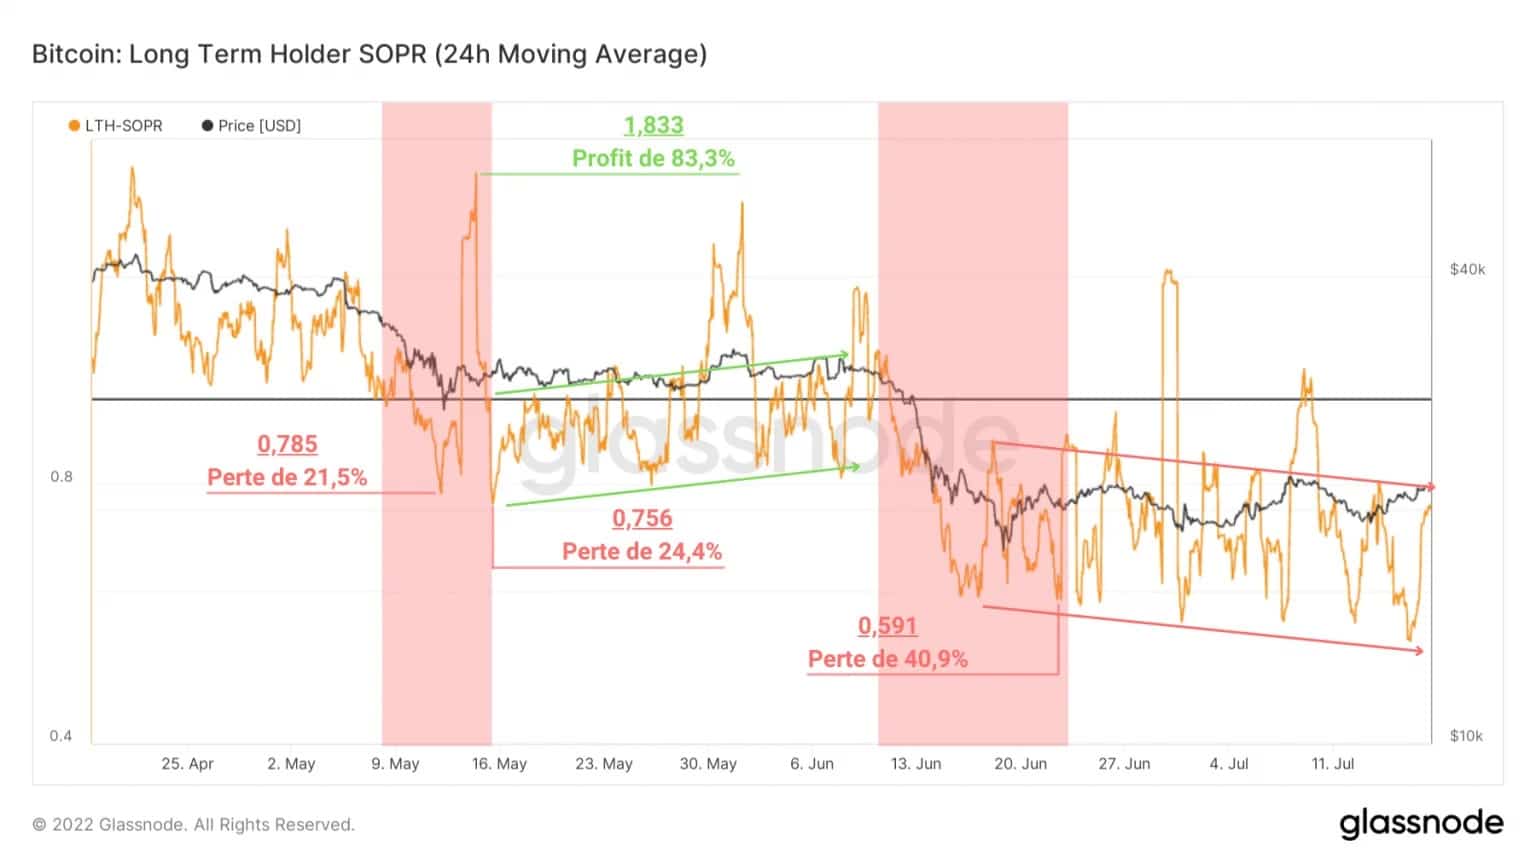
Figure 5: Profitability ratio of long-term investors’ expenses
The LTH-SOPR has been in a downtrend since June, indicating that LTHs are actively participating in the selling pressure. Today, the majority of the remaining selling pressure is coming from these entities.
The chart below represents the relative percentage of losing supply held by the two cohorts.
While the losing supply associated with STHs varies little over down cycles (peaks between 18% and 20%), the portion of supply held at a loss by LTHs tends to decrease over time, from 41.93% in 2015 to 28.85% in June 2022.
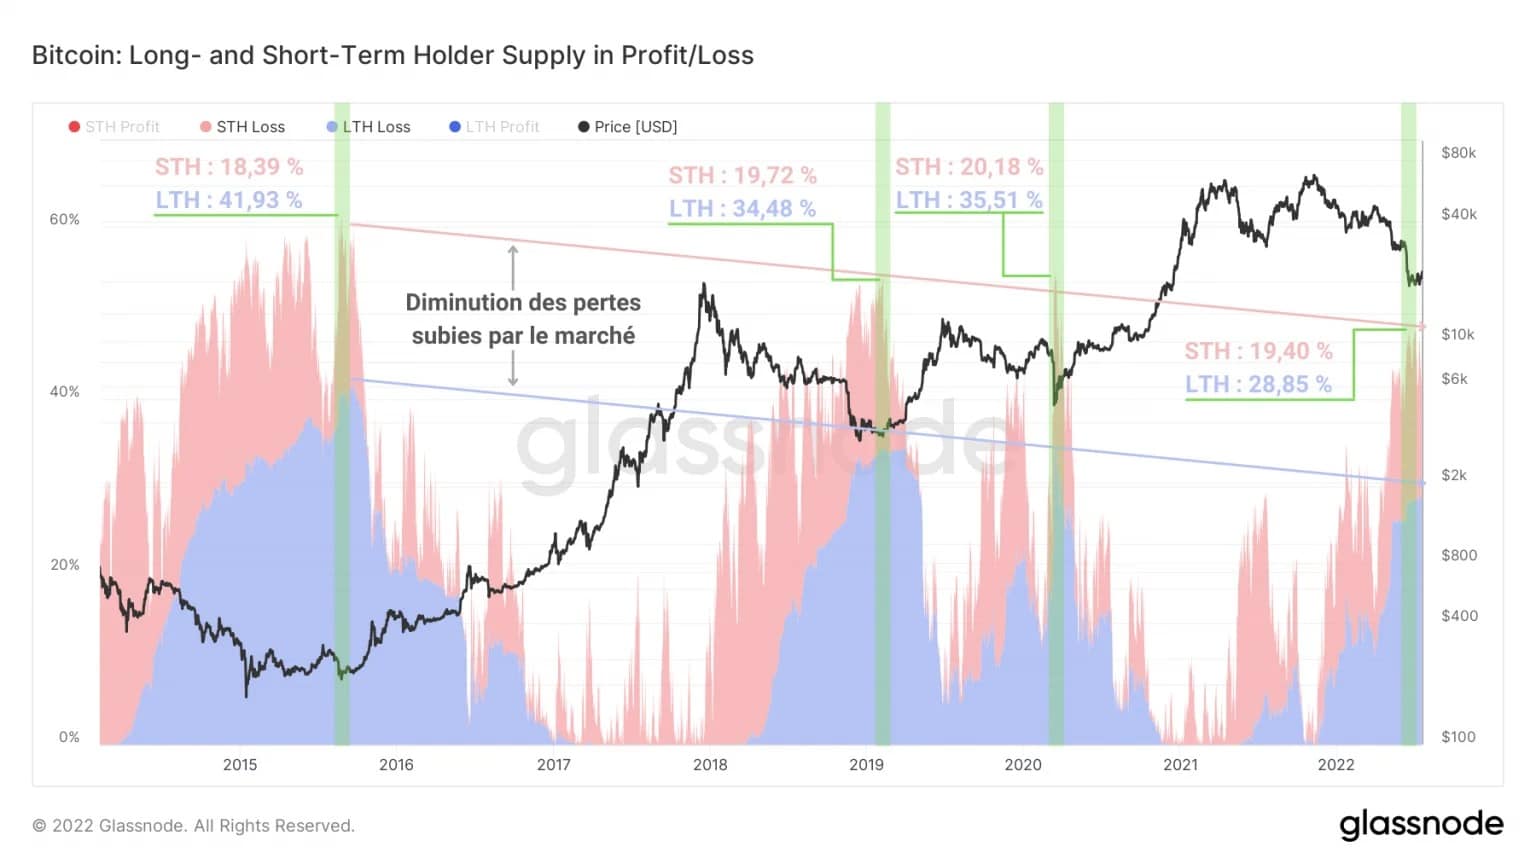
Figure 6: STH and LTH supply at a loss
Since long-term investors favour HODLing behaviour during bear markets and spending behaviour during bull markets, this dynamic suggests that selling pressure is running out, especially at this late stage of the bear cycle.
Given the LTH-SOPR development, however, we can expect a final market decline, forcing LTHs into a final sell-off.
Inversion of market momentum
Finally, let’s look at market momentum. Momentum is the momentum, the variable of inertia of an asset’s price as it trends.
Shown here on three time scales (14 days, 28 days and 140 days), the delta of the market’s realized gradient (in blue) measures the upward or downward tilt of the bitcoin price to gauge the strength of a move.
- Higher or deeper spikes mean more vertical and wider movements.
- An increasing price, coupled with successive new peaks, means more power with each move.
- A declining price, accompanied by negative peaks, indicates a dissipation of momentum.
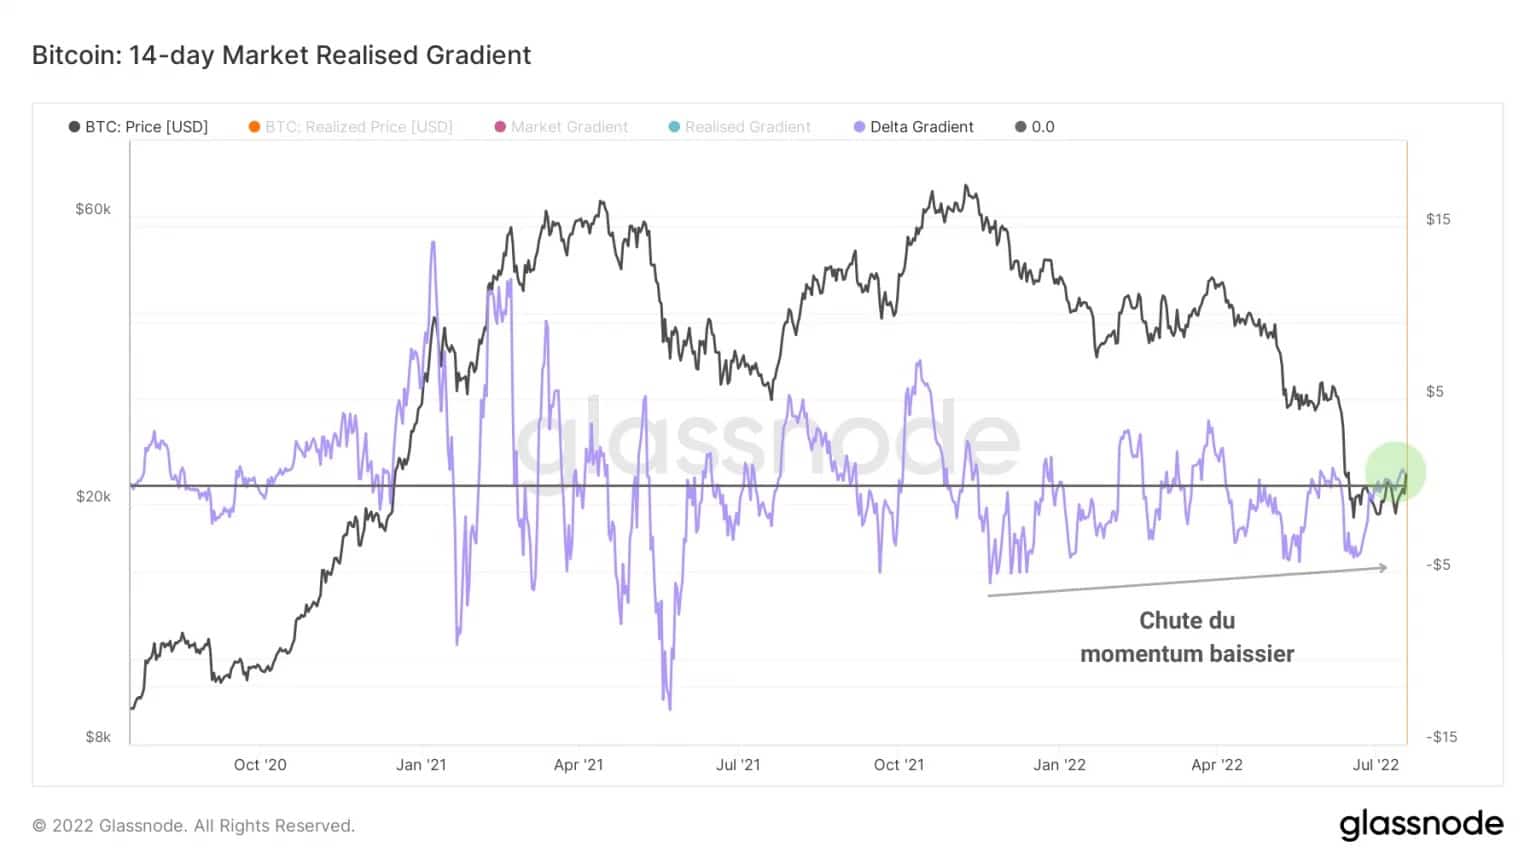
Figure 7: Delta of realised market gradient (14 days)
On both the short (14 days) and medium term (28 days) time scales, we can see two highlights:
- The deltas are currently positive, a sign that the market momentum is close to an inflection point that can be used as a pivot for a trend reversal.
- The bearish amplitudes of these two oscillators are narrowing, a sign that bearish inertia is falling, with each wave of selling gradually depleting the selling pressure.
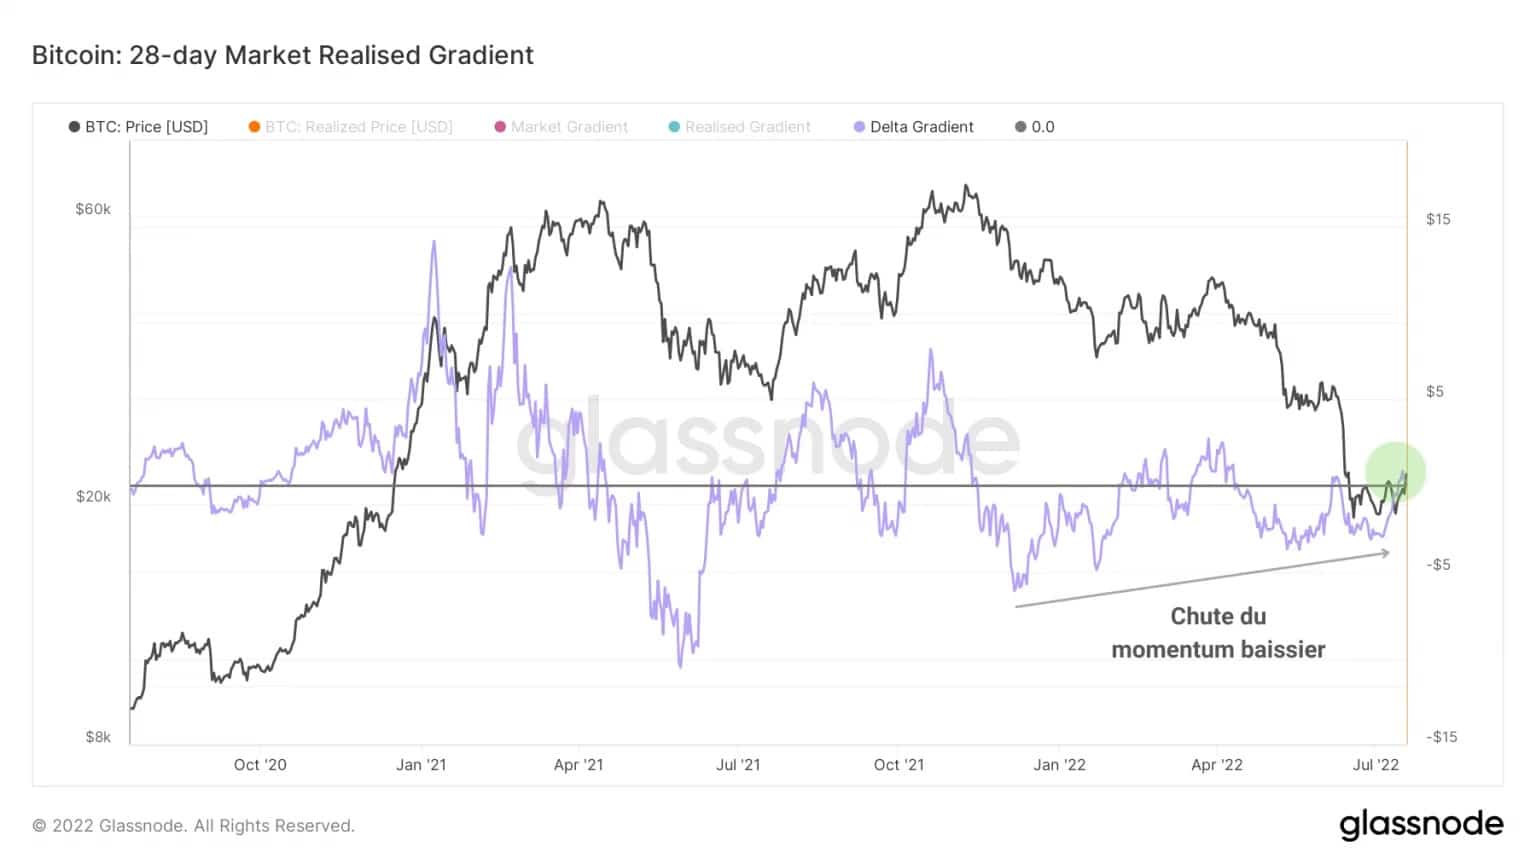
Figure 8: Delta of the realized market gradient (28 days)
Given these observations, a short to medium term uptrend of several weeks to 1 or 2 months is possible if both oscillators take support above the neutrality zone. This bullish divergence corroborates technical indicators such as the RSI.
However, while it is encouraging to see positive momentum in the short to medium term, these indicators can only signal a full trend reversal if the 140-day chart is also positive.
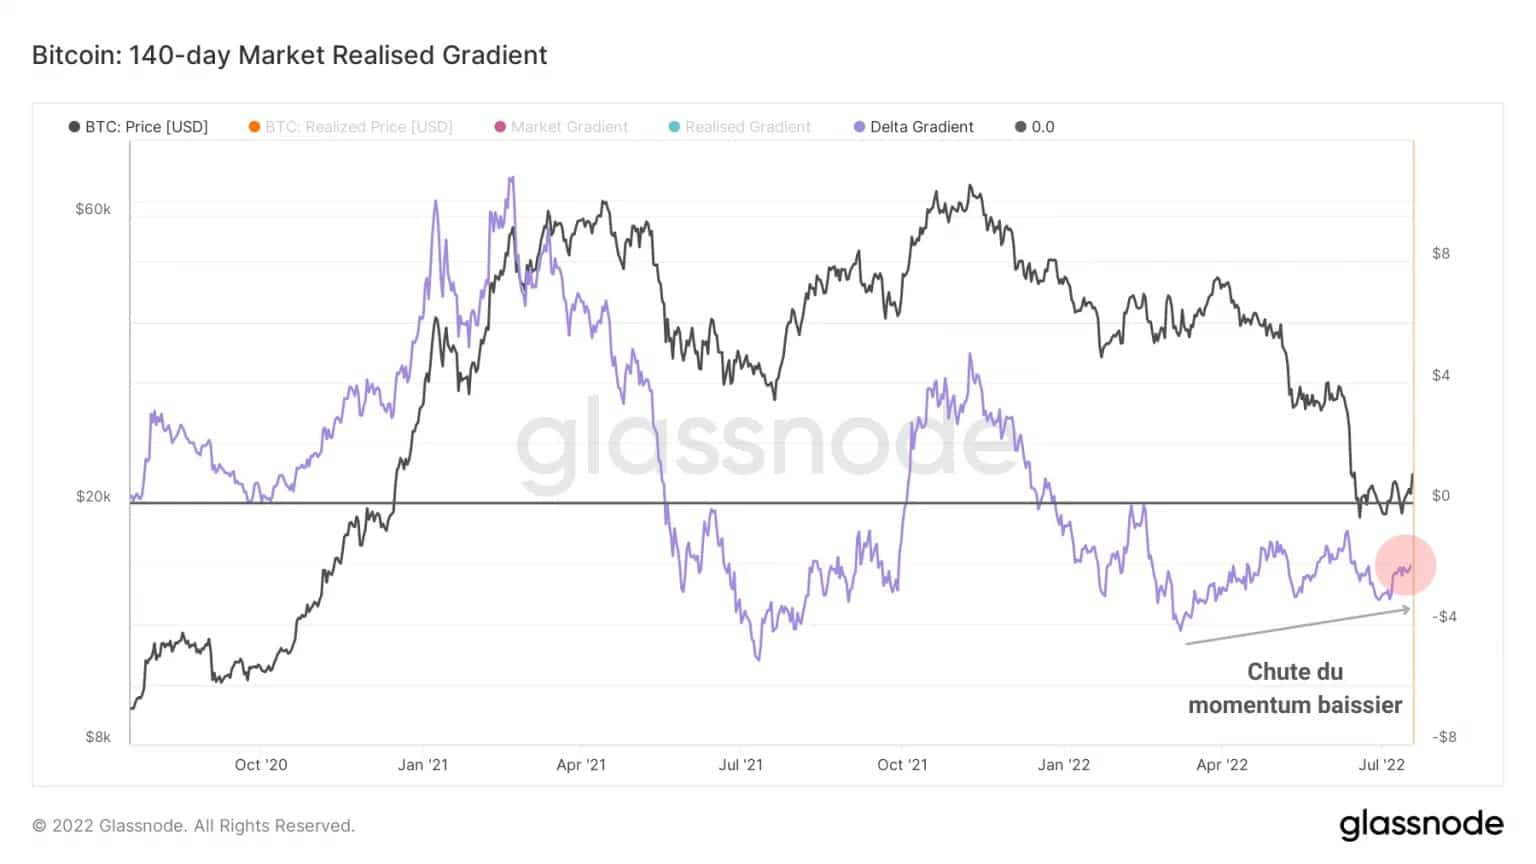
Figure 9: Delta of the realized market gradient (140 days)
In order to confirm with certainty a bull market reversal and the return of a multi-year bull market, we will have to wait for:
- The return of a positive long-term momentum, which is not the case at present.
- Confirmation that this inertia is in a stable direction, testing the neutrality zone as long-term support.
Note, however, that this oscillator is also indicating increasingly smaller bearish amplitudes, which is a constructive first signal.
Summary of this onchain analysis
In sum, this week’s data has allowed us to determine that, despite a historically low monthly performance and the realization of record losses during the two violent falls in May and June, the market is at a level that can be considered a bear market floor.
With over 2.3 million BTC changing hands in the $18.5k-$22k price range, there is significant trading volume that is acting as short-term support for the time being.
While the magnitude of losses realised by short-term investors is falling, the selling pressure stored up by long-term investors has not yet been fully expressed.
The short and medium term price momentums indicate that a potential upside of a few weeks to 1 or 2 months is possible if the market breaks out of the upper bound of the current range. However, a long-term trend reversal is not yet identifiable.
Sources – Figures 2 to 8: Glassnode