
Bitcoin (BTC) remains subject to the uncertainty of the traditional financial markets and is struggling to stand on its own amidst a challenging macroeconomic and geopolitical environment. Testing the $30,000 support, a powerful wave of selling is testing the spot markets. As the STHs gradually exhaust their selling pressure, the LTHs start to panic. On-chain analysis of the situation
BTC falls slowly… then suddenly
Bitcoin (BTC) price breaks through $36,000 support with vigour and tests the $30,000 level, triggering a powerful wave of selling on spot markets overnight.
Back on key technical support, representing an area of significant liquidity, BTC is now caught between the prevailing selling pressure and the pragmatism of investors who see the decline as a rare buying opportunity.
Despite the encouraging fundamental dynamics identified over the past few weeks, the price of BTC remains subject to the uncertainty of the traditional financial markets and is struggling to stand alone in the midst of a deleterious macroeconomic and geopolitical environment.
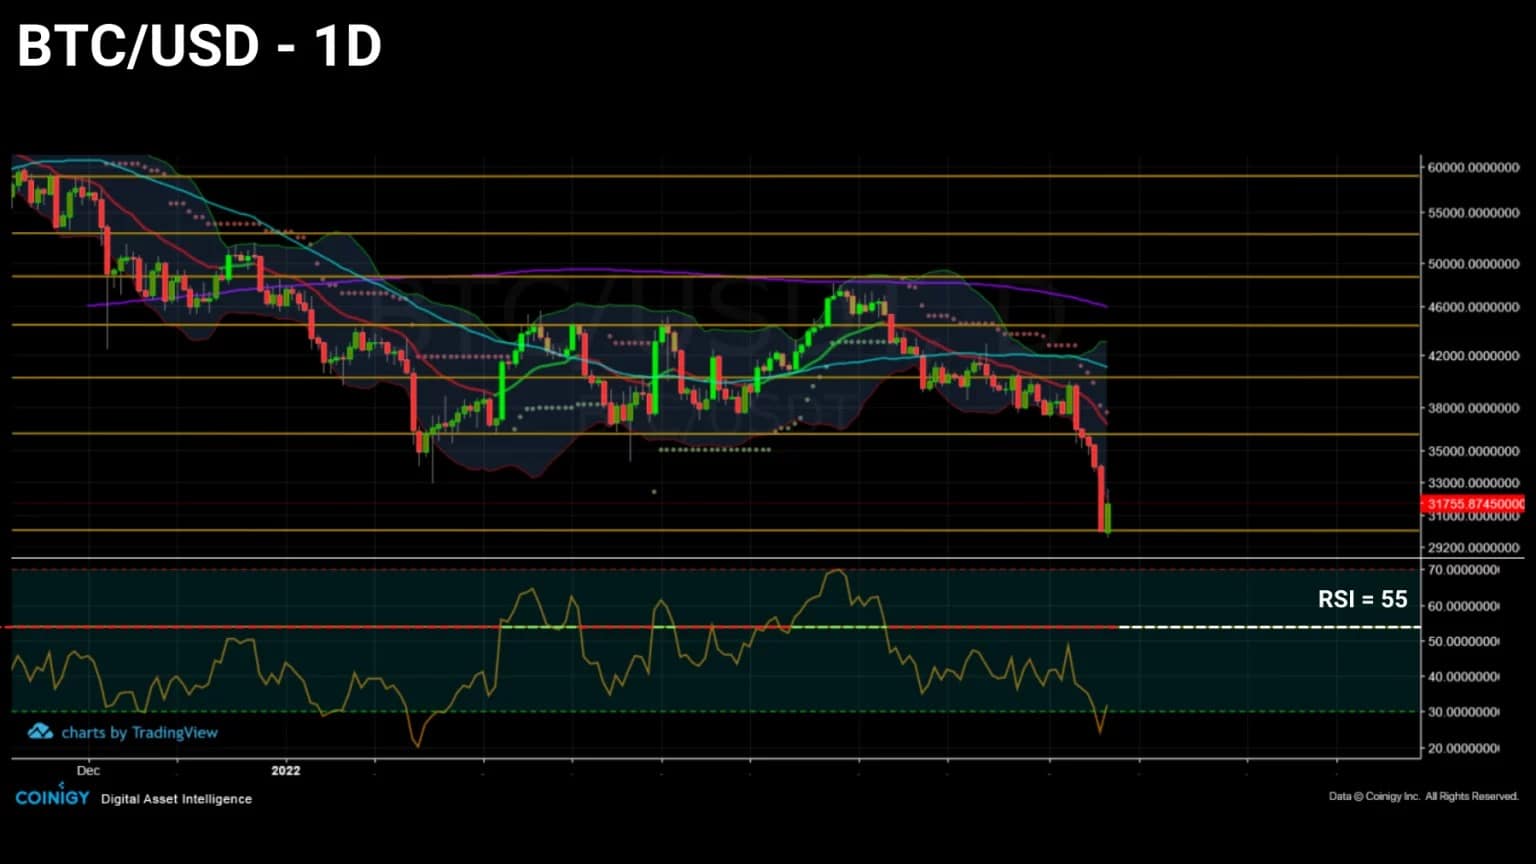
Figure 1: Daily Bitcoin (BTC) price
Given the recent price drop, this week’s analysis provides a global view of the behaviour of different investor cohorts, which will be supported in a future edition by a particular focus on the LTH response to ongoing events.
The aim is to avoid a knee-jerk reaction to current events and to maintain an objective bias, devoid of emotion or urgency about the vagaries of the market. Let’s allow time for movements to form and events to decant in order to better understand the underlying dynamics.
So today we will look at the behaviour of short-term (STH) and long-term (LTH) investors in the face of uncertainty before looking at the recent flow dynamics of exchanges and market participants’ use of the Bitcoin network.
Long-term investors close to capitulation
The profitability status of the network is an essential aspect to investigate if we want to know how much buying or selling pressure is at play in the market.
Visualising the percentages of outstanding supply, existing addresses and unique entities in a profitable state, the graph below presents their average variation over the last 30 days in the form of an oscillator.
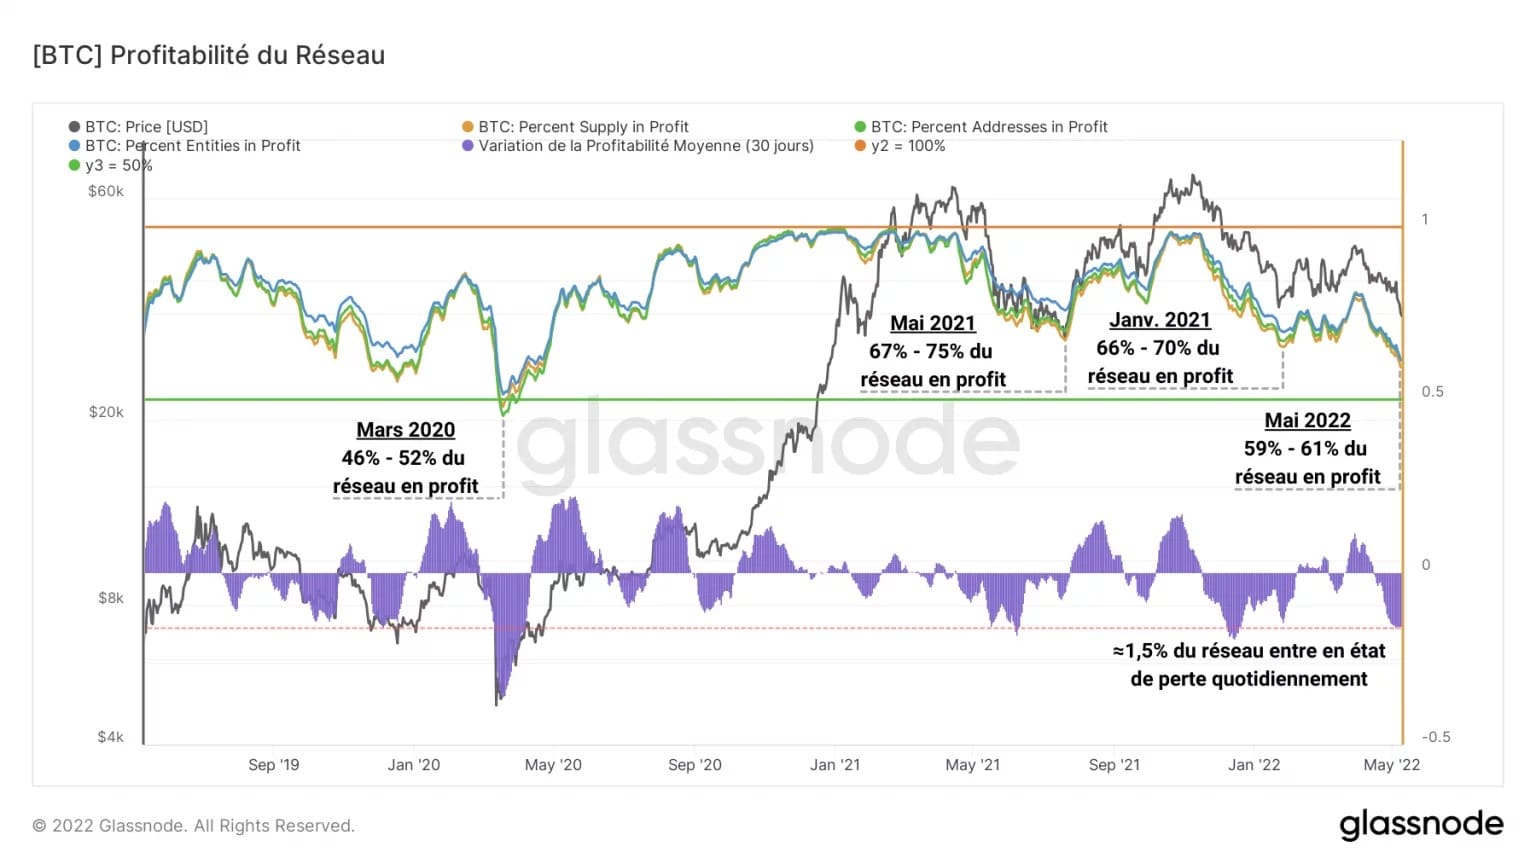
Figure 2: Bitcoin network profitability
With nearly 60% of the Bitcoin network now in a state of profit, the ongoing decline exceeds the capitulations of May 2021 and January 2022 in terms of perceived pain.
Although the 50% threshold reached in the March 2020 flash crack has not yet been reached, this is a plausible possibility in the short to medium term.
Plunging more than a hundredth of the network underwater every day for the past week, the BTC price is driving the profitability of all cohorts to relatively low levels and testing investor conviction.
The following chart models the change in 90-day profitability of the STH and LTH cohorts.
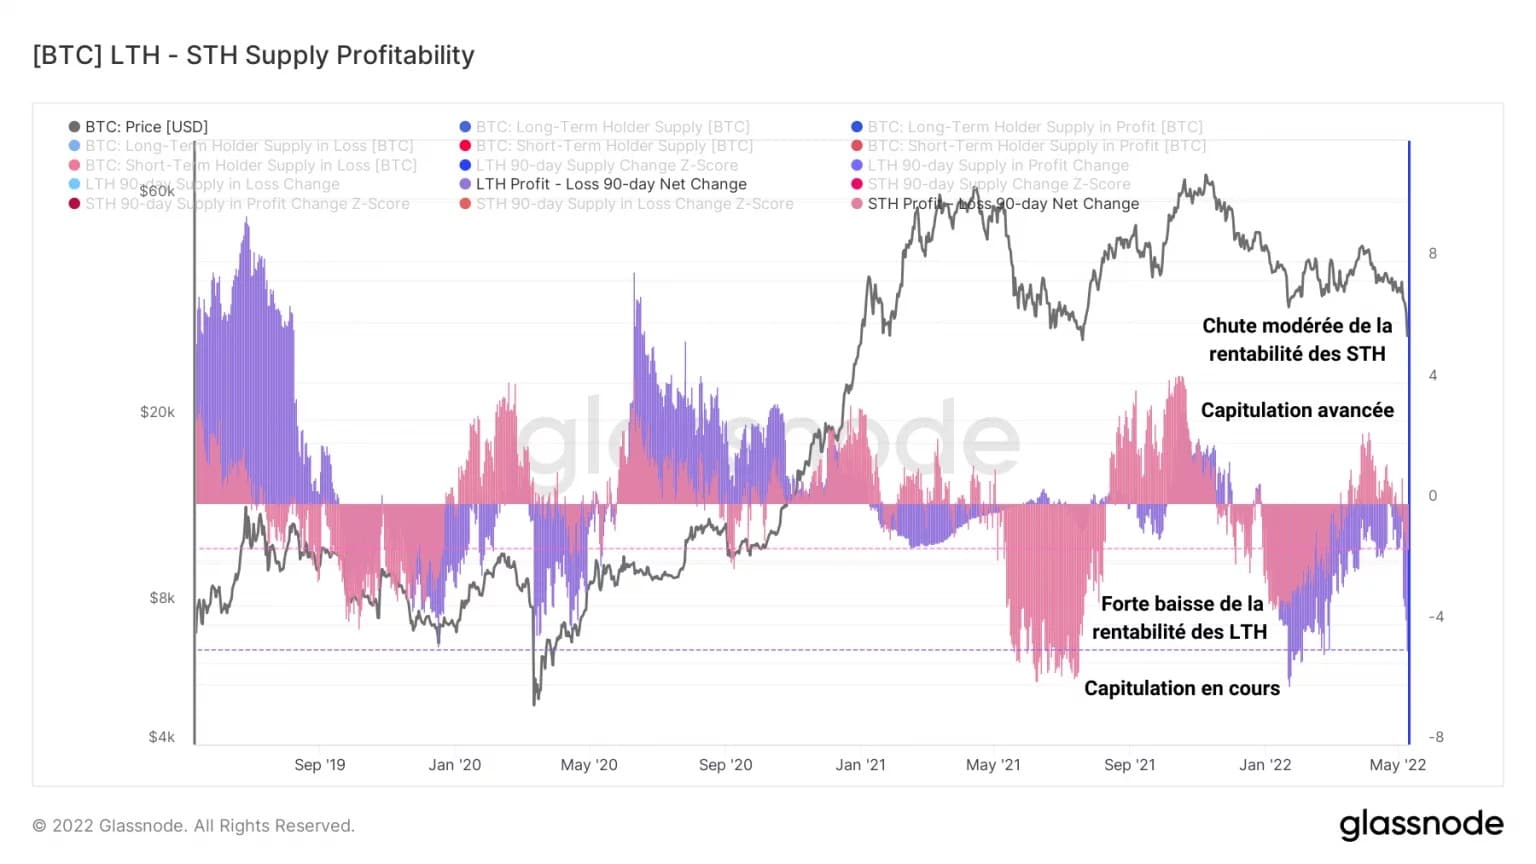
Figure 3: Variation in 90-day profitability of STH and LTH
What is important here, and what we will develop in more detail next week, is the fact that long-term investors are currently experiencing a significant decline in their overall profitability compared to short-term investors.
There are several reasons for this divergence:
- STHs have been underwater and capitulating slowly since January 2022, gradually depleting their average selling pressure.
- Hitherto profitable LTHs are now below their break-even point and are liquidating part of their holdings, abandoning their position as insensitive HODLers in the face of bearish volatility.
- Other LTHs already in a loss position after having accumulated many BTC around $40,000 are taking a short-term defensive stance, reselling the supply accumulated over the last few months.
With short term investors having largely capitulated in the previous weeks, tonight’s drop is a final blow to them and a test of the conviction of long term investors.
Indeed, the supply held by STHs is down, reflecting a short bias and defensive behaviour since last month. Now accounting for 15.44% of the outstanding supply (2.94 million BTC), the cohort is easing in response to BTC’s short-term price action.
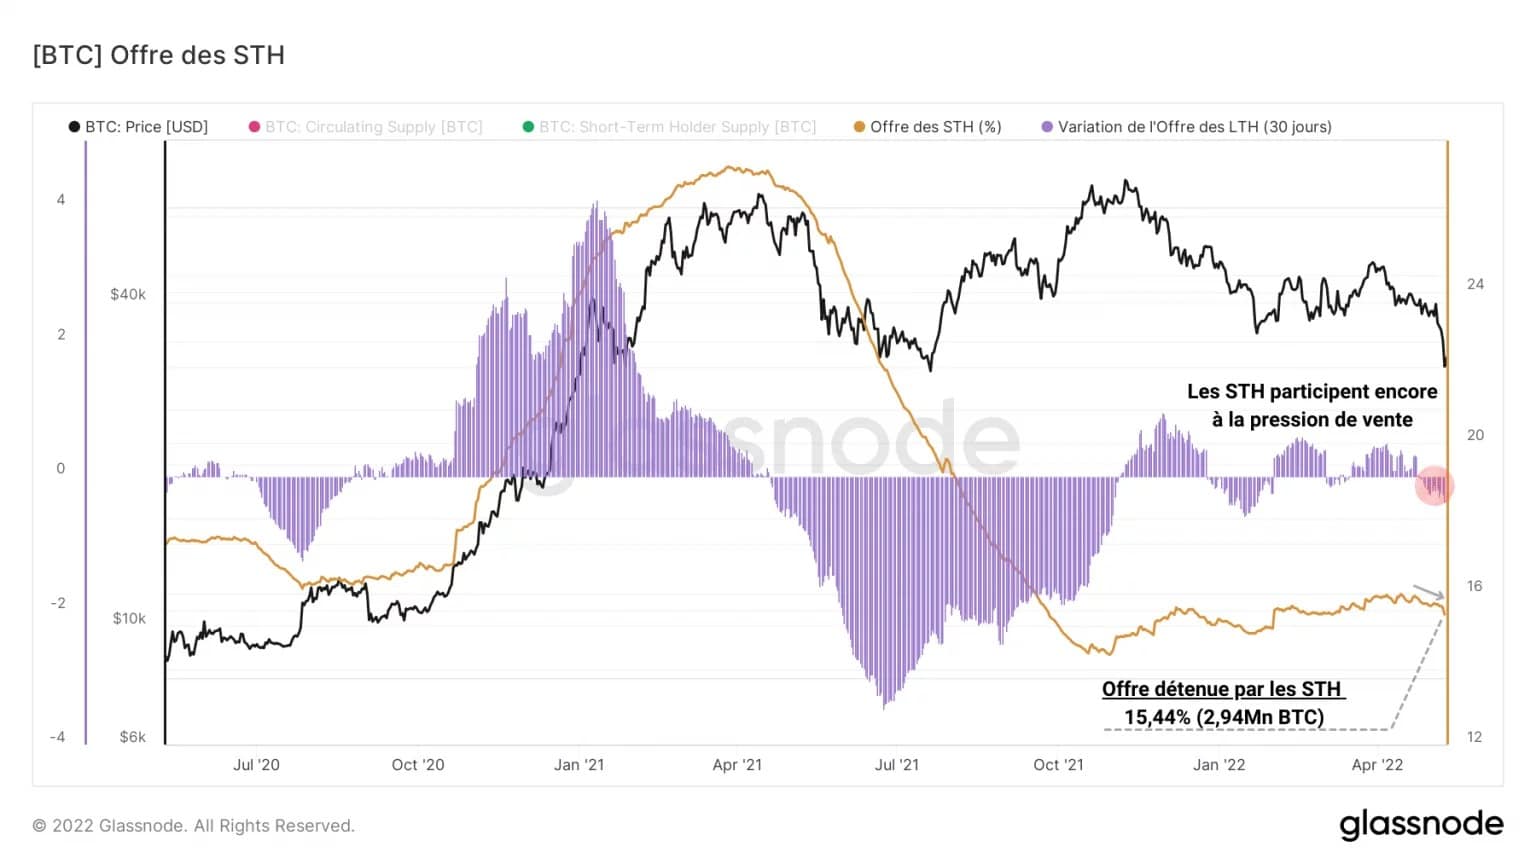
Figure 4: Change in supply held by STH (%)
Similarly, the supply of coins older than 155 days is starting to dip, indicating that some LTHs are sufficiently distressed to prefer spending to saving. While their overall cohort behaviour is still buying on a monthly basis, the reaction of LTHs over the next few days will deserve close attention.
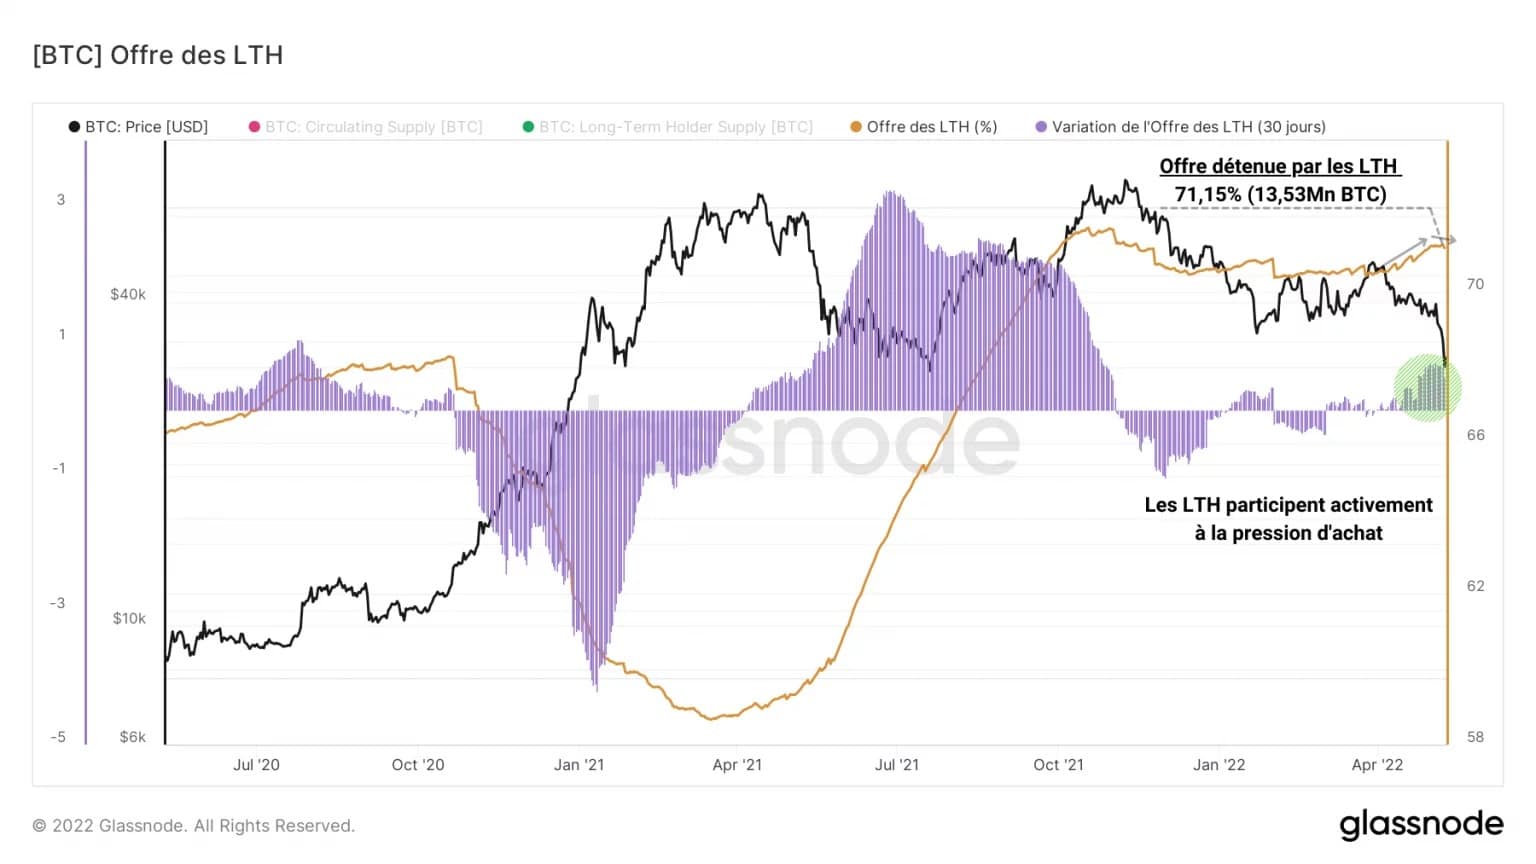
Figure 5: Change in supply held by LTH (%)
It is now clear that we are entering the advanced phase of the bearish move initiated in late 2021 and that the behaviour of LTH will determine what happens next, steering the market towards a final capitulation involving the entire cohorts present or towards a consolidation potentially leading to a bullish reversal after making the $30,000 level the new local floor.
A major wave of deposits on exchanges
It is common to see capital flowing into exchanges during strong bearish moves, indicating a willingness to sell by some participants.
In this sense, the short-term response of the market overnight is evident on the exchange inflow metrics and allows us to gauge the extent of the overall selling sentiment.
With an inflow of around 90,000 BTC over the past few hours, exchange reserves are experiencing increasing deposit spikes, indicating that this bearish move has panicked a significant number of entities.
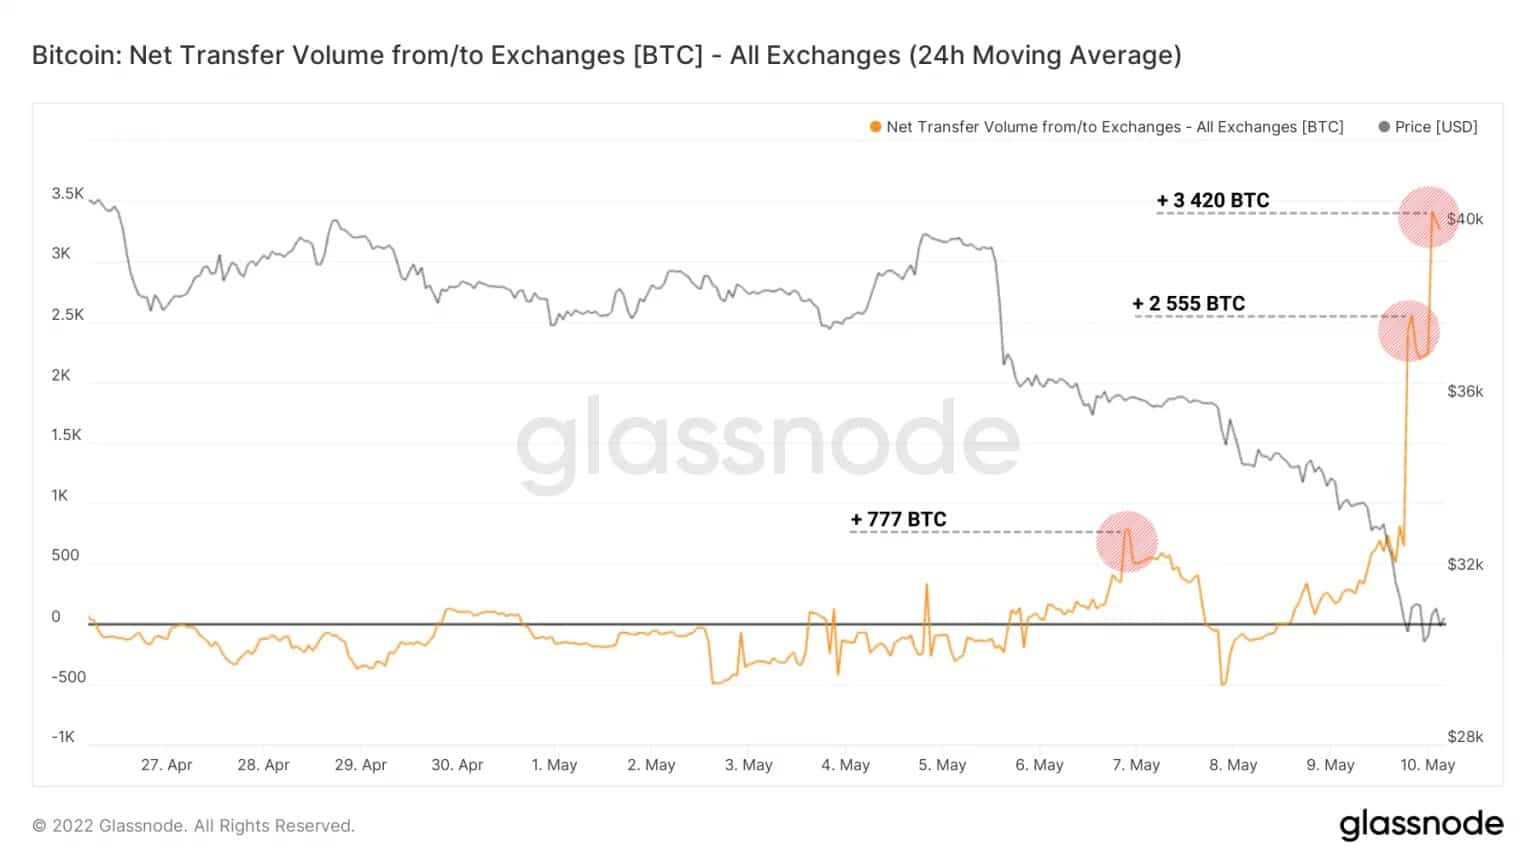
Figure 6: Exchanges inflows
However, overnight, the Luna Foundation Guard liquidated its entire BTC reserves in order to deploy capital to stabilize the UST algorithmic stablecoin, adding to the selling pressure by moving several tens of thousands of BTC to Gemini and then to Binance.
The LUNA BTC wallet has now been emptied for the second time today after they returned 850 mil.
Supposedly the balance has been sent to Binance.
Their reserves now at 0 pic.twitter.com/mtQ23oPnDT
– Daxx (@DaxxTrader) May 10, 2022
Provoking a significant 3.56% rise in BTC reserves, these inflows confirm the market’s entry into an advanced capitulation phase and the state of sustained investor suffering.
While the spending behaviour is premium in the short term and provides rare buying opportunities for the more persistent, it will indicate by its reversal and the fall in exchange reserves a return of the buying bias which we will identify in due course.
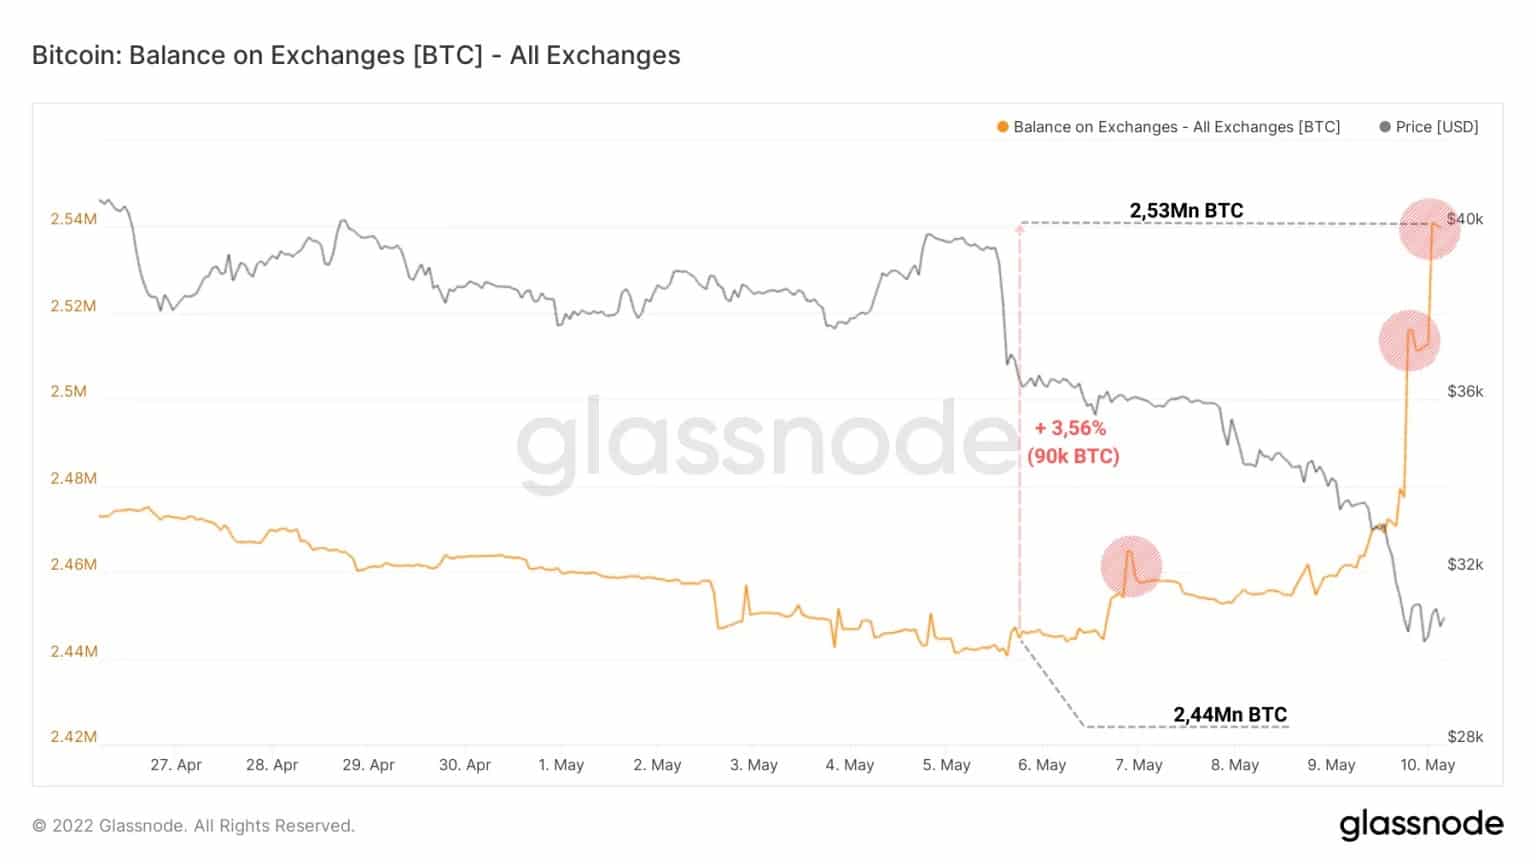
Figure 7: BTC reserves on exchanges
In response to this wave of inflows, transaction fees charged by exchanges have increased modestly but noticeably given the current environment.
With an exacerbated dominance of deposit fees (in pink), this metric confirms the strong willingness to sell of some investors, ready to pay high fees to see assets deposited (and probably sold) as soon as possible.
This behaviour is symptomatic of the current state of panic in the market: many investors are rushing to the exchanges in search of a sale and are rushing to spend their assets even if it means paying a high price.
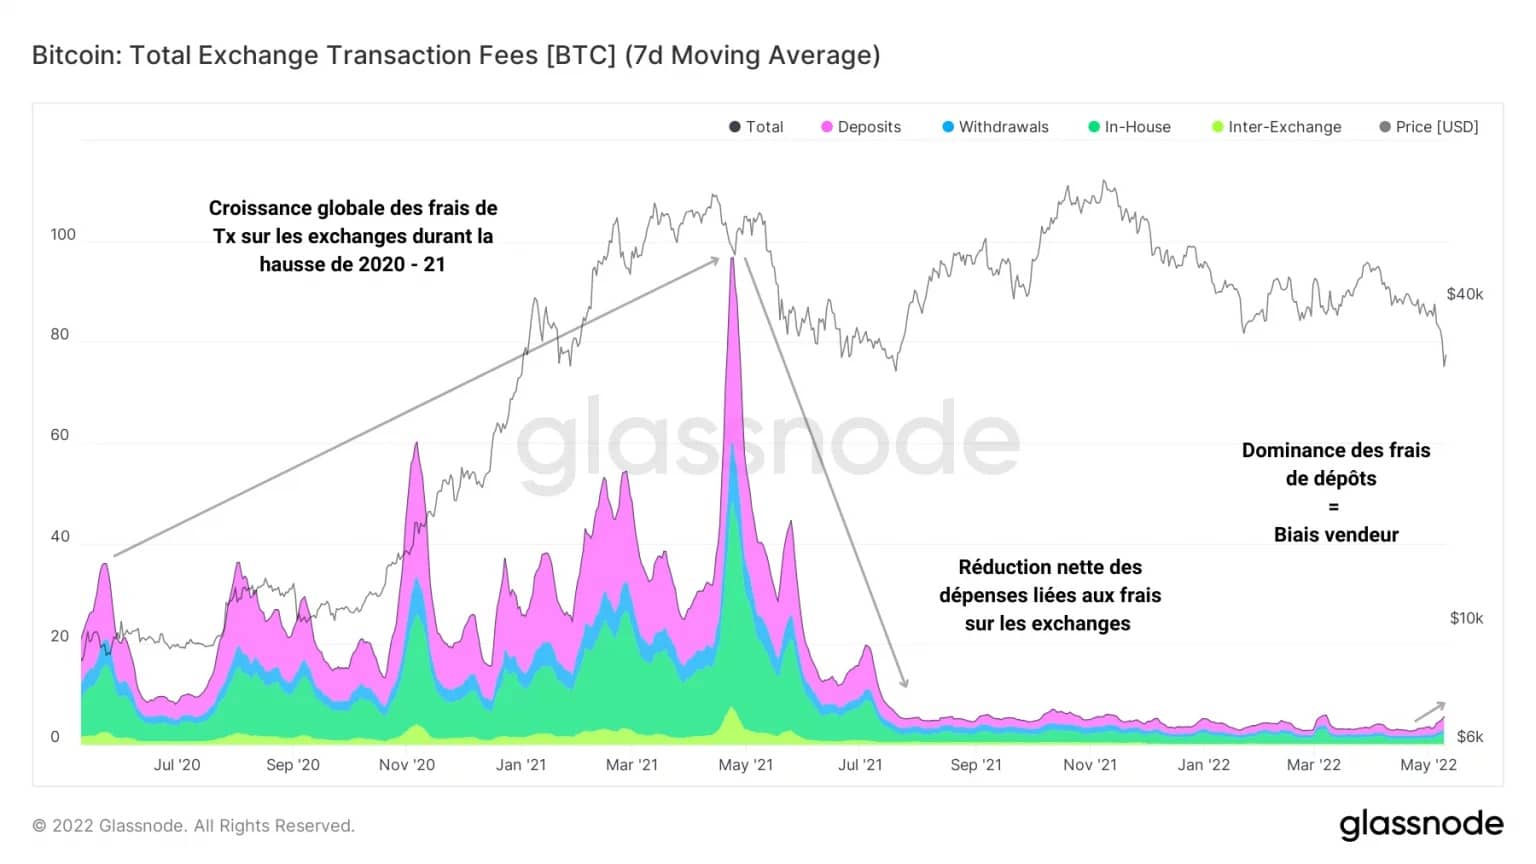
Figure 8: Exchange transaction costs
While the cohort of miners did not panic last night, it is pertinent to note a notable growth in outflows from their portfolios since the end of 2021.
Indeed, as the BTC price has continued to fall, the USD reward per Exahash provided has also fallen, pushing miners to spend more BTC to cover their CAPEX and OPEX expenses.
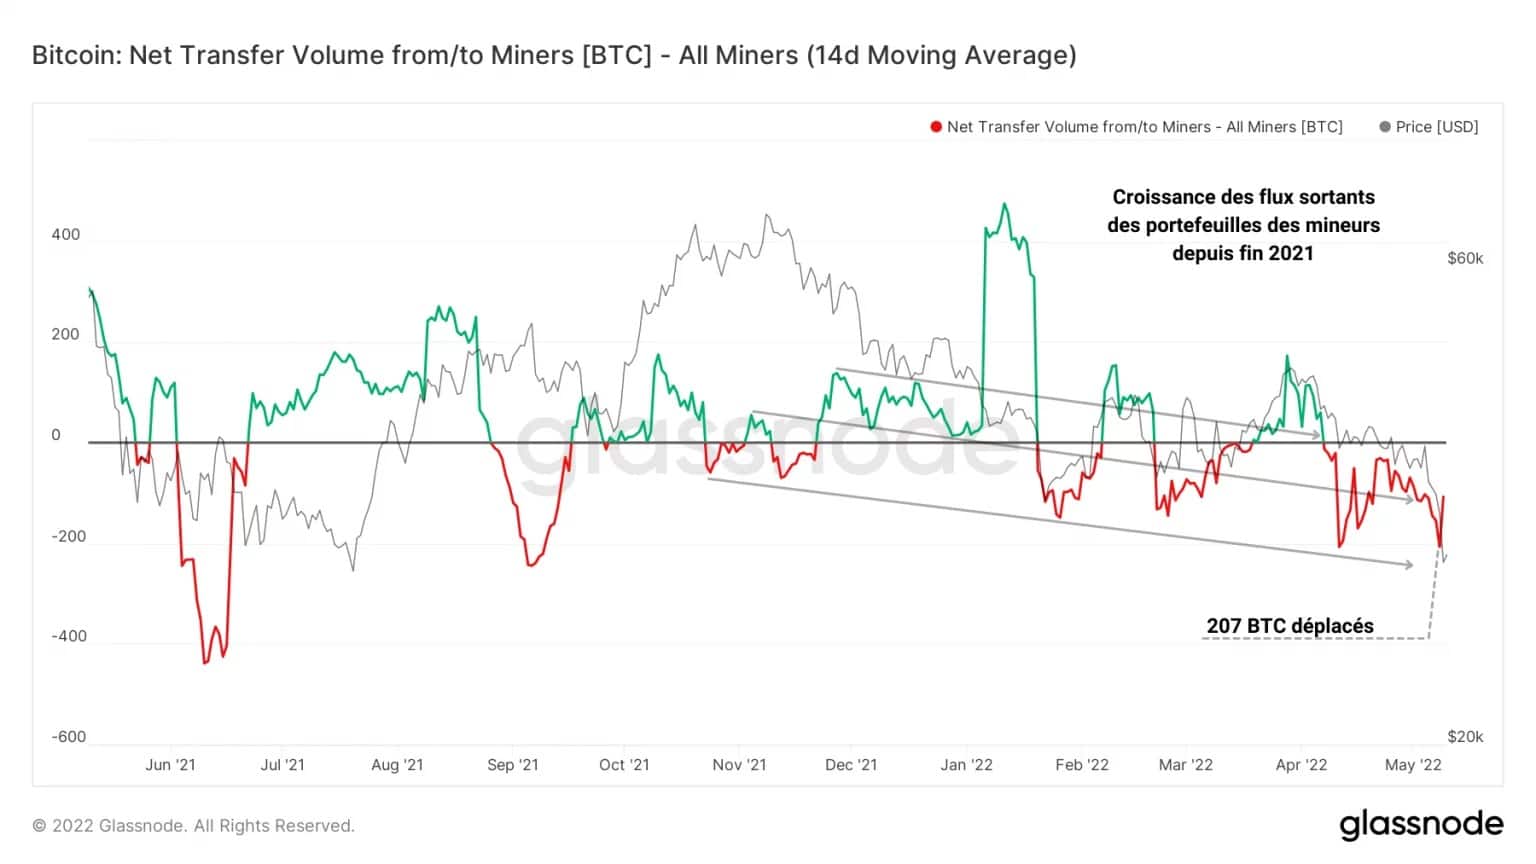
Figure 9: Net wallet flows associated with miners
In doing so, miners have also made a small but significant contribution to the selling pressure and inflows on exchanges over the past few months, although the overnight drop has not caused them to flinch at this point.
It is instructive to see that, in contrast to the capitulation in May, miners are holding firm and not yet forced to pull the plug on their machines for profitability.
Despite palpable market pain, the Bitcoin network remains fundamentally stable to date, showing encouraging resilience.
Long-term growth of economic activity on Bitcoin
Indeed, despite a serious lack of economic commitment and demand for the blockchain, the long-term growth of on-chain activity provides a constructive fundamental argument for the months ahead.
The graph below shows the number of unique active entities over time as well as the number of new entities appearing on the Bitcoin network for the first time.
The white dotted line shows a growth channel that supports the long-term trend of on-chain activity on the network and serves as a benchmark for average investor engagement.
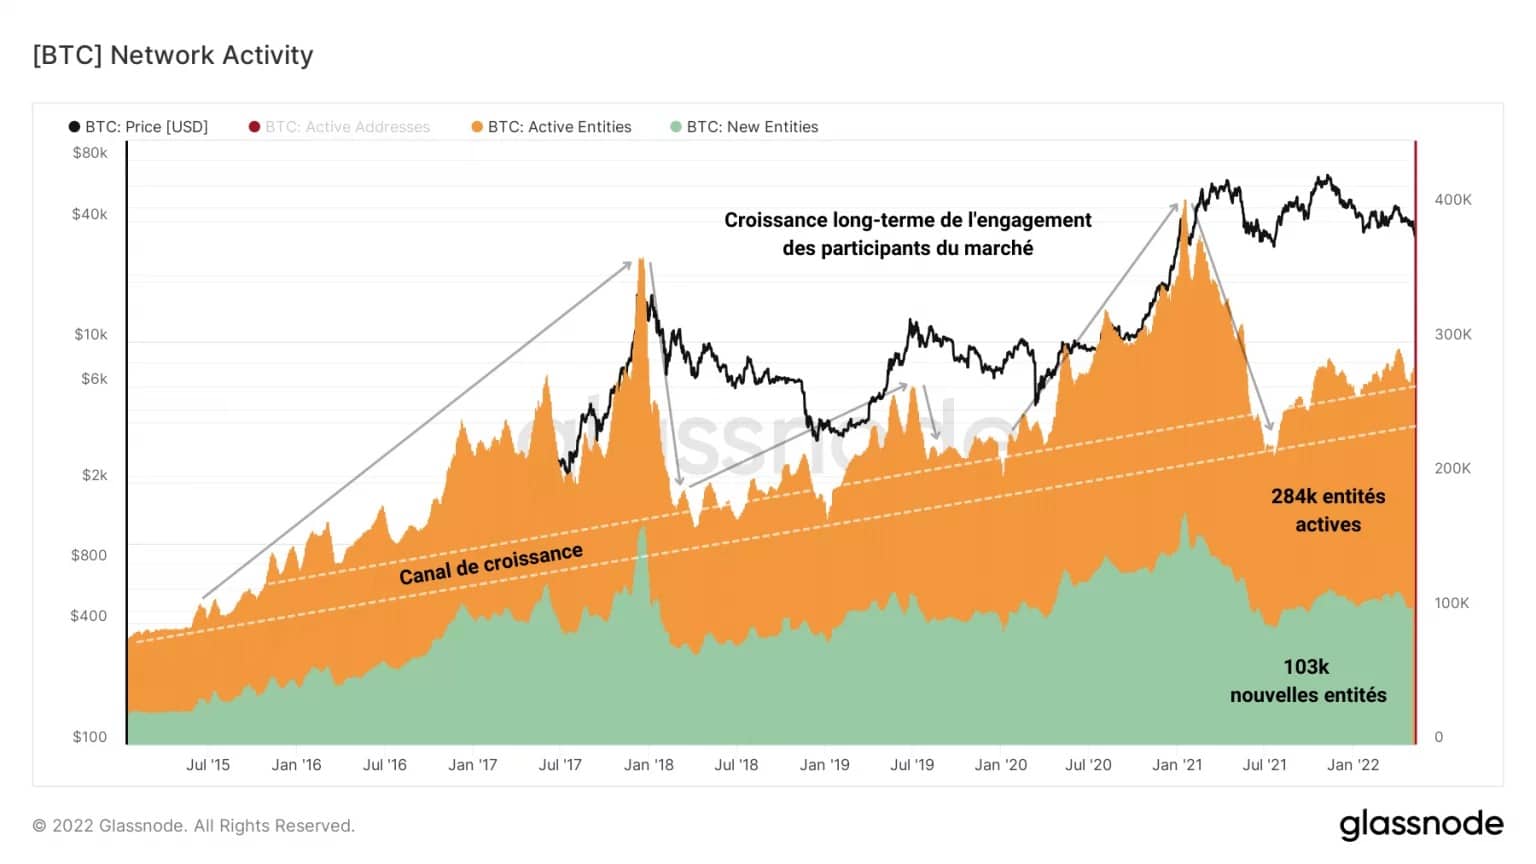
Figure 10: Number of active and new entities
After a quick reading, we can notice a notable weakness in the number of active entities composing the economic fabric of the network and a lack of growth in the number of new entities.
Testifying to the lack of interest in Bitcoin by participants, the current state of the network is similar to previous bear market phases such as those preceding the final capitulation in December 2019 and the one in March 2020.
The long-term growth channel is still acting as a support for on-chain activity today and suggests that a local floor in the BTC price may be reached in the coming weeks.
This observation is corroborated by the evolution of the number of transactions. With approximately 227,000 transactions settled daily, the Bitcoin network is now recording activity equivalent to that of November 2021, at an ATH of $69,000.
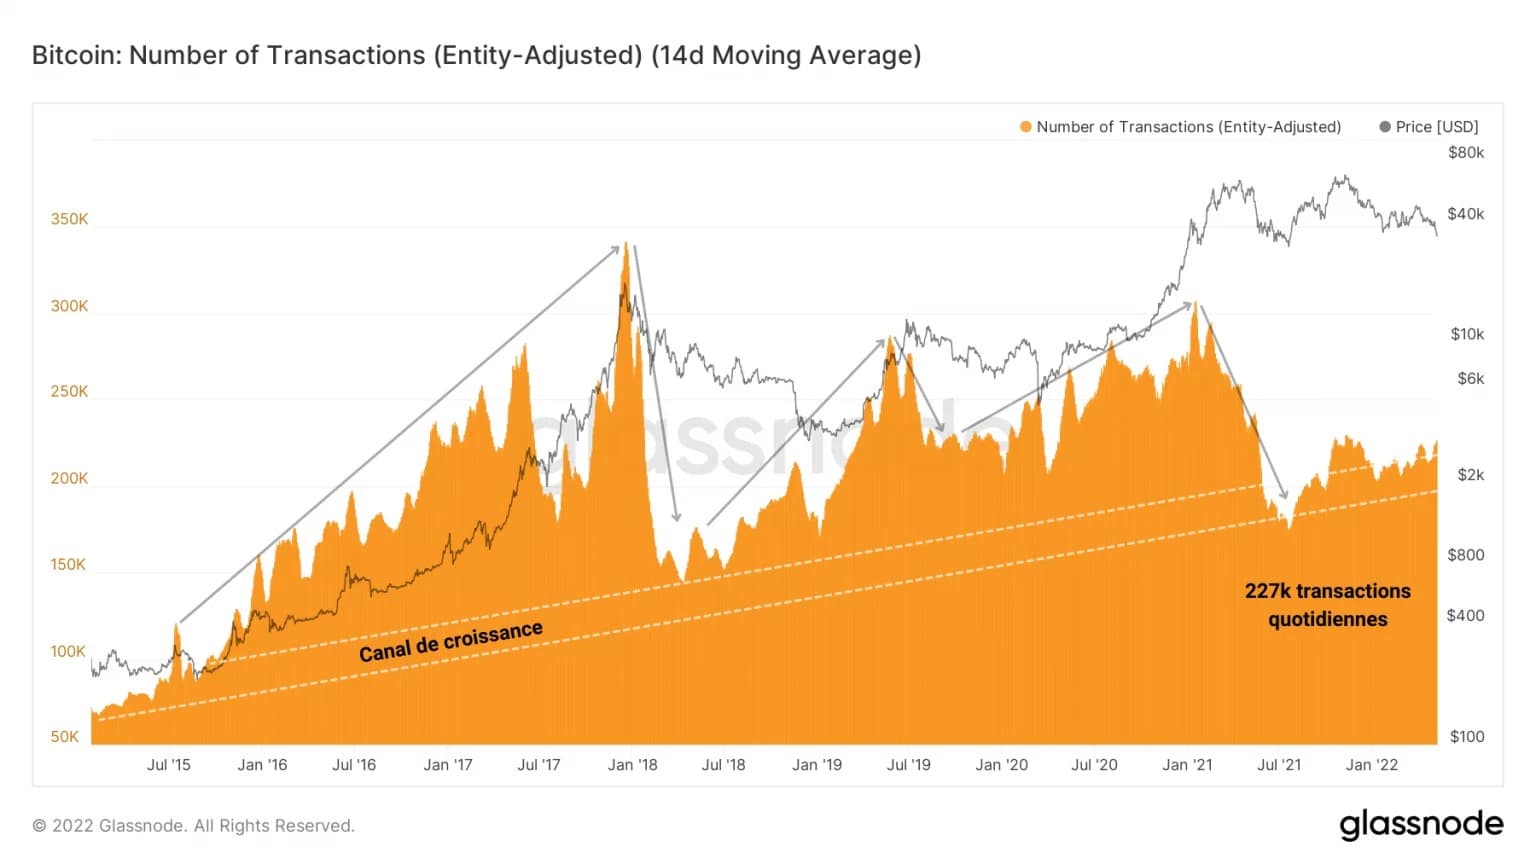
Figure 11: Number of daily transactions
The ongoing structural uptrend in these metrics indicates that, despite relatively low on-chain activity compared to bullish periods, the long-term upward momentum of the commitment remains valid to date.
However, it should be noted that the volume of transfers settled on the channel has been declining since the end of 2021 and there is no indication of a reversal of this trend at the moment.
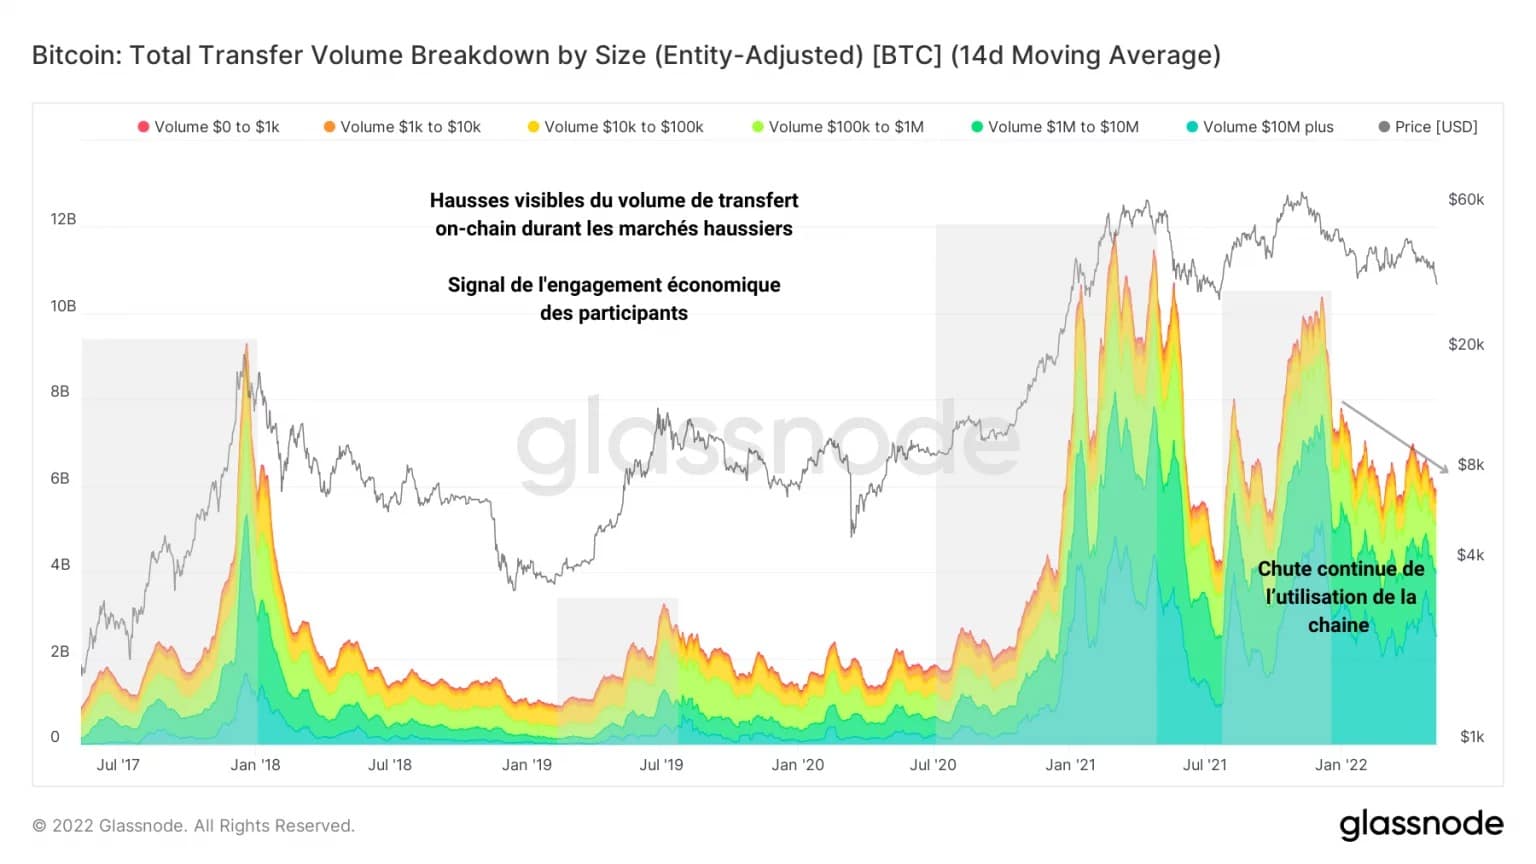
Figure 12: Daily transfer volume by transaction size
With $5.7 billion transferred daily through the network, 40% of which represent transactions of more than $10 million, it seems that individual users are gradually deserting the network in favour of companies or individuals with large amounts of BTC.
Summary of this on-chain analysis
The recent fall in the price of bitcoin (BTC) has caused many investors to panic. As STHs slowly exhaust their selling pressure, LTHs are starting to panic sell. The decline that has been in place since late 2021 is entering its final phase and testing the conviction of HODLers.
In response to the test of the $30,000 level, a large wave of deposits indicates that investors are rushing to sell as the Luna Foundation Guard liquidates their holdings on Gemini and Binance. Miners participate modestly but noticeably in the selling pressure without showing significant signs of weakness.
Finally, despite a period of relatively low on-chain activity, the upward momentum of the long-term commitment remains valid today and gives us confidence in the resilience of the network and the market over a time horizon of several months to several years.