
While a proper capitulation has taken place, holders of BTC, ETH and stablecoins are withdrawing their capital from centralized exchanges in a massive way. This exodus, coupled with the difficulties faced by some market makers, has caused a liquidity crisis across the BTC and ETH markets. On-chain analysis of the situation
Bounce to $15,000 level
Following the invalidation of the $18k support a fortnight ago, the Bitcoin (BTC) price is moving uncertainly, forming a temporary floor at the $15,000 level.
Plunging a significant portion of BTC holders into a state of latent loss, the recent bearish move has triggered a wave of loss realisation of historic proportions, with over $1 billion in daily losses over the past week.
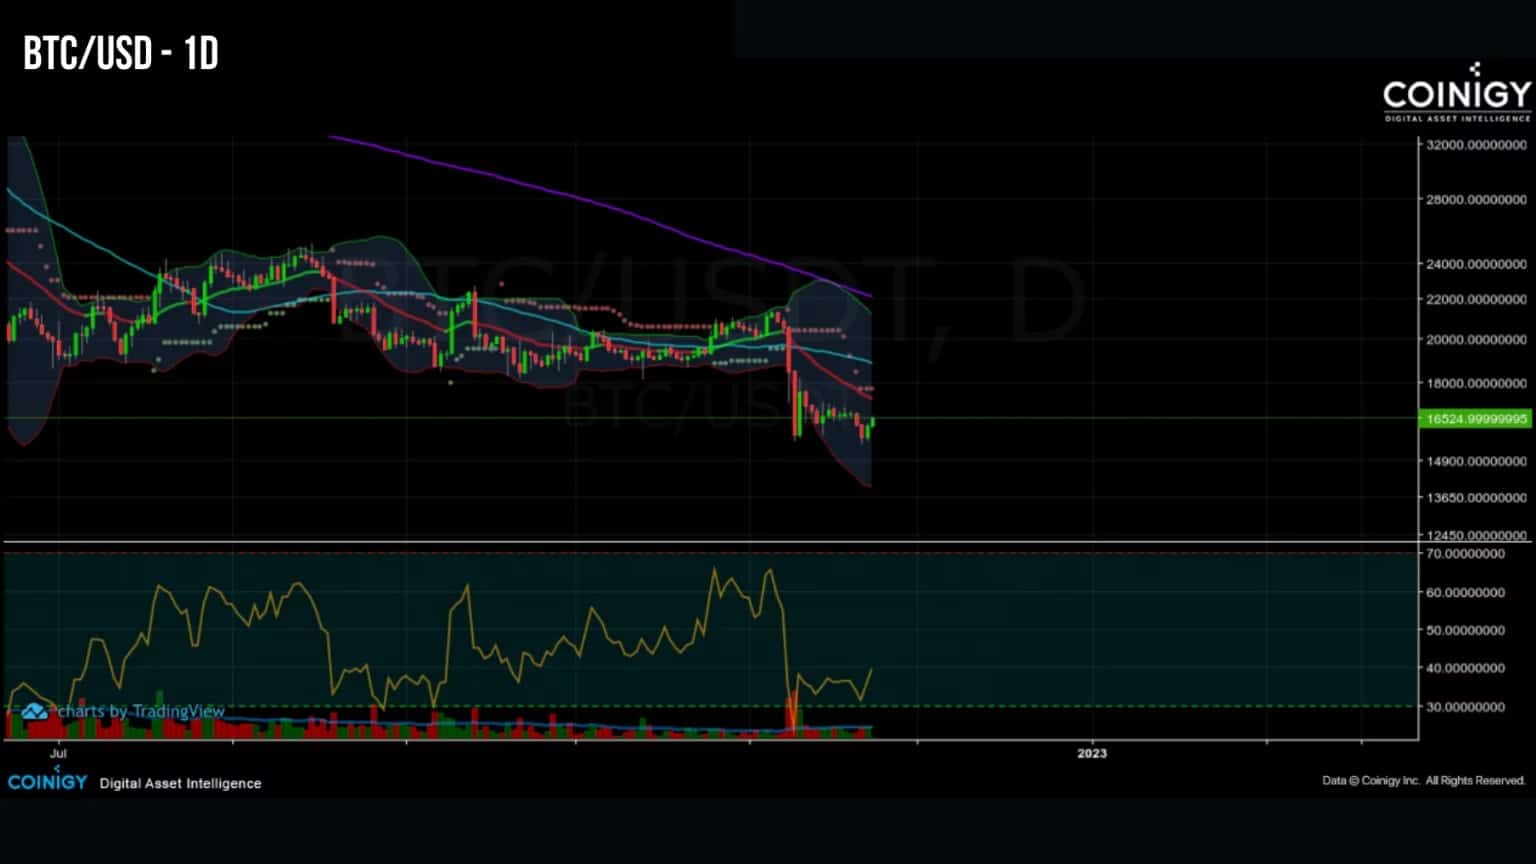
Figure 1: Daily BTC price
In addition, participants’ search for safety has led to a visible exodus of BTC, ETH and stablecoins from exchanges, creating the conditions for a liquidity crisis on several platforms.
This week, we’ll leverage data from Glassnode and French unicorn Kaiko to depict the current state of the cryptocurrency market.
A historic capitulation
With regard to the recent wave of losses made by the entire market, we can be sure that it will be etched in the Bitcoin history books forever, as its magnitude and timing are exemplary.
Looking at the aSOPR, we can detect a second clear rejection of the neutral zone (in red) in early November, invalidating the potential change in the structure of spending profitability, as suggested in the August 19 and November 8 analyses.
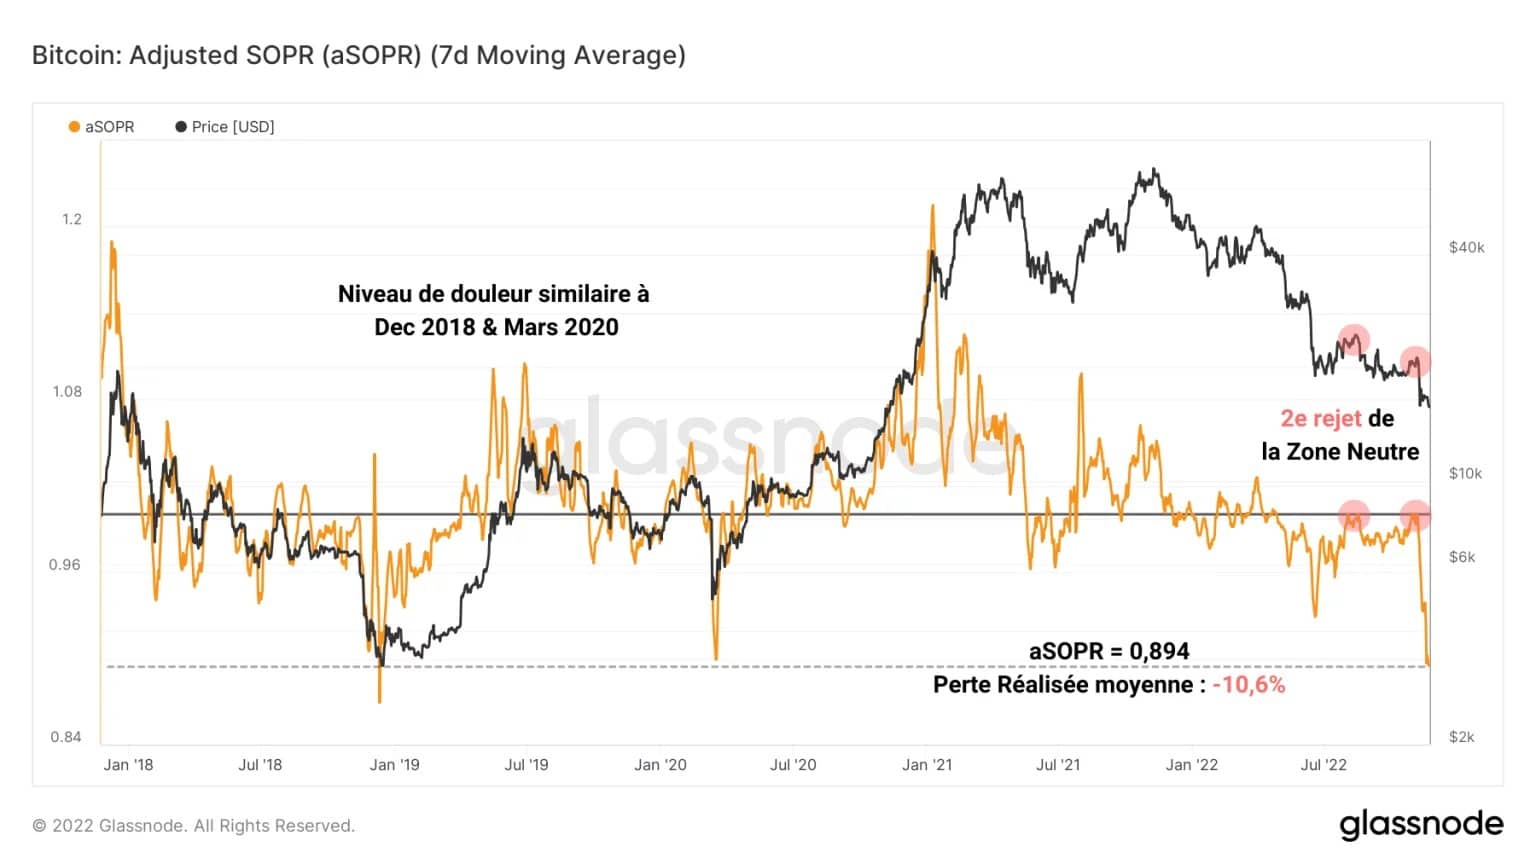
Figure 2: Spending profitability ratio
This rejection of the pivot resulted in a sharp drop in price and then aSOPR, indicating a serious loss-taking by many investor cohorts, similar in magnitude to December 2018 and March 2020.
Currently, the average loss realised by a holder is -10.6%, symbolising a colossal financial pain that rarely shows up. Here is a worthy capitulation, which has obviously released the selling pressure that remained until then.
The break of the $18,000 support on Bitcoin triggered a visible wave of selling, especially among holders who had accumulated the asset between $18,000 and $20,000.
The losses realized exceeded $1 billion per day, which in the end does not seem to be that much compared to other selling phases of the current bear cycle.
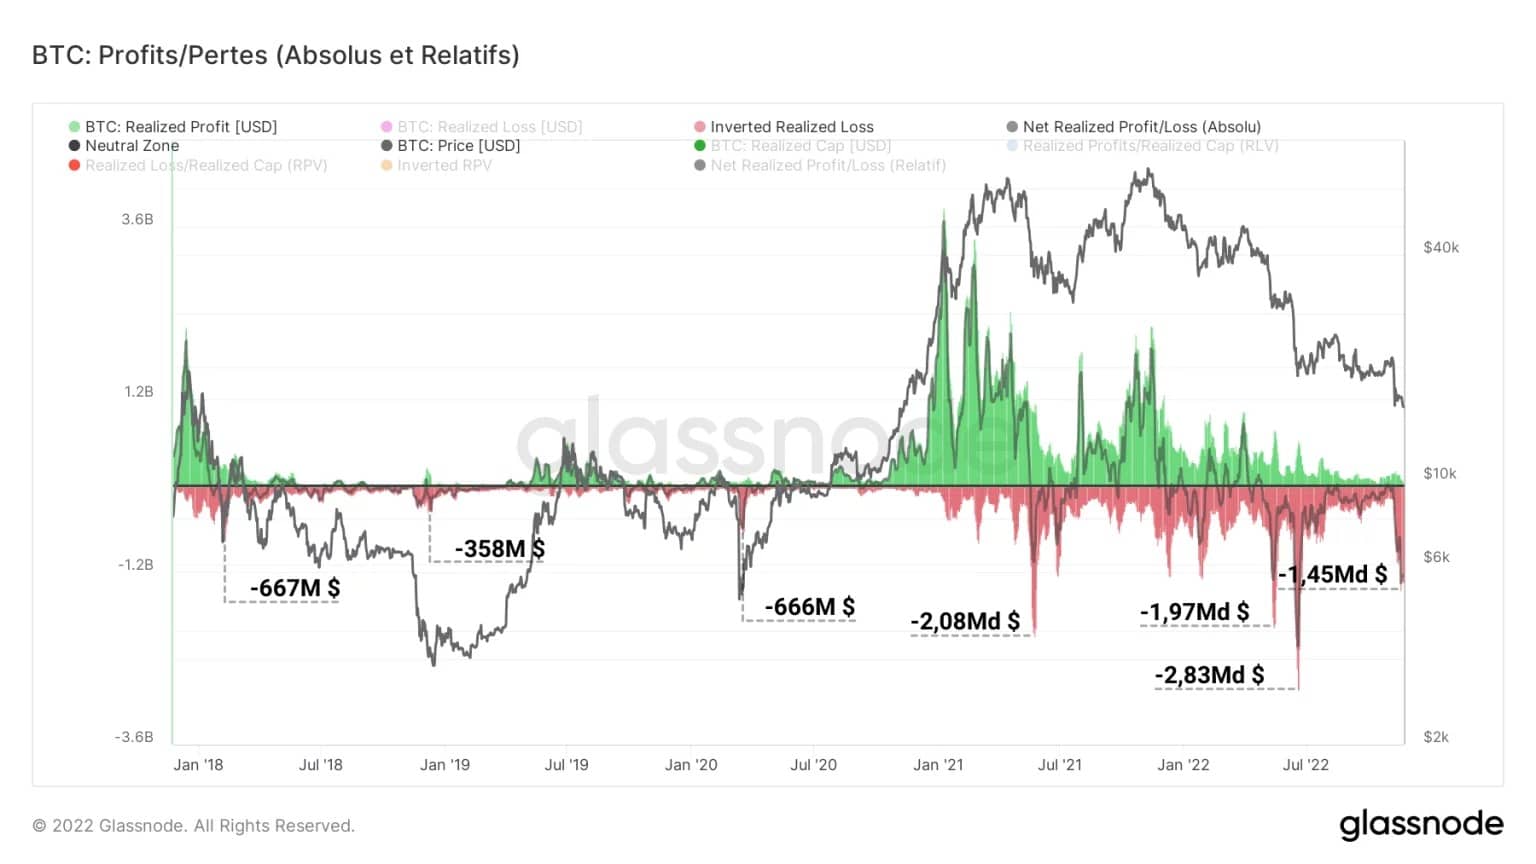
Figure 3: Realised losses
One of the reasons for this low volume of losses is that buyers are exhausted and have less and less to lose as the bear market builds and the price of crypto-currencies drops drastically.
At this point, a majority of investors have their heads under water and while some are still holding out, many participants have already taken the exit door. From a relative point of view, we can also compare the loss taking to previous cycles through the use of realised market capitalisation.
Serving as a proxy for measuring the value invested in the market, realised capitalisation, when factoring in realised losses, gives rise to the Realized Loss to Value (RLV) ratio, which measures the magnitude of sales against the value injected into the system.
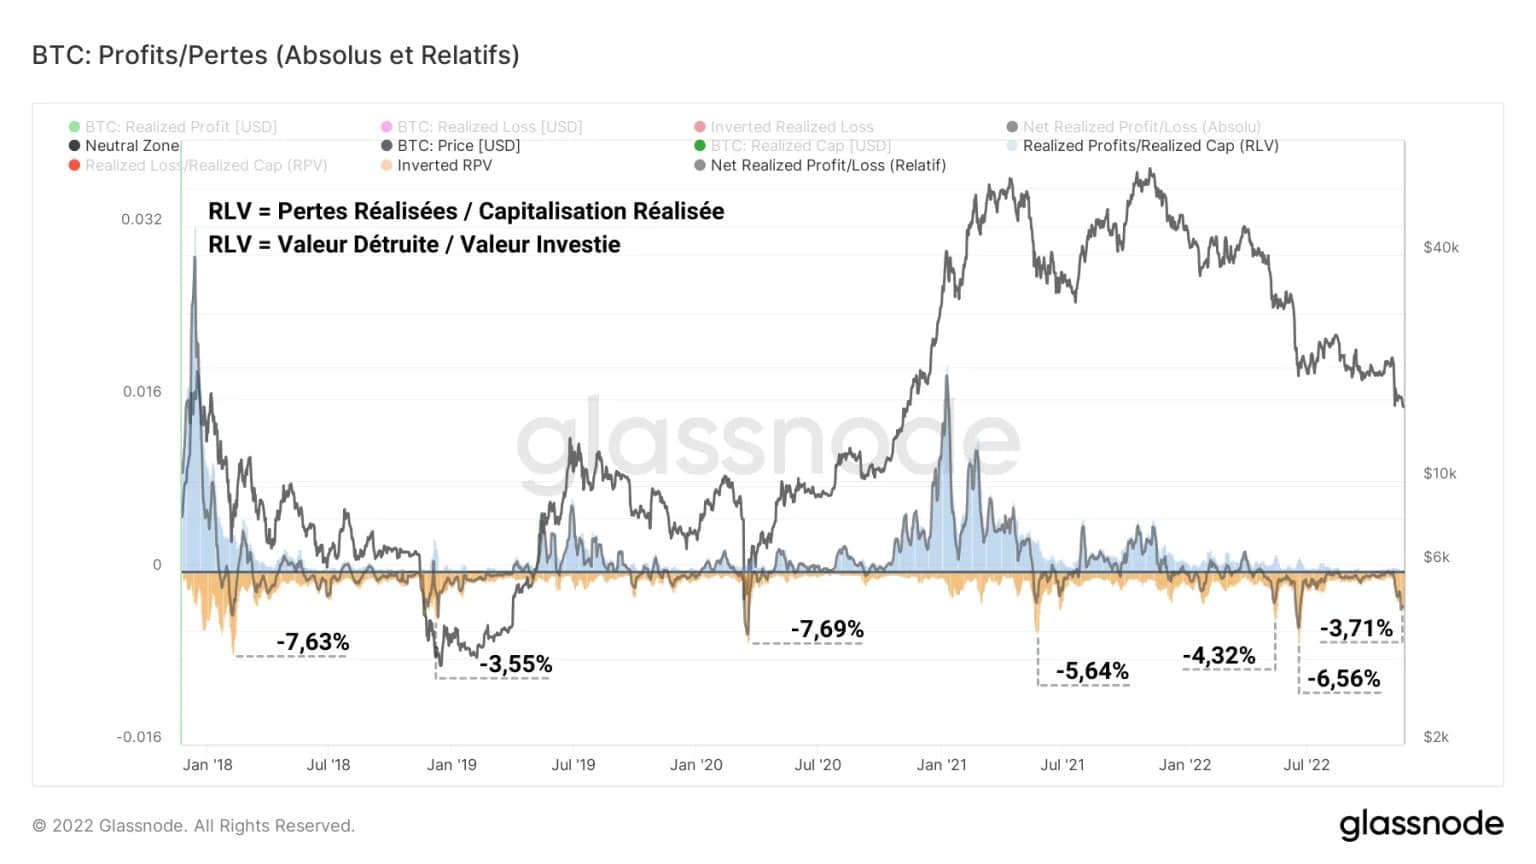
Figure 4: RLV ratio
This indicator is very useful when comparing profits/losses over time as it corresponds to the scale variation of the money supply circulating in the market over market cycles.
For example, it appears that the recent sell-off destroyed almost 3.71% of the value on the network, a figure very close to that recorded in December 2018 (3.55%), indicating that the scale of the value destroyed is reaching a cyclical low.
The exodus from exchanges
In response to FTX-induced distrust and ongoing debt contagion, Bitcoin and broader cryptocurrency holders have made a coordinated move to safety through self-custody.
This paradigm shift, visible on the blockchain, is symptomatic of holders’ desire to regain their sovereignty at the expense of higher returns, the origins of which were sometimes questionable.
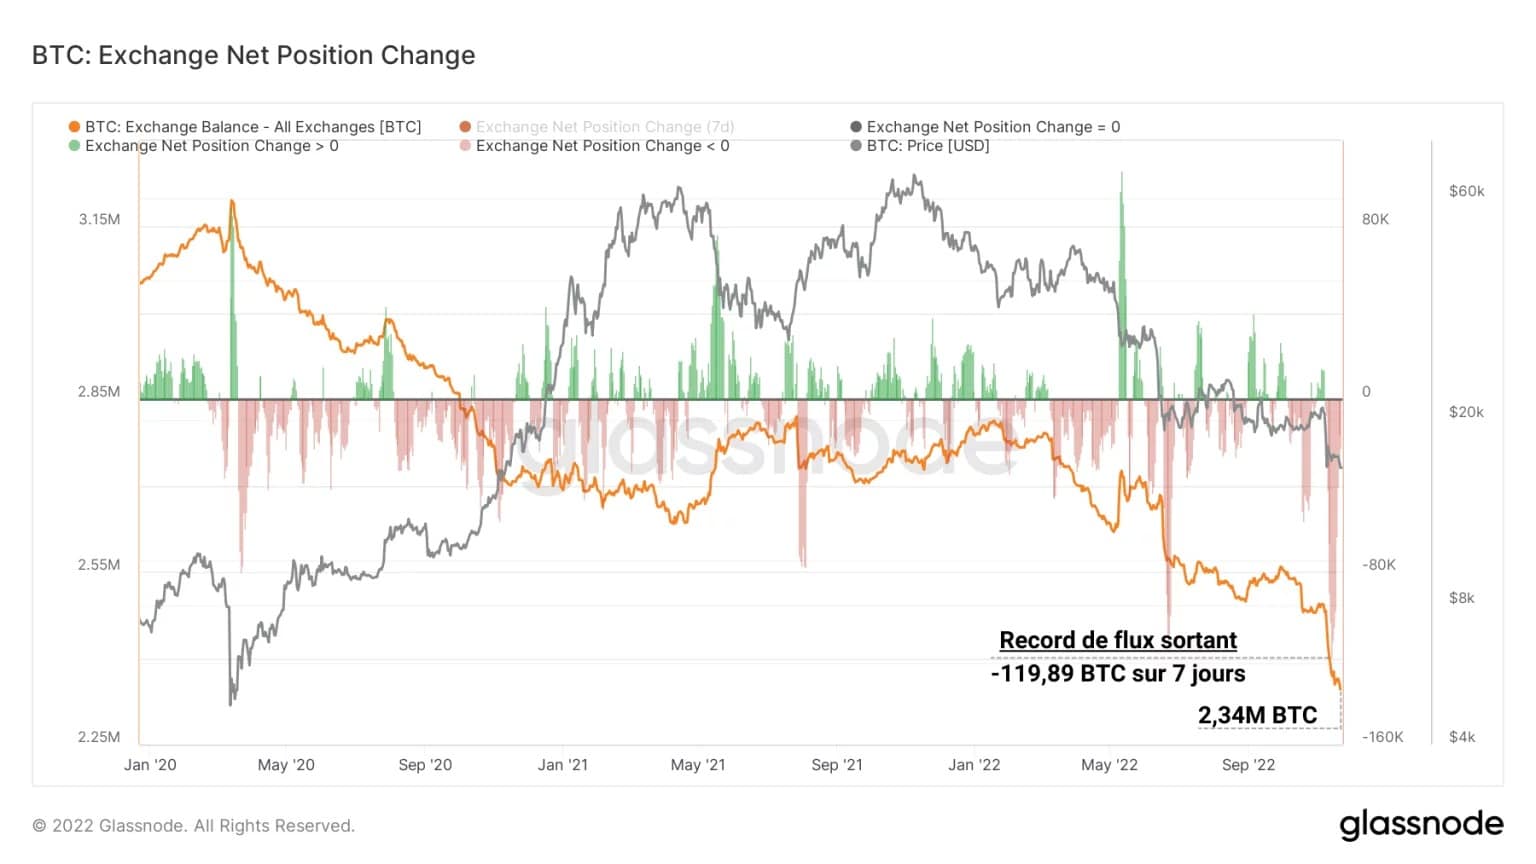
Figure 5: BTC reserves of exchanges
Thus, the market has witnessed the highest flow of BTC out of the exchanges, peaking at nearly 120k BTC withdrawn per day last week.
The ongoing exodus to hardwares and softwares wallets is effective and, although triggered by a very painful event, represents a healthy recovery of power for the ecosystem if the trend continues.
A similar dynamic is identifiable for Ether, which is even steeper, signaling a broadly sustained momentum of withdrawals since the beginning of November.
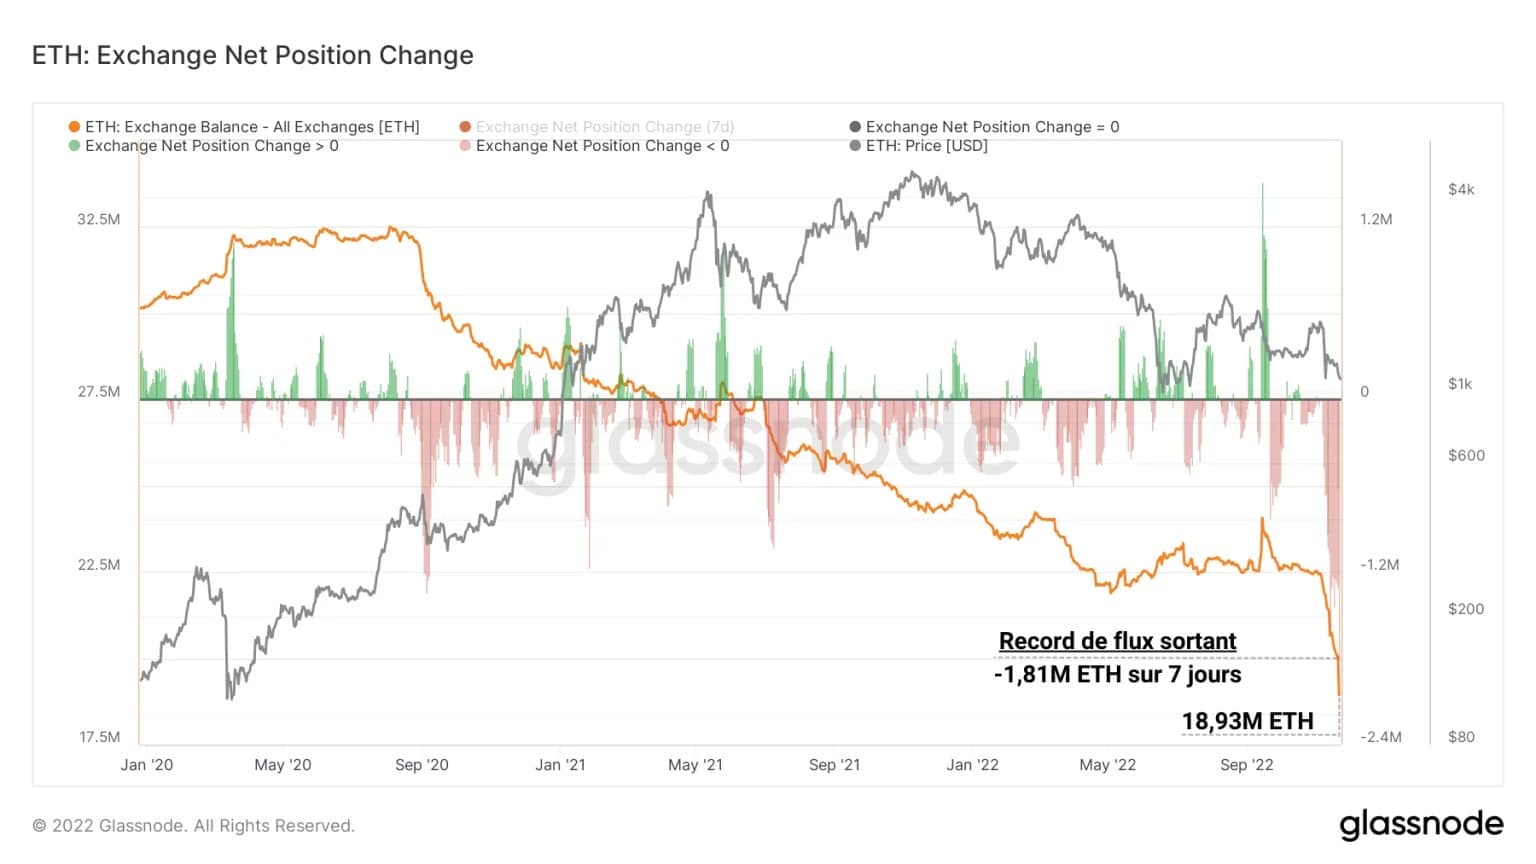
Figure 6: ETH reserves of exchanges
With nearly 1.81 million ETH withdrawn from exchanges last week, outflows were the highest ever recorded in the history of the Ether market.
Finally, the four major stablecoins (USDT, USDC, BUSD and DAI) show a similar trend, a sign that holders and investors now favour self-custody and decentralised finance solutions over centralised service providers, in which trust is eroding.
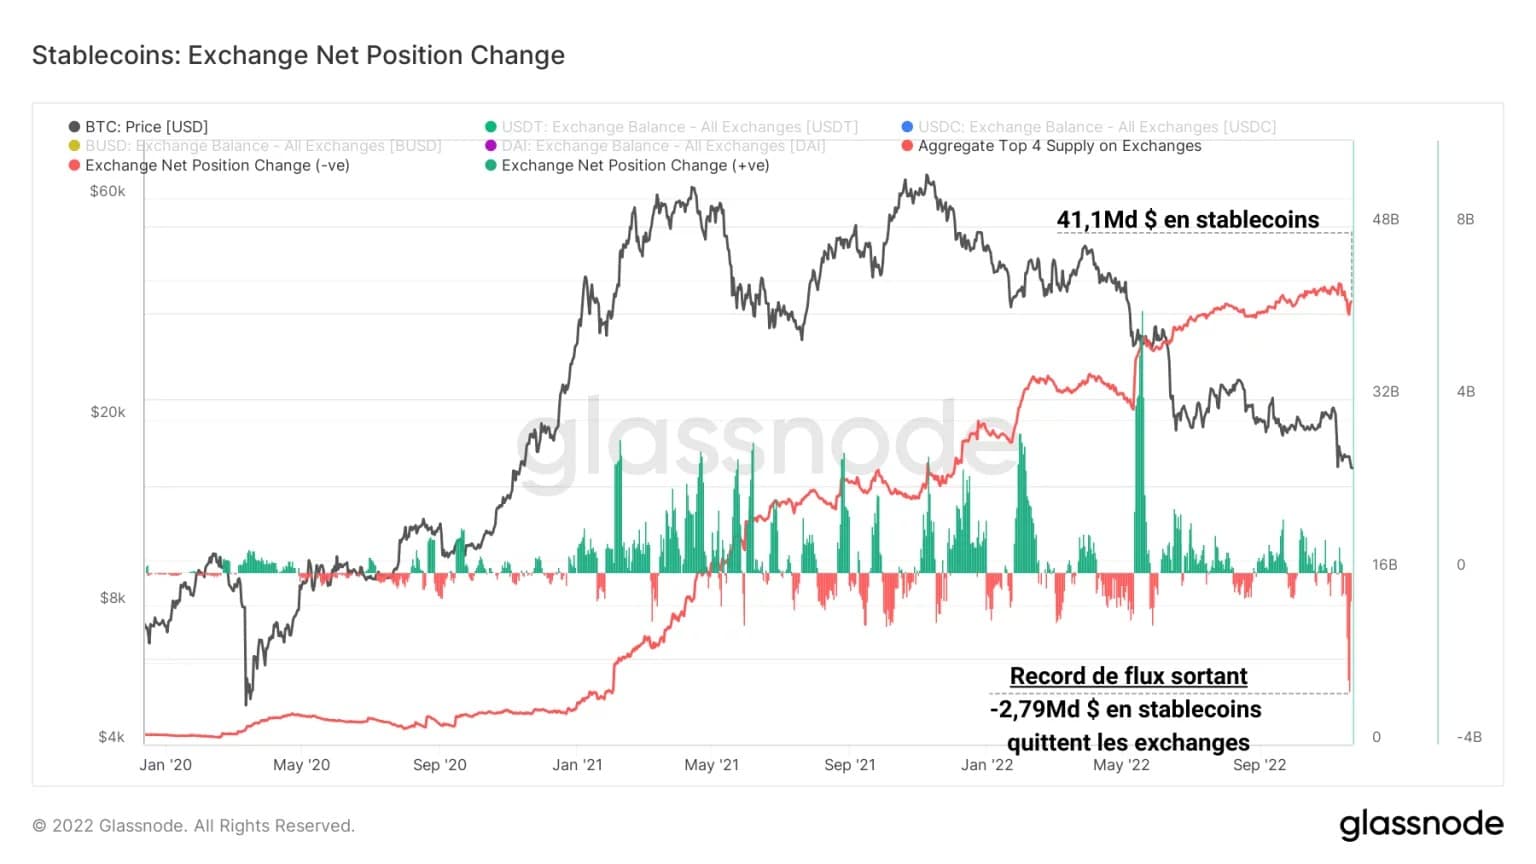
Figure 7: Stablecoin (USDT, USDC, BUSD, DAI) reserves of exchanges
A record flow of stablecoins out of the exchanges was recorded over the past week, with $2.79 billion in volume, marking by far the largest withdrawal phase in the market’s history.
Exchange liquidity falls
With all the prime collateral (BTC, ETH and stablecoins) leaving the exchanges and flowing into the peer-to-peer economy, a liquidity crisis is underway across the centralised exchanges, impacting the fluidity of trading and market making across the industry.
Indeed, data from French firm Kaiko indicates that the overall depth of the BTC-USDT pair has seen a notable decline since the collapse of the FTX platform and Alameda Research.
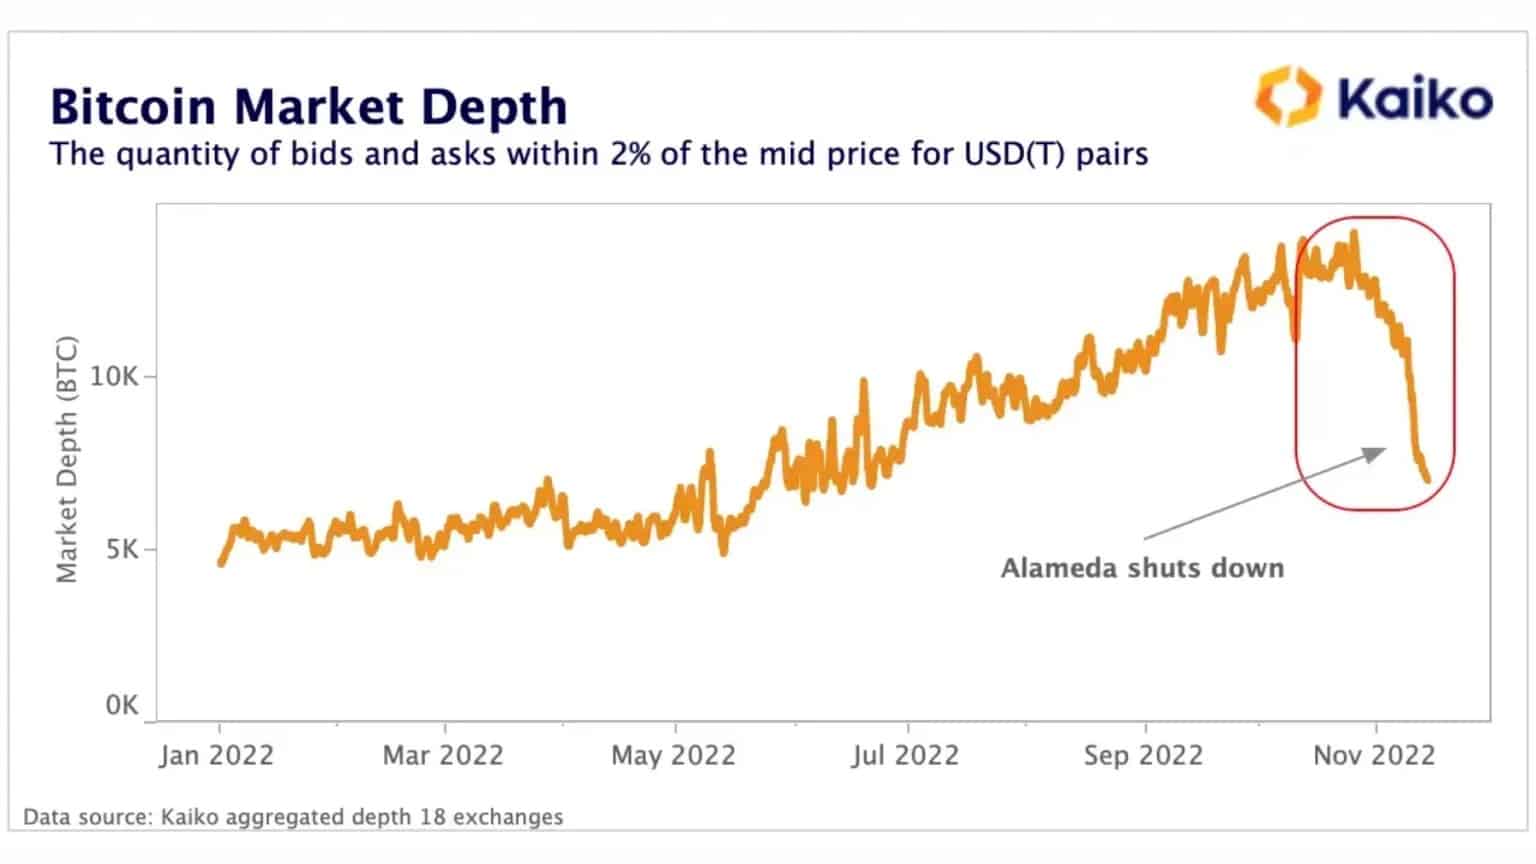
Figure 8: BTC-USDT pair market depth
This means that for a given spot price, the amount of buy/sell orders at +/- 2% of the average price has decreased considerably, creating friction making it more difficult to settle trades.
This dynamic does not seem to be an epiphenomenon but rather a response by all marketplaces to the drop in liquidity necessary for the proper functioning of financial operations:
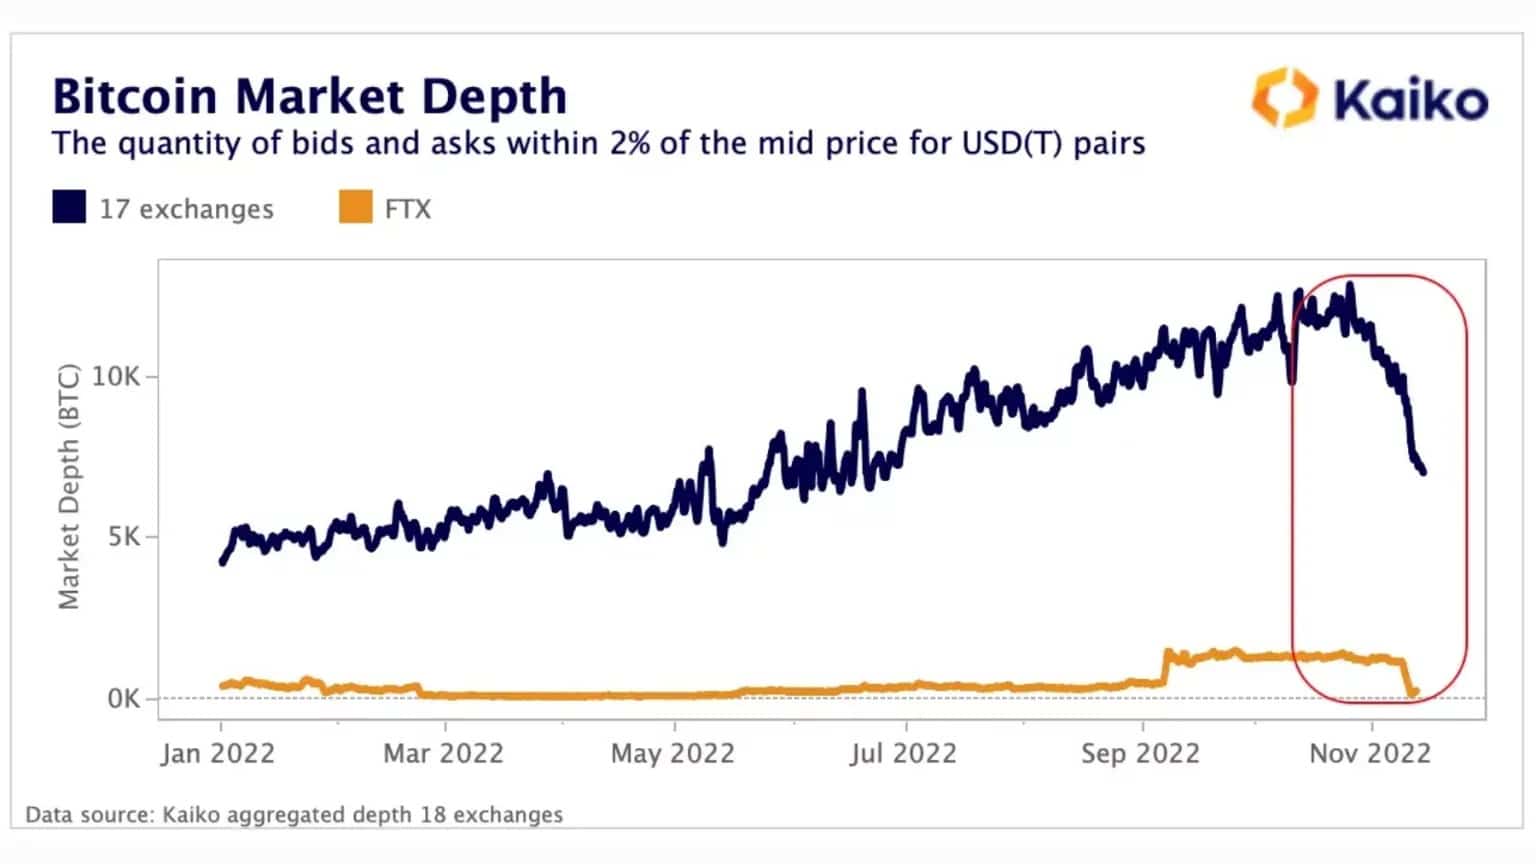
Figure 9: Market depth of BTC-USDT pairs for different exchanges
Finally, it seems that the state of the ether (ETH) market has also been deeply impacted by the bankruptcy of Alameda Research, which was an important liquidity provider for many decentralised protocols.
Again, record withdrawals in recent weeks, as well as the difficulty faced by some market makers such as Wintermute, Amber Group and Genesis, have had the effect of reducing market liquidity, potentially temporarily, but palpably.
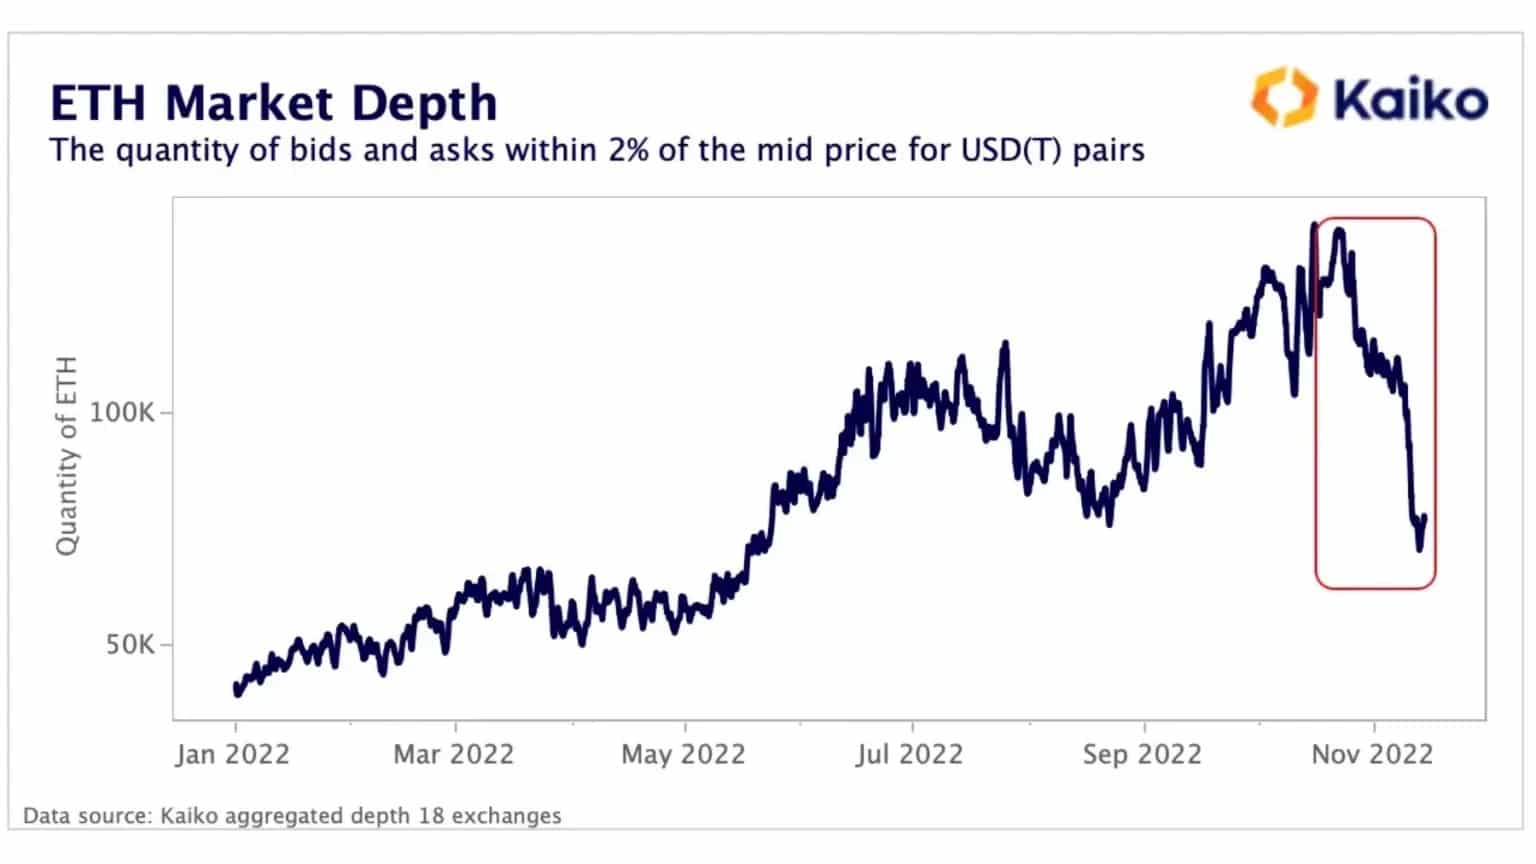
Figure 10: ETH-USDT pairs market depth
The after-effects of the FTX collapse are just beginning to be felt and the stability of some of the structures that were considered unshakeable show how young and developing the ecosystem still is
Summary of this on-chain analysis
In sum, this week’s data indicates that a proper capitulation has taken place following FTX’s fall, causing a multi-billion dollar loss realisation, similar in magnitude to December 2019 in terms of relative value destroyed.
In response to the distrust caused by FTX and the ongoing debt contagion, holders of bitcoins, ethers and stablecoins opted for safety through self-custody and withdrew their capital from centralised exchanges in massive numbers.
This exodus, coupled with the difficulties faced by some market makers, has resulted in a liquidity crisis across the BTC and ETH markets, which are showing tentative signs of recovery.