
Short-term investors are mostly involved in the recent price action and have been dictating the trend since March. Although they remain confident in the prevailing bullish phase, they appear to be exercising caution and slowing their spending. On-chain activity of the situation
Bitcoin attempts a bullish impulse
The price of Bitcoin (BTC) continues to hover below the psychological resistance of $30,000. Following the failure of the bearish break of the $26,000 level, the BTC on Sunday made a bullish impulse bringing it back just below $28,000.
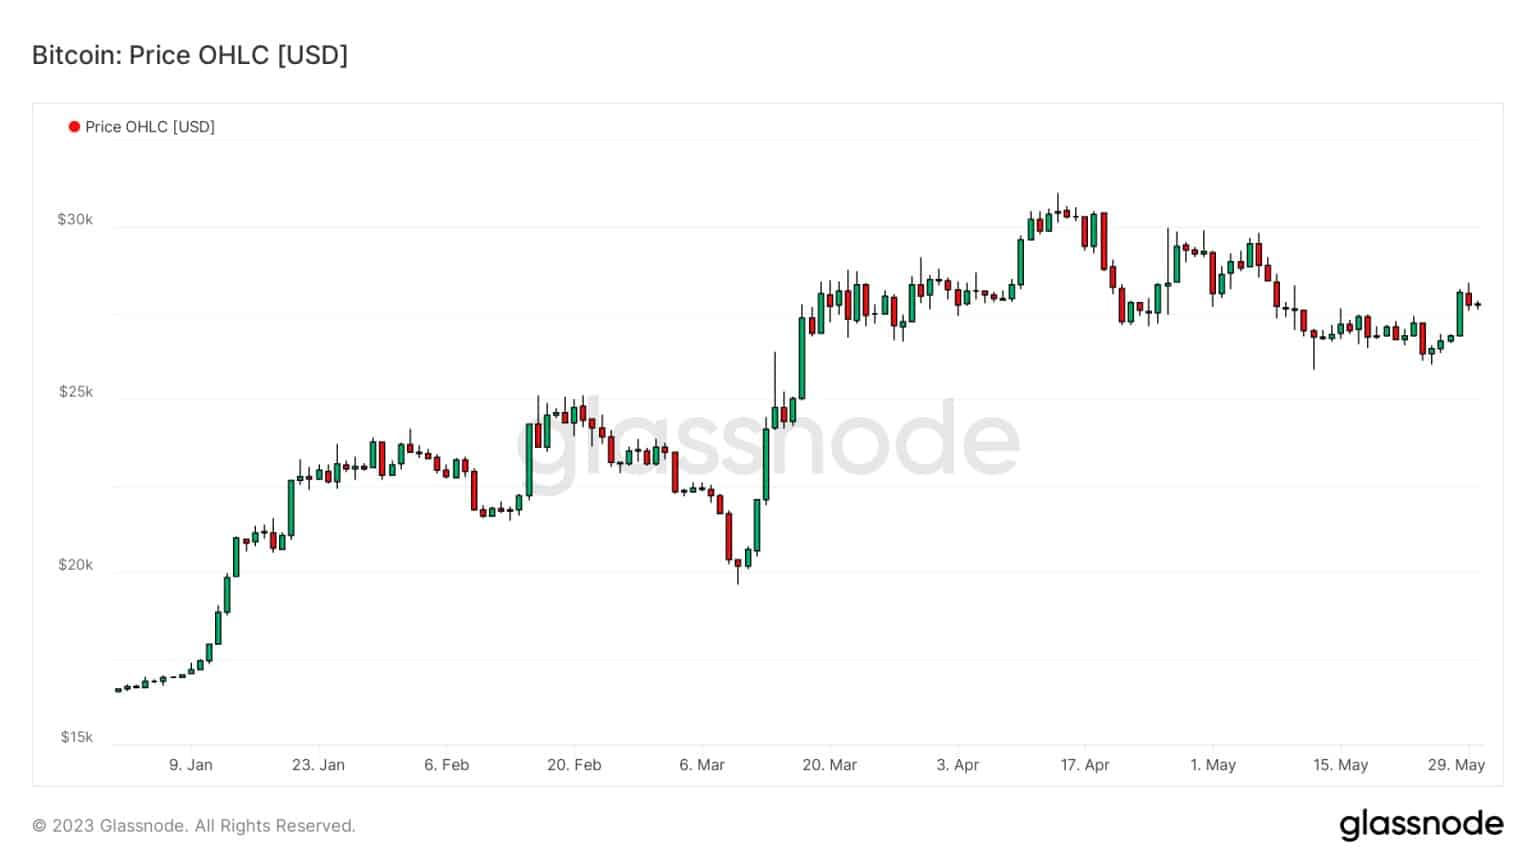
Figure 1: BTC daily price
While our last analyses focused on macroeconomic aspects (market liquidity) and technical aspects (listings and BRC-20), today we are returning to the behaviour of BTC market participants.
More specifically, we will be looking at the cohort of short-term investors, the majority of whom were involved in the recent price action. Because of their sensitivity, they represent the group of participants most likely to create a major short-term movement.
By studying latent profitability, realised profitability and on-chain activity linked to this group, we will today illustrate how short-term investors have been dictating the trend since March, and how they are currently positioning themselves.
Latent profitability of STH
For once, the cost basis for short-term investors, representing the average purchase price of BTC less than 155 days old, has once again reacted to the spot price of BTC.
During bullish trends, this level, which is currently just below $26,000 (in red), tends to act as a support.
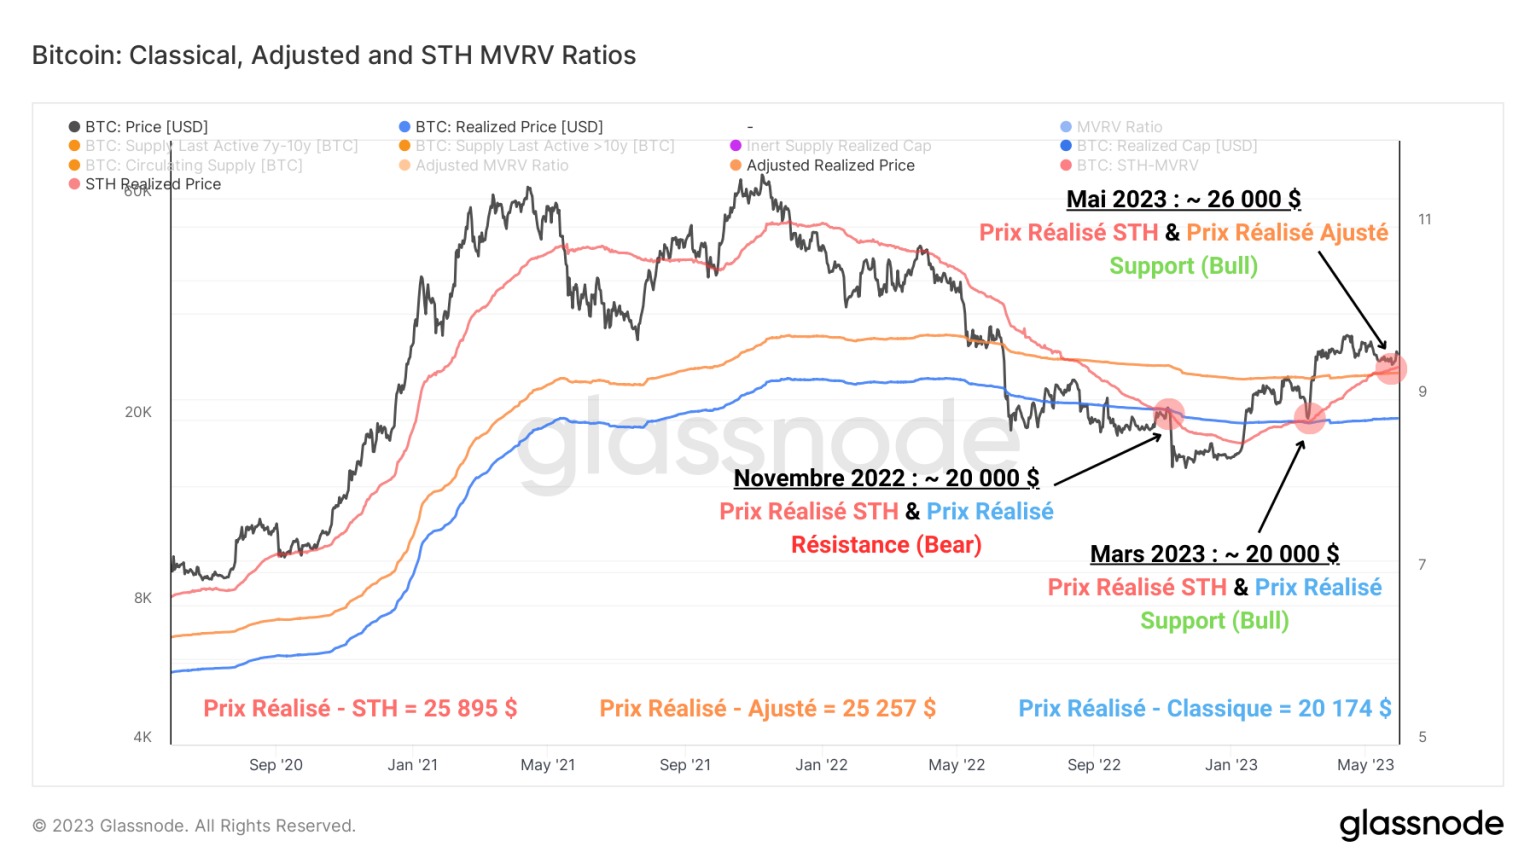
Figure 2: Classic Realised Price, Adjusted Realised Price, STH Realised Price
This is the second time in 2023 that the cost base of short-term investors has supported the BTC price during a correction phase of more than 10%.
Historically, this structure favours a rebound in the BTC market, as short-term holders slow down their spending before generating buying pressure. Usually, they take advantage of the correction to double down on their average purchase price.
This thesis is confirmed by studying the distribution of the purchase prices of BTC less than 155 days old (in red), which can be separated into two groups:
- The STH offer in profit, split between the $15,800 and $27,800, represents around 1.6 million BTC, or almost 60% of the BTC held by the short-term investor cohort;
- The STH loss-making offer, split between the $30,000 and $28,000, represents nearly one million BTC.
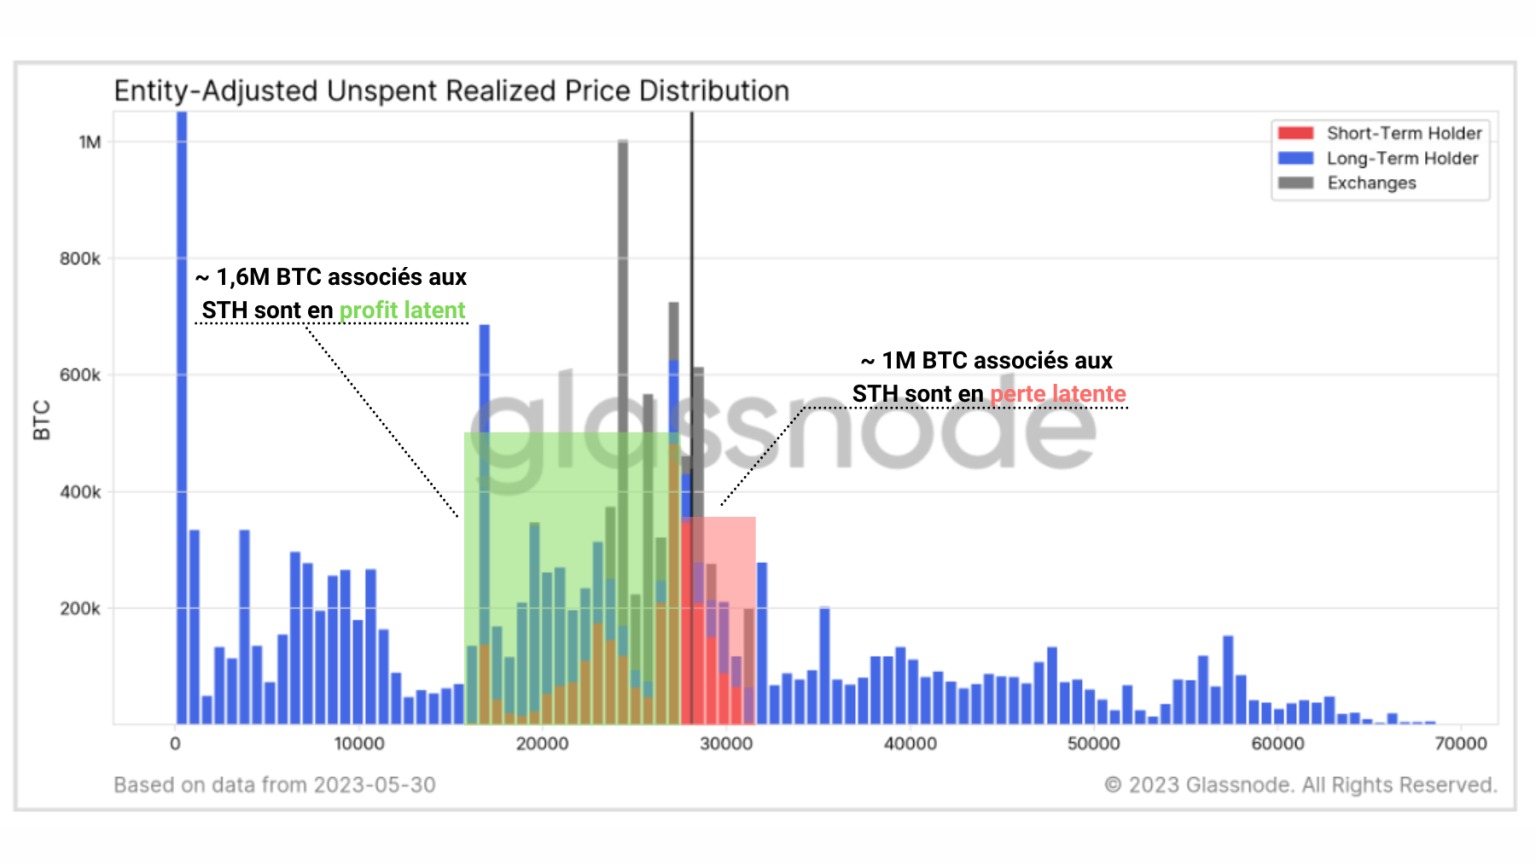
Figure 3: Distribution of Realised Prices (STH/LTH)
Overall, STH supply is in profit, which favours a bullish bias. We can also note that a volume equivalent to 500,000 BTC is held with a base cost of around $26,000.
This indicates that a significant accumulation of BTC has recently taken place at this price level, and confirms the realised STH price data mentioned earlier. This level is indeed the current bull/bear pivot point and determines the bias that will give rise to the short-term trend.
This behaviour can also be seen by measuring the supply of BTC in profit/loss held by short-term investors. More specifically, the percentage of STH’s supply in profit offers an excellent proxy for the degree of short-term overbought/oversold market behaviour.
- When more than 95% of STH supply is in profit, this creates an incentive to take profits, generating local selling pressure capable of correcting the market;
- When more than 95% of STH supply is at a loss, this creates an incentive to take a loss, generating a buying opportunity for HODLers and long-term investors.
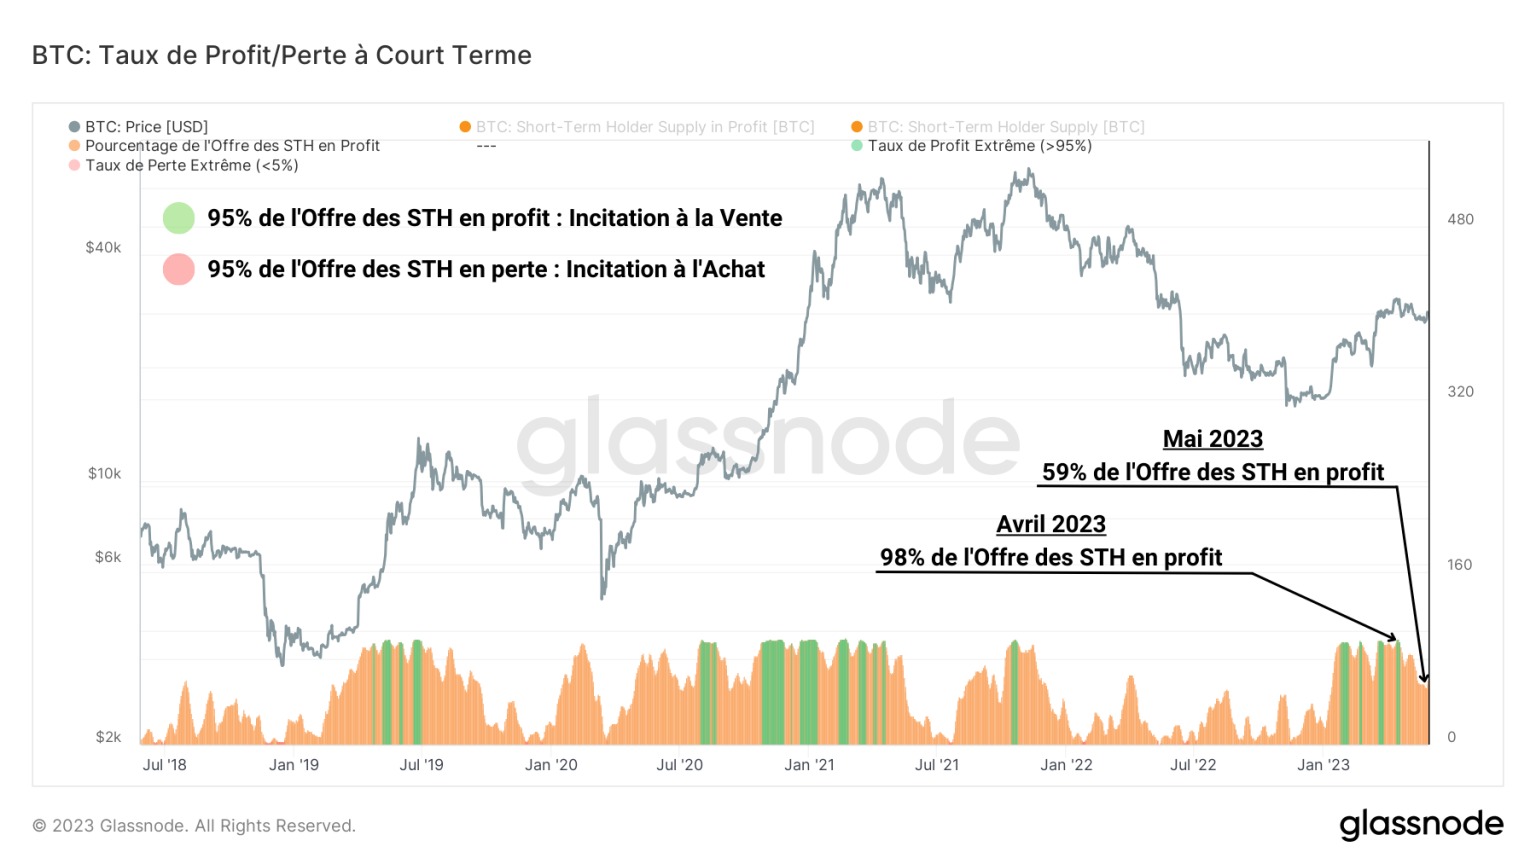
Figure 4: Percentage of STH supply in profit
During the month of April, nearly 98% of STH supply was in profit. Almost the entire group was then in a position to sell at a profit.
Today, less than 60% of the STH offer is in profit, reflecting both the profit taken in March-April and the loss of profitability of buyers at the local $30,000 peak. The supply in profit was thus transferred to new entrants, who found themselves trapped at the top of the range and participated in the distribution (loss-taking) in May.
Realised profitability of STH
These observations are confirmed by recent fluctuations in the Short-Term Expenditure Profitability Ratio (STH-SOPR), which measures the degree of profit/loss realised by short-term investors. This indicator provides an insight into decision-making based on the state of latent STH profitability and is an excellent proxy for short-term market sentiment.
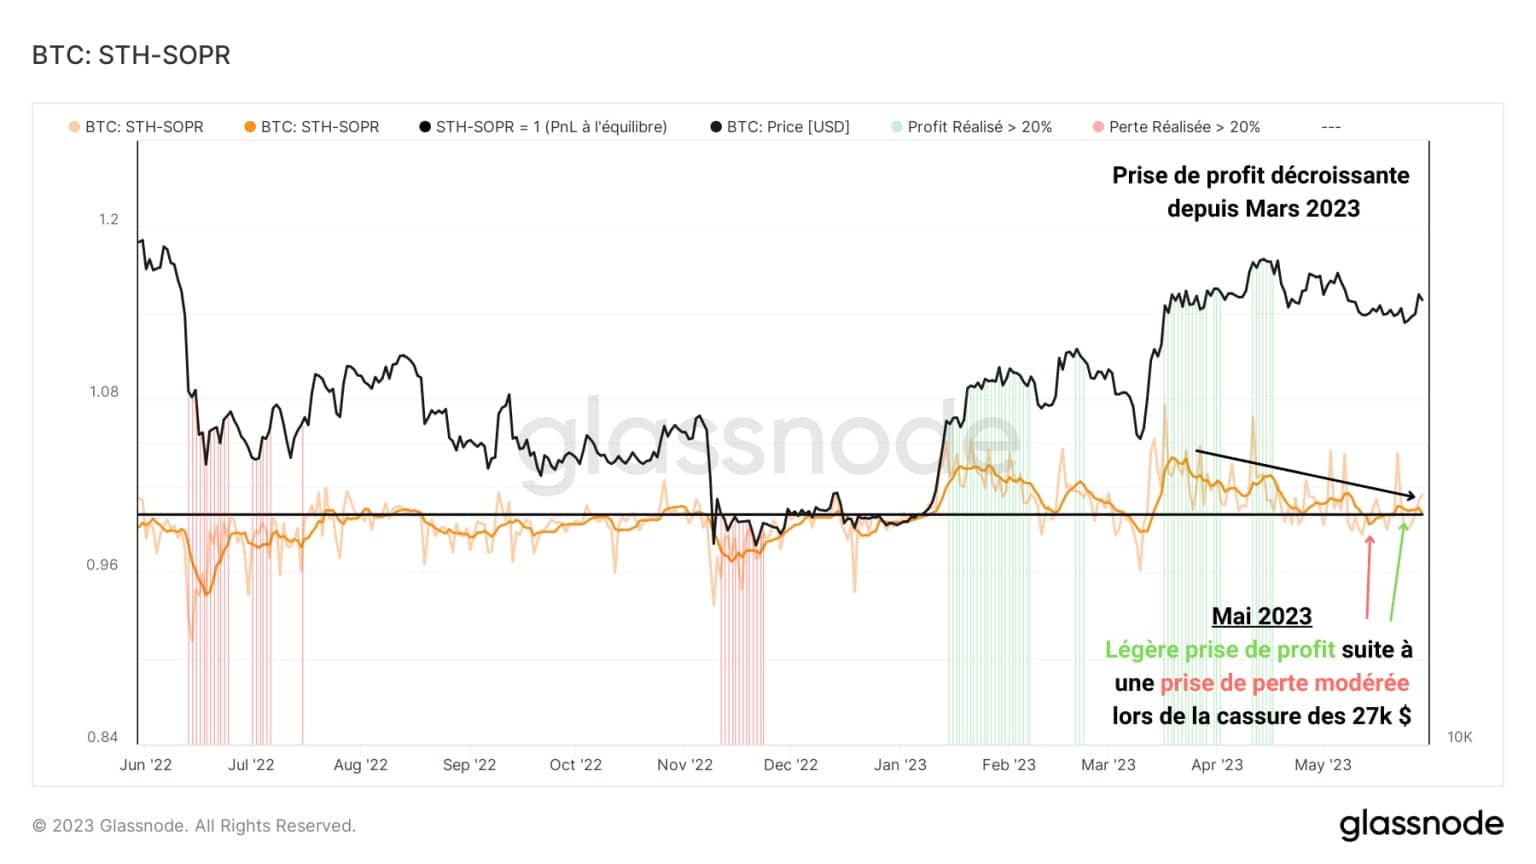
Figure 5: STH-SOPR
We can see that, following a profit of over +20% in March (in green) during March and April, the profits made by this group gradually fell, until they turned into a loss in May.
At present, spending behaviour is relatively neutral and tending towards slight profit-taking. The fact that the neutral zone (STH-SOPR = 1) has provided support for the price trend at the $26,000 level is also very constructive.
On-chain STH activity
Now that we have been able to understand the evolution of the financial situation of short-term investors and the resulting behaviour, we can analyse the on-chain activity of this group to check whether our observations are consistent with the on-chain movements of this group.
By measuring the daily transfer volume from STH portfolios, a clear observation emerges: a decline in the volumes associated with these entities is indeed underway.
This means that short holders have preferred to slow down their loss-taking to the level of their cost basis, suggesting a healthy anticipation of the risk of a deeper correction.
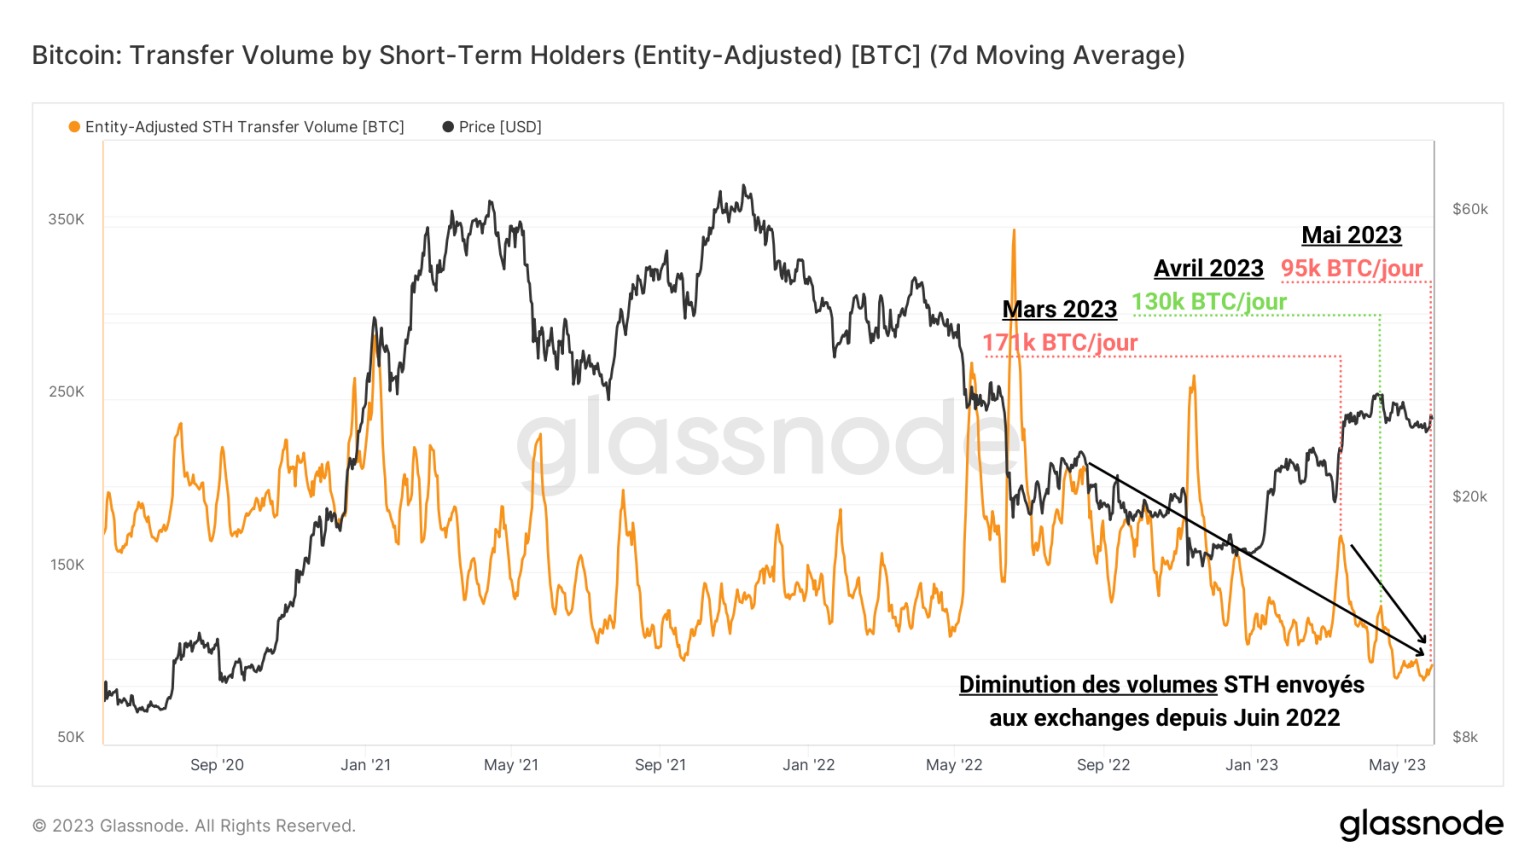
Figure 6: Transfer volume associated with STH
What’s more, this dynamic does not date exclusively from the May-April 202 profit-taking period, but is part of a larger-scale decline in activity dating back to June 2022. Whereas nearly 200,000 BTC associated with STH were circulating on the network nearly a year ago, the current volume is halved, with just 95,000 BTC exchanged each day.
This multi-year low tells us that short-term investors are limiting their spending despite 2023’s performance, and are waiting for higher prices before committing to the market again.
Summary of this on-chain analysis of BTC
This week’s data shows that the BTC market trend has been greatly influenced by the behaviour of short-term investors (STH) since March.
Data on the latent profitability of this group indicates that STHs retain a small latent profit of around 8%, which favours a bullish bias. The USD 26,000 level, coinciding with the cost base of the average STH, symbolises the short-term bull/bear pivot point.
A study of profitability shows that the profit-taking that took place between March and April enabled STHs to generate profits of over 20%. This transfer of capital to buyers at the $30,000 level then led to a correction in BTC, a reduction in profit-taking and even a slight loss-taking below $27,000.
Currently, the on-chain activity associated with short-term investors suggests that they remain confident in the prevailing uptrend. However, they appear to be exercising caution and slowing their spending as they await confirmation of a resumption of the uptrend.