
As the macroeconomic, geopolitical and energy components of our societies deteriorate, the underlying dynamics influencing the traditional and cryptocurrency markets are now providing us with an unprecedented context that is challenging the models established by many analysts. On-chain analysis of the situation
BTC stumbles over $30,000
The price of Bitcoin (BTC) is hovering in a price range of $28,000 to $30,000. This stabilization of the market, a lull whose outcome remains uncertain, gives hope to some participants who now claim that the market has reached its low point.
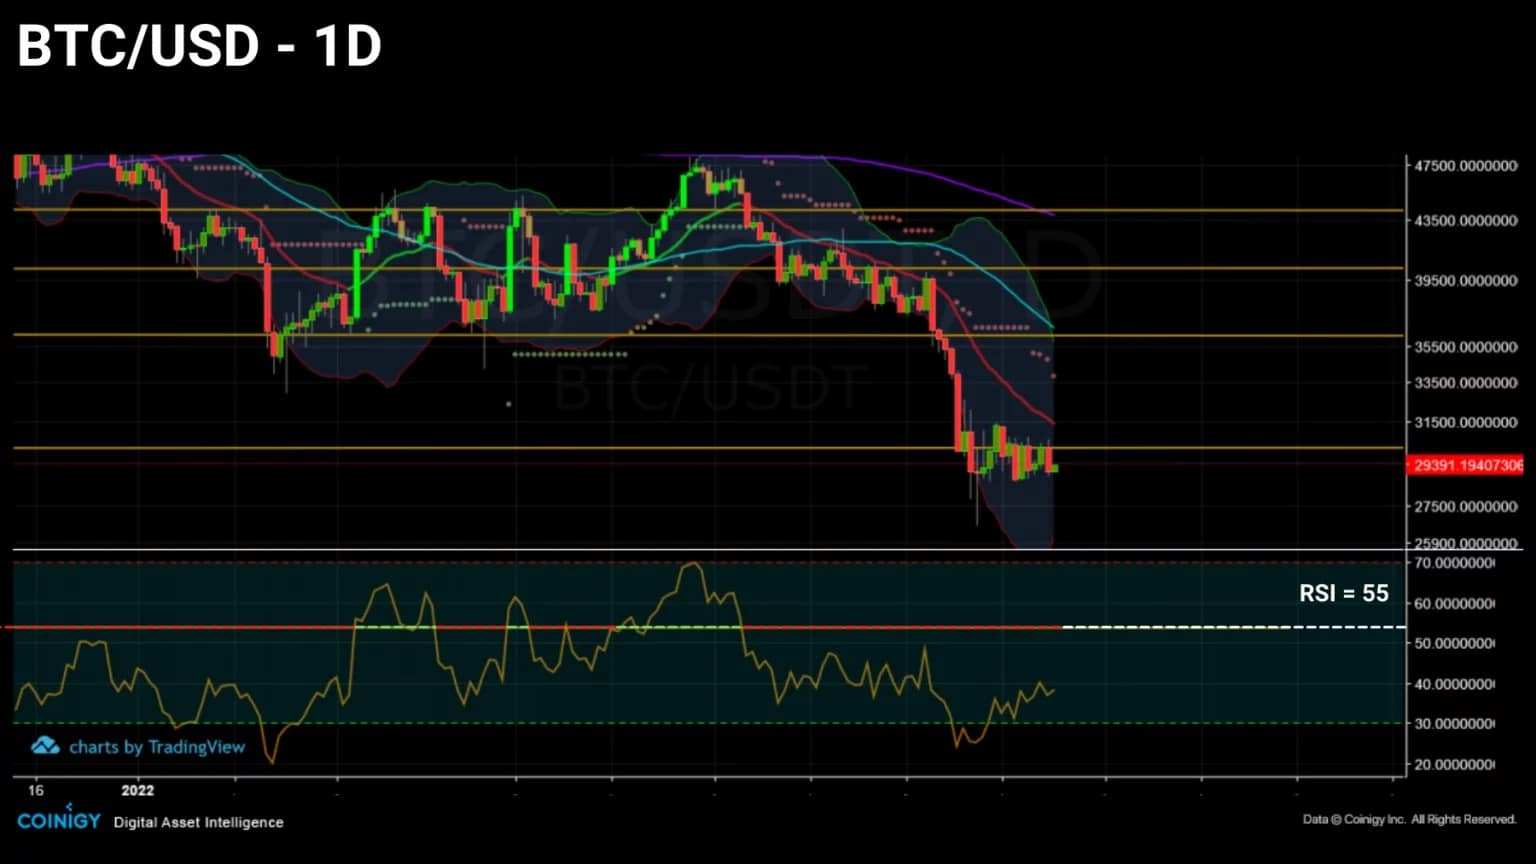
Figure 1: Daily Bitcoin (BTC) price
But nothing is less certain. Indeed, since its genesis, Bitcoin (BTC) has evolved in an environment of quantitative easing (QE) from expansionary monetary policies and benefits from massive capital inflows from the traditional financial ecosystem.
This trend now appears to be reversing as Western central banks adopt a quantitative tightening (QT) strategy, raising policy rates to contain self-induced inflation.
As the macroeconomic, geopolitical and energy components of our societies deteriorate, the underlying dynamics influencing both traditional and cryptocurrency markets are now providing us with an unprecedented backdrop expanding the realm of possibilities to extremes.
It is likely that the models built by many market analysts over the past few years will be invalidated in the coming months, as we enter uncharted territory in terms of the global economic and financial environment.
This week we will look at a broad spectrum of metrics to gain perspective on the state of the market and the network. To do this we will look at:
- The financial situation of long-term investors (LTH);
- The reconciliation of the spot price and the realised market price;
- Investor behaviour in different geographical areas;
Long-term investors on the brink
Complementing observations made over the past two weeks, metrics for long-term investors (LTHs) describe calm behaviour, although a significant portion of the cohort is approaching a critical tipping point.
Entities holding BTC for more than 155 days are statistically more prone to HODLing than their short-term counterparts (STH) and have a high insensitivity to price volatility.
The mass of bitcoins held by this cohort now stands at 13.47 million BTC, or 70.74% of the outstanding supply, showing a visible decline in their holdings of 103,000 BTC since May 8.
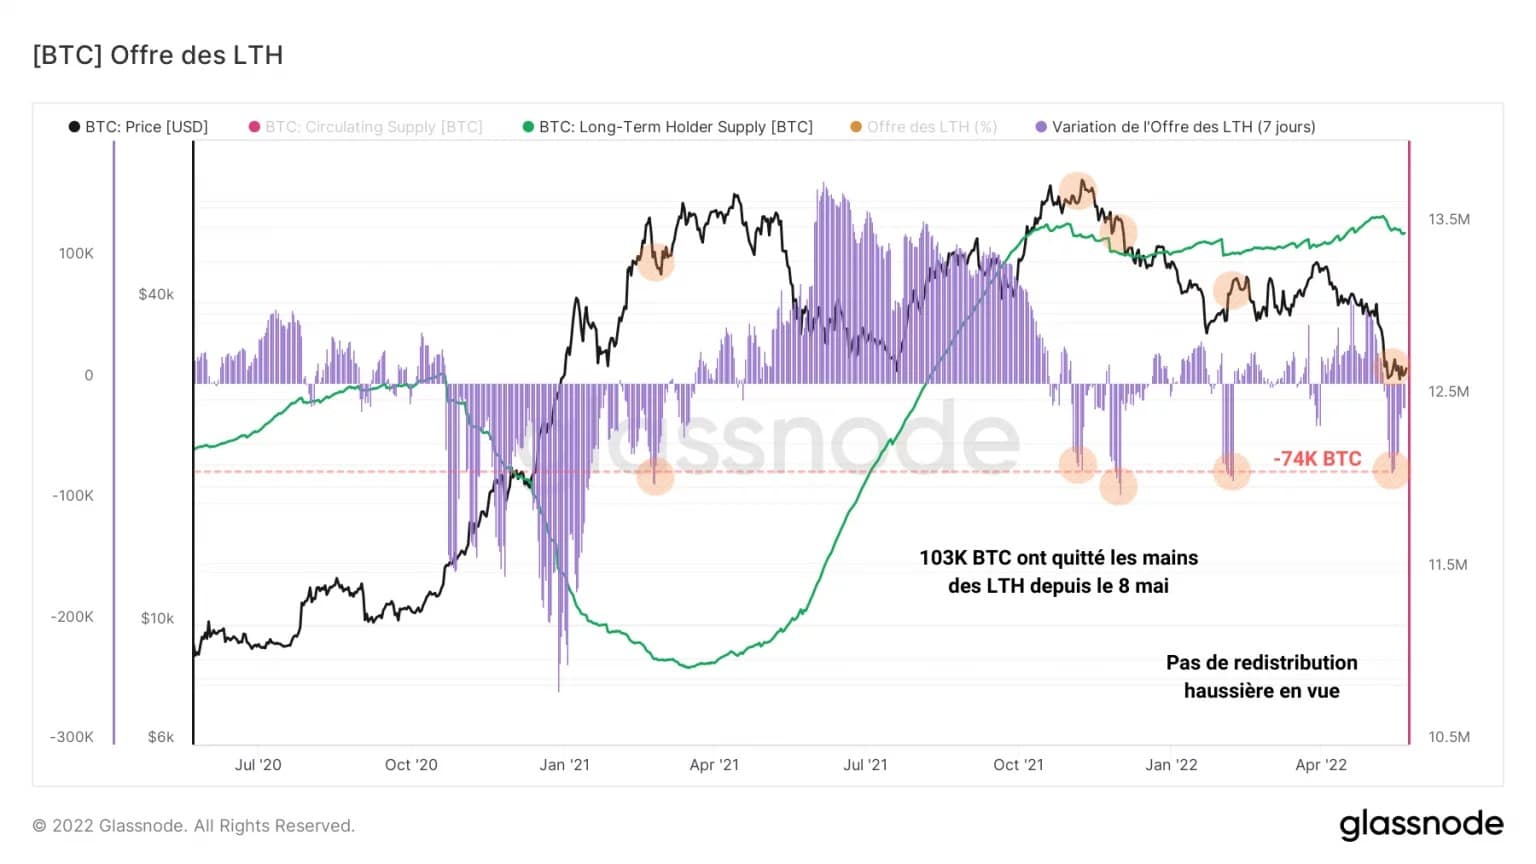
Figure 2: BTC supply held by long-term investors
This drop in LTH supply is the result of a moderate selling wave similar in magnitude to the following events (in orange):
- 24 February 2021: Early exit from the market
- 03 November 2021: Profit taking at ATH
- 25 November 2021: Late market exit
- February 1, 2022: Market exit on rebound
Although the last two weeks have been very trying, this stress test will not have been enough to move the cohort as a whole, even though some participants who have been accumulating since November have experienced a net decline in the profitability of their holdings.
Indeed, more than 4 million bitcoins are held at a loss by LTHs, representing almost a third (29.7%) of their holdings.
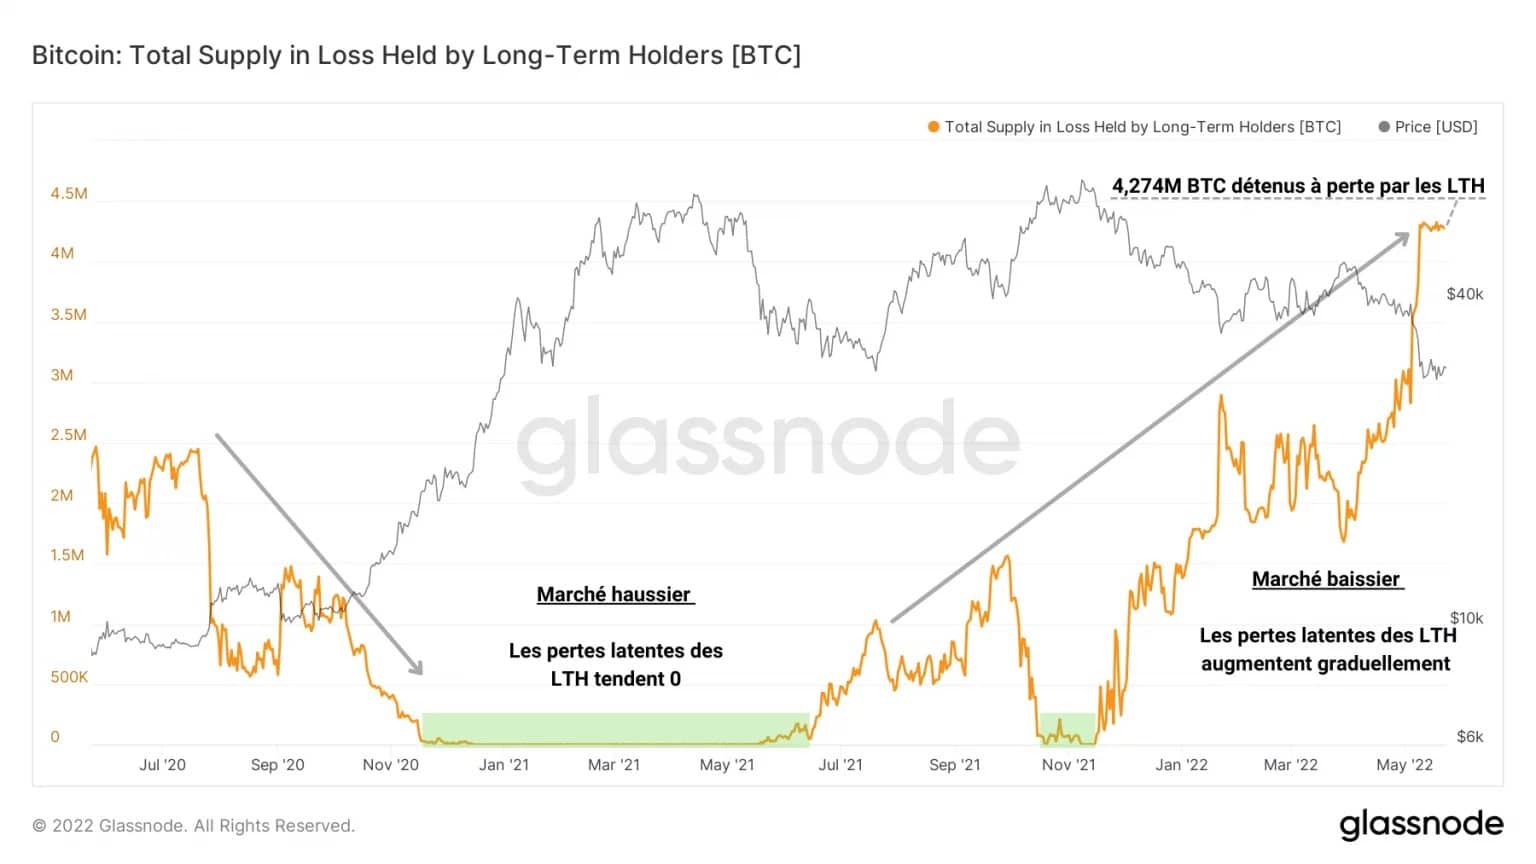
Figure 3: BTC supply held at a loss by long-term investors
This trend is typical of bear markets, in which long-term investors who have accumulated during sharp corrections experience increasing latent losses, sometimes leading them to part with some of their bitcoins to reduce their risk exposure.
Here we can see a gradual increase in the supply of LTHs in loss status since November 2021, a sign that a significant portion of the cohort has bought into the correction and is now in strong loss status.
The market is approaching its overall cost base
Let’s continue this study by pointing out a salient fact: the spot price of Bitcoin is getting closer and closer to its realized price and signals that a generational buying opportunity is on the horizon.
The realised price of BTC (in green) is obtained by dividing the realised capitalisation by the total number of coins in circulation and corresponds to the price of BTC at the time of creation of a UTXO.
In short, it is the price at which all UTXOs were last spent. It is the building block of many on-chain indicators and represents the overall cost base of the market.
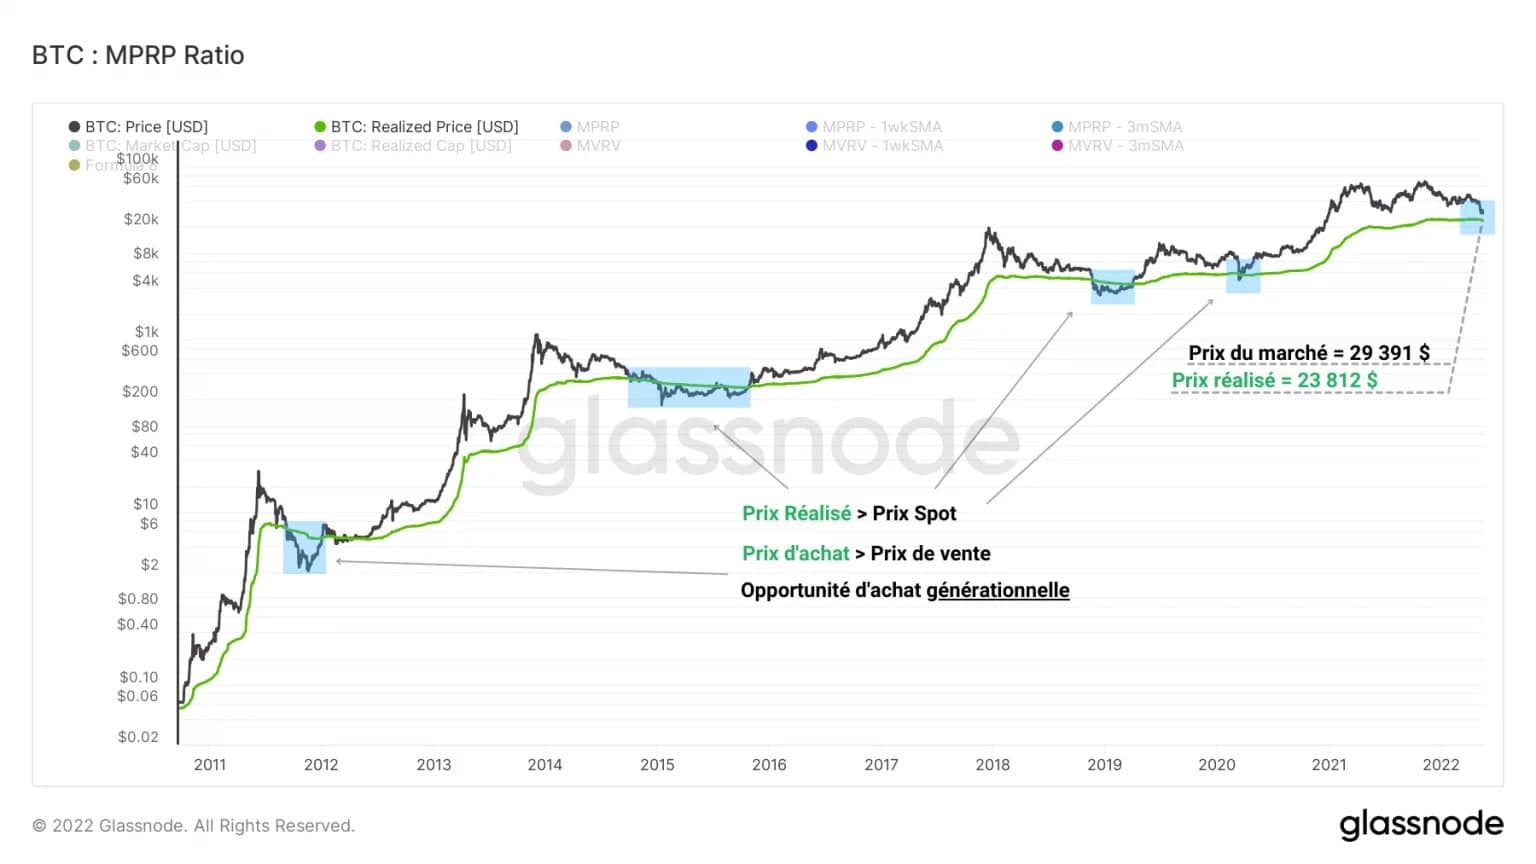
Figure 4: Realized Bitcoin Price
Historically, the bottom crossing of this level signals a rare buying opportunity. Indeed, since the realized price symbolizes the overall purchase price of the market and the spot price corresponds to the selling price, when the former plunges below the latter, the market is in a state of overall loss.
Divergence of economic commitment between East and West
Let’s turn now to a combination of metrics, recently released by Glassnode, tracking the cumulative 30-day price movement during trading hours in the US, Europe and Asia.
These metrics provide insight into which geographic areas of the market are leading or lagging in terms of buying or selling pressure, particularly in response to fundamental changes in market structure.
The chart below shows the monthly price changes in Europe (blue) and the US (yellow).
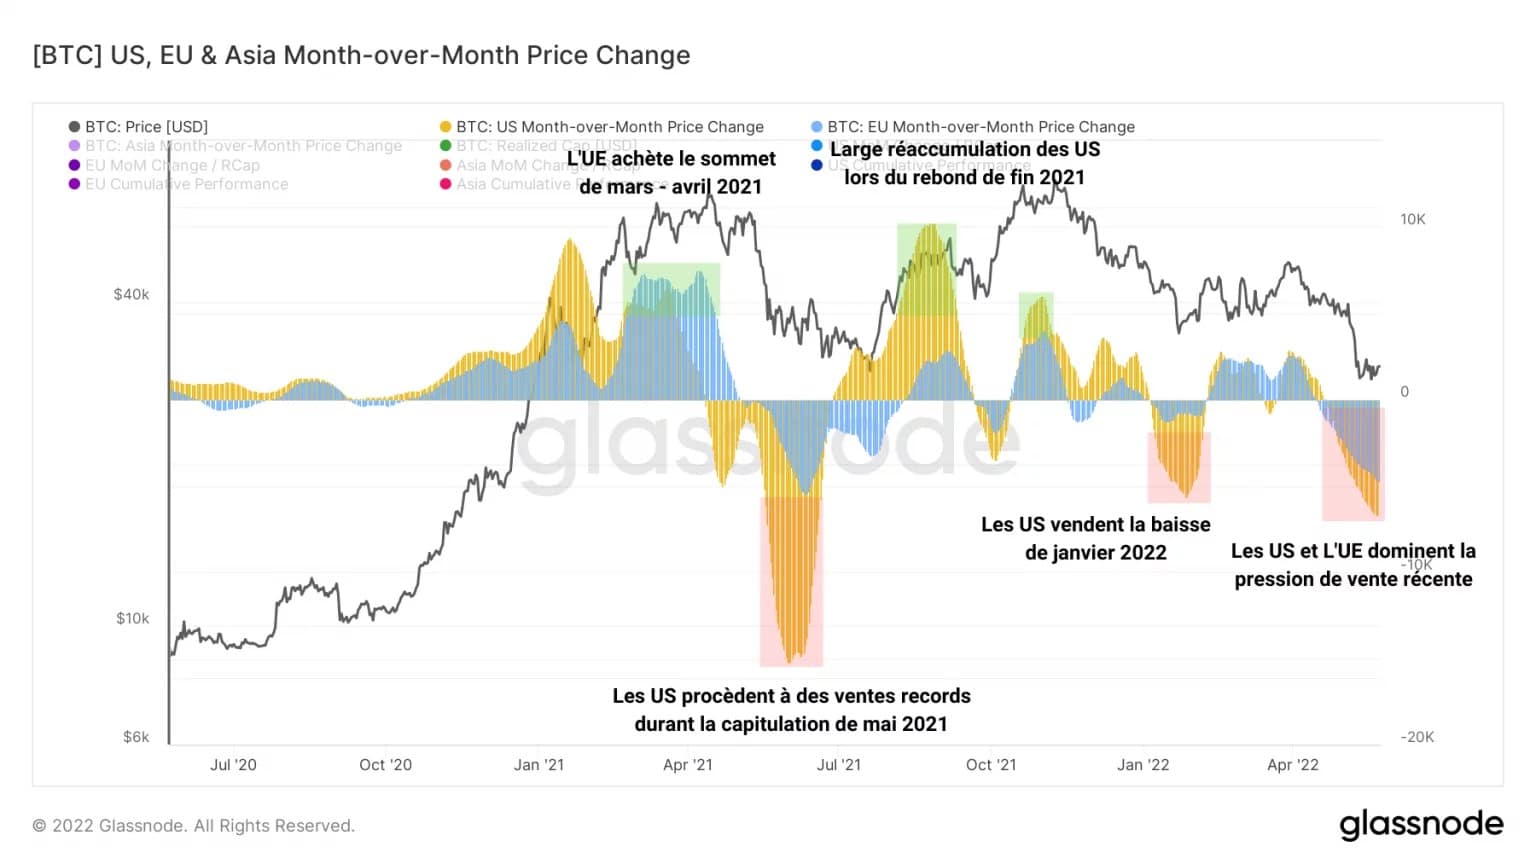
Figure 5: Monthly price changes for Europe and the US
Several notable observations can be drawn from this study:
- Europe precedes buying pressure at the March-April 2021 peak;
- US dominates sales at May sell-off;
- Then re-accumulate massively during late 2021 rebound and sell again during January 2022 -20% decline;
- More recently, Europe and the US dominate the selling pressure during the capitulation bringing the BTC price to the $30,000 level.
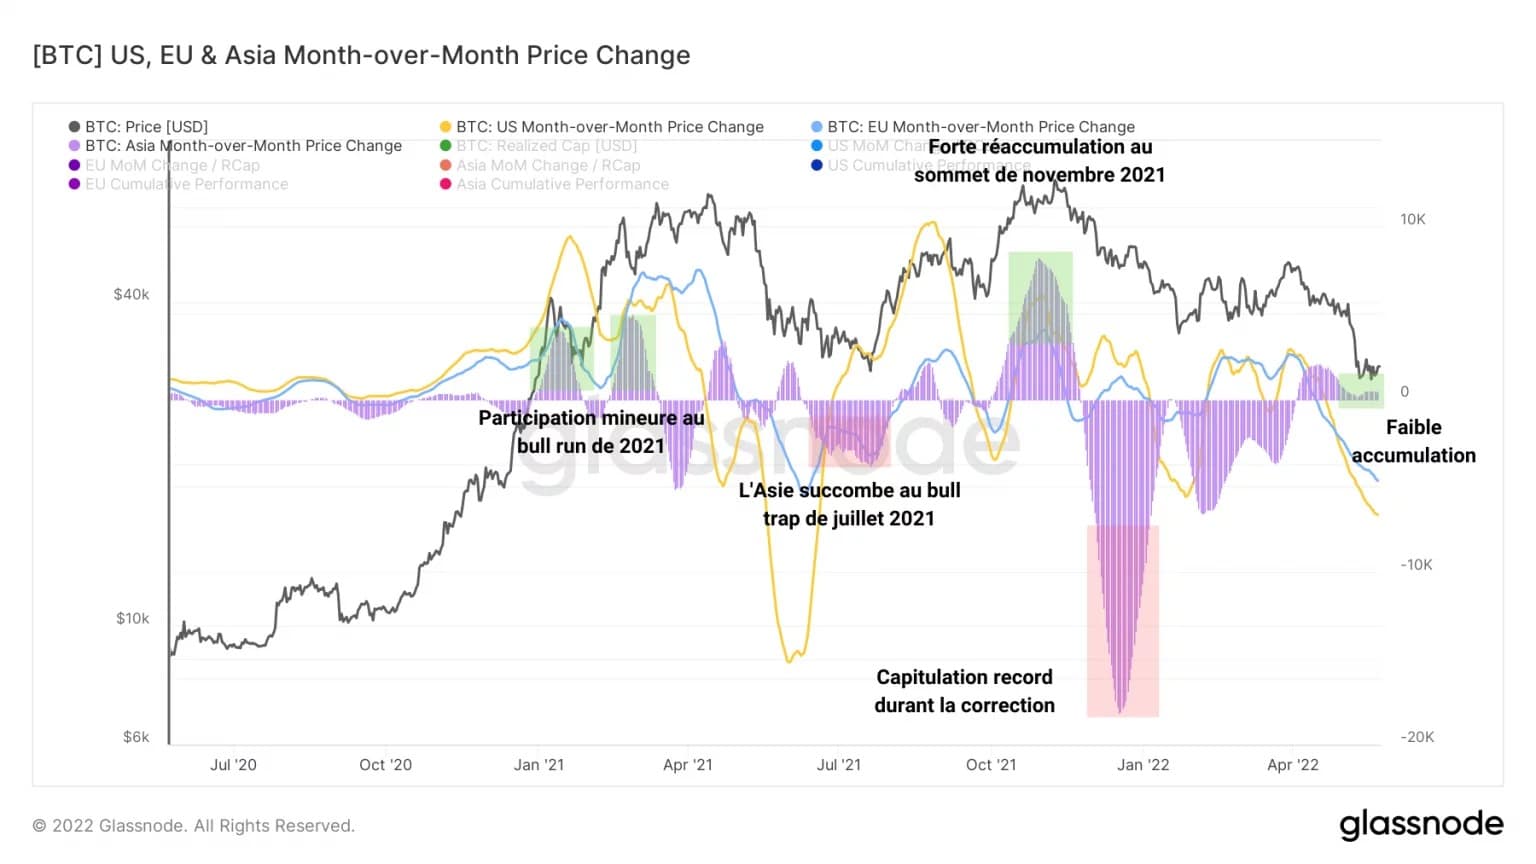
Figure 6: Monthly price changes for Asia
On the other hand, the Asian market (in purple) behaves relatively independently from its Western counterparts.
This time we can observe the following facts:
- Asia participates very little in the 2021 bull market and then succumbs to the long correction in July 2021;
- The East dominates the buying pressure at the November 2021 peak before capitulating during the correction in early 2022;
- In recent weeks, Asia preempts buying pressure in a modest way.
The study of these metrics shows that the East and the West have adopted different, even opposing, buying and selling decisions in recent years, which we will be sure to follow in our future analysis for clues to potentially meaningful behaviour.
Summary of this on-chain analysis
In sum, the Bitcoin (BTC) market is at a critical pivot point, both in its price action and its fundamentals.
While long-term investors are beginning to realize small losses, the entire cohort does not appear ready to begin a distribution of the supply accumulated over the past few years given current price levels. The conviction and HODLing behaviour of LTHs is now being tested and has the potential to influence the market trend over the coming months.
Realised price analysis indicates that a rare buying opportunity is on the horizon, although the global macroeconomic uncertainty does not allow us to estimate a rough price target for the potential market bottom ahead.
A new set of metrics informs us of the divergent economic commitment of different geographies involved within the cryptocurrency market. Recently, it appears that Europe and the US are dominating the selling pressure and capitulating while Asian markets are slowly accumulating as they take advantage of ongoing sell-offs.