
BlackRock’s announcement of demand for Bitcoin spot ETFs has catalysed a return of institutional interest in BTC, contributing in no small way to the recent rise in price. Moreover, the current market structure bears notable similarities to the early bull markets of previous BTC cycles, in June 2012, February 2016 and May 2019.
Bitcoin reacts to BlackRock news
After a monotonous May and June that tested investor conviction, the BTC price finally used the short-term realised price level as support.
In addition, BlackRock’s announcement of demand for spot ETFs on Bitcoin catalysed the return of institutional interest in BTC, propelling its price to the symbolic $30,000 level.
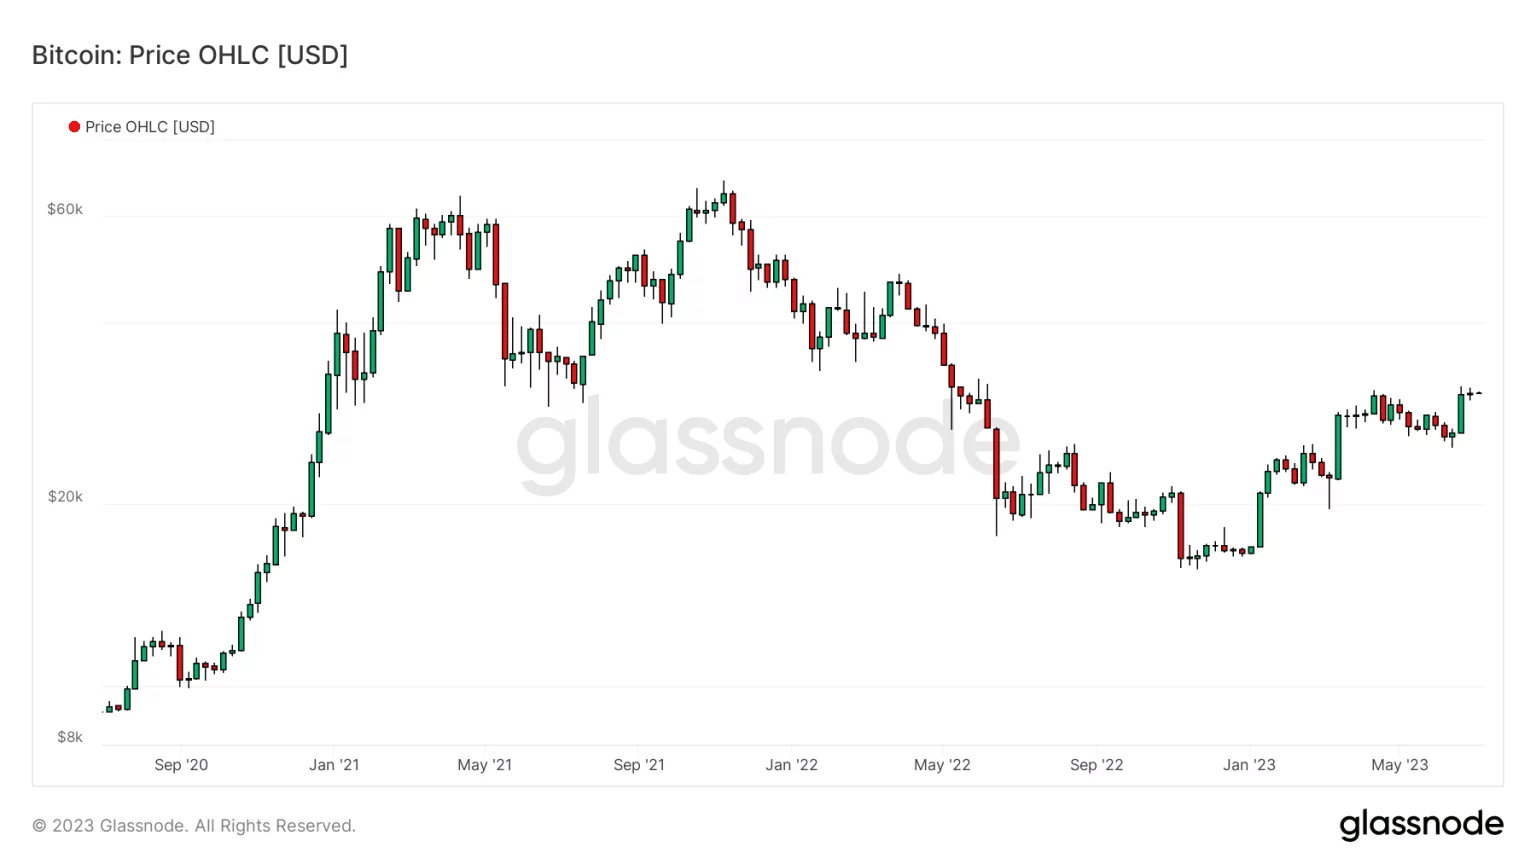
Figure 1: BTC daily price
Finally, the current market structure has notable similarities with the first hours of bull markets in previous BTC cycles, in June 2012, February 2016 and May 2019.
Institutions are finally giving the sign of life
Soon after the announcement of BlackRock’s Bitcoin Spot ETF, institutional funds in traditional finance began to follow suit, creating a favourable snowball effect for the BTC market. There has also been movement in existing Bitcoin spot ETFs, such as Canadian-based Purpose
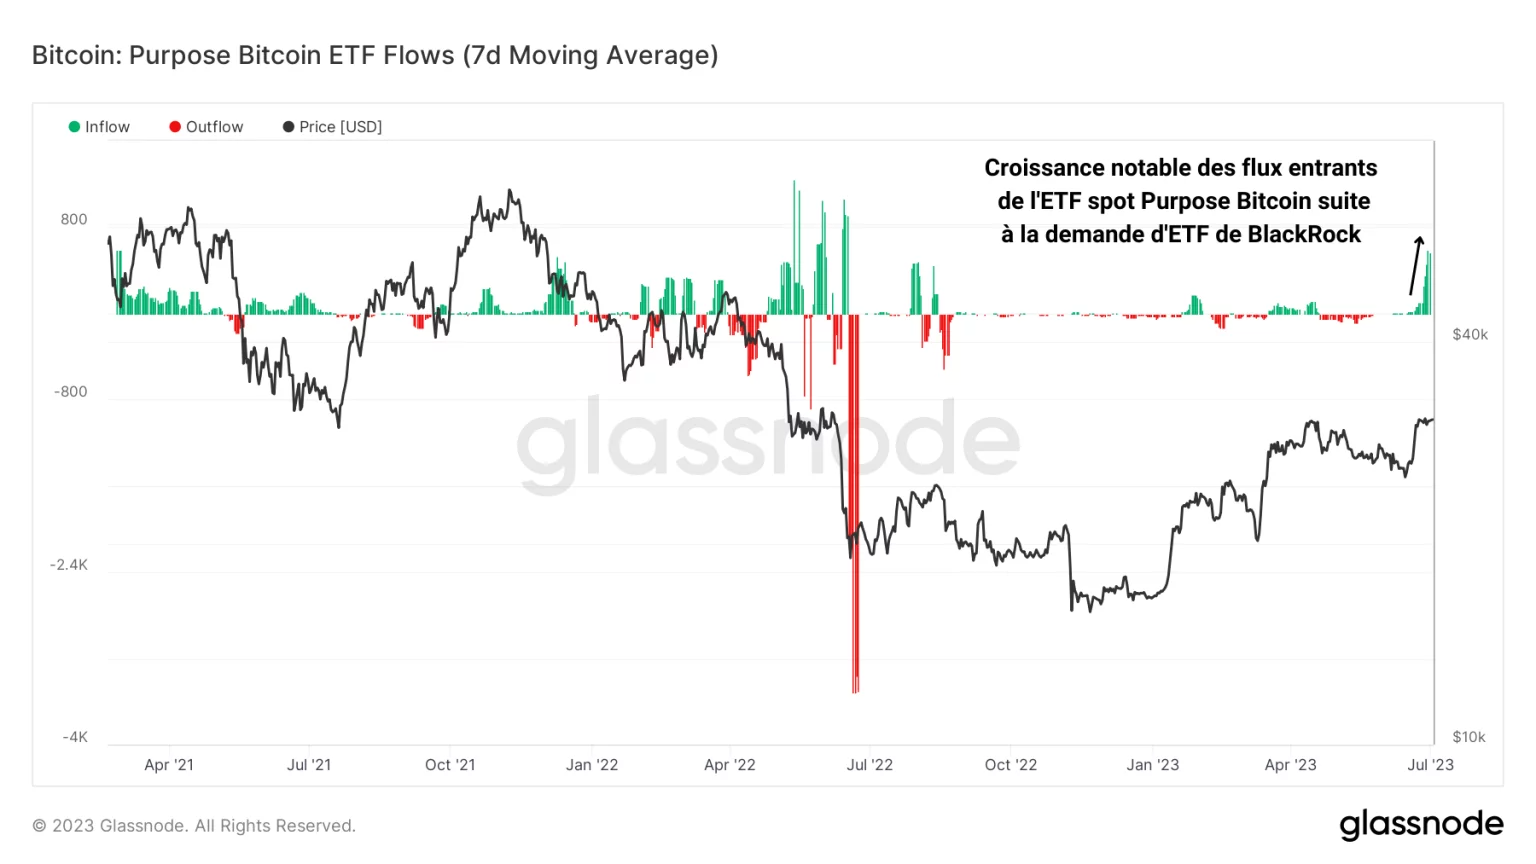
Figure 2: Purpose Bitcoin Spot ETF net BTC reserve flows
Following demand for BlackRock’s ETF, there has been a huge surge in ETF inflows, signalling the excitement but also the FOMO of some institutional investors in the face of such important news.
This dynamic is illustrated by the evolution of the BTC funds held by Purpose: after a period of doubt and notable disinterest of around a year, the fund is finally getting moving.
In response to recent client demand, Purpose bought more than 4,000 BTC on the spot market, thereby leaving the plateau of 23,000 BTC under management, which had stagnated since the capitulation of July 2022.
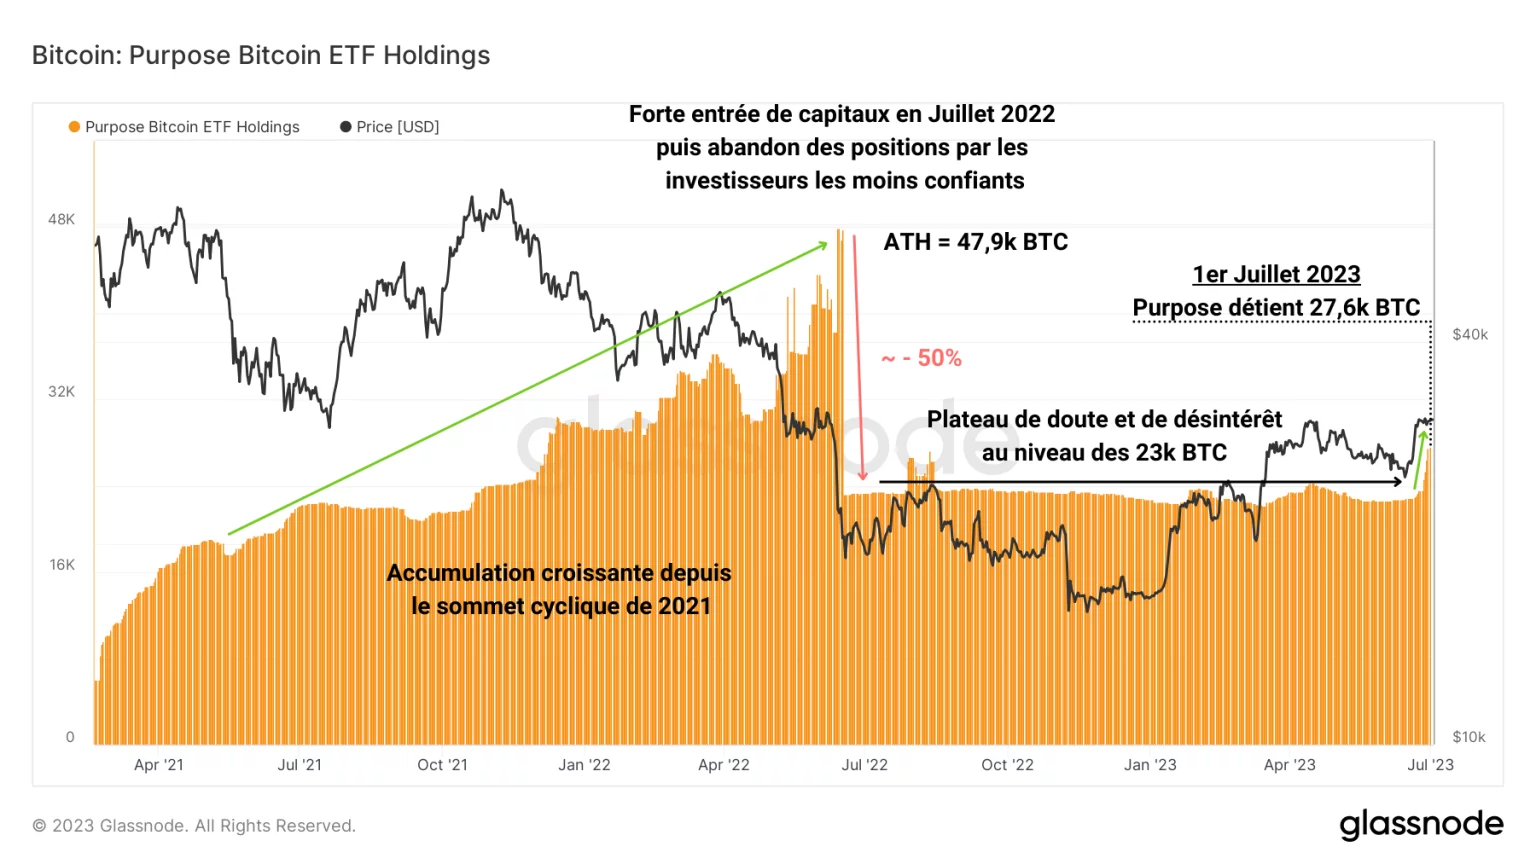
Figure 3: BTC reserves of the Purpose Bitcoin spot ETF
This rapid response to BlackRock’s announcement is another step towards the adoption of Bitcoin by the mainstream financial community. The latter will bring with it a multi-billion dollar flow of capital but also a potential increase in price manipulation on BTC, notably thanks to the suppression of short-term prices via derivatives markets.
This upsurge in institutional demand can also be seen in the reserves of OTC platforms such as GSR and Kraken OTC. Up by more than 140% since the start of the year, the volumes of liquidity available from these agents are adapting to market demand.
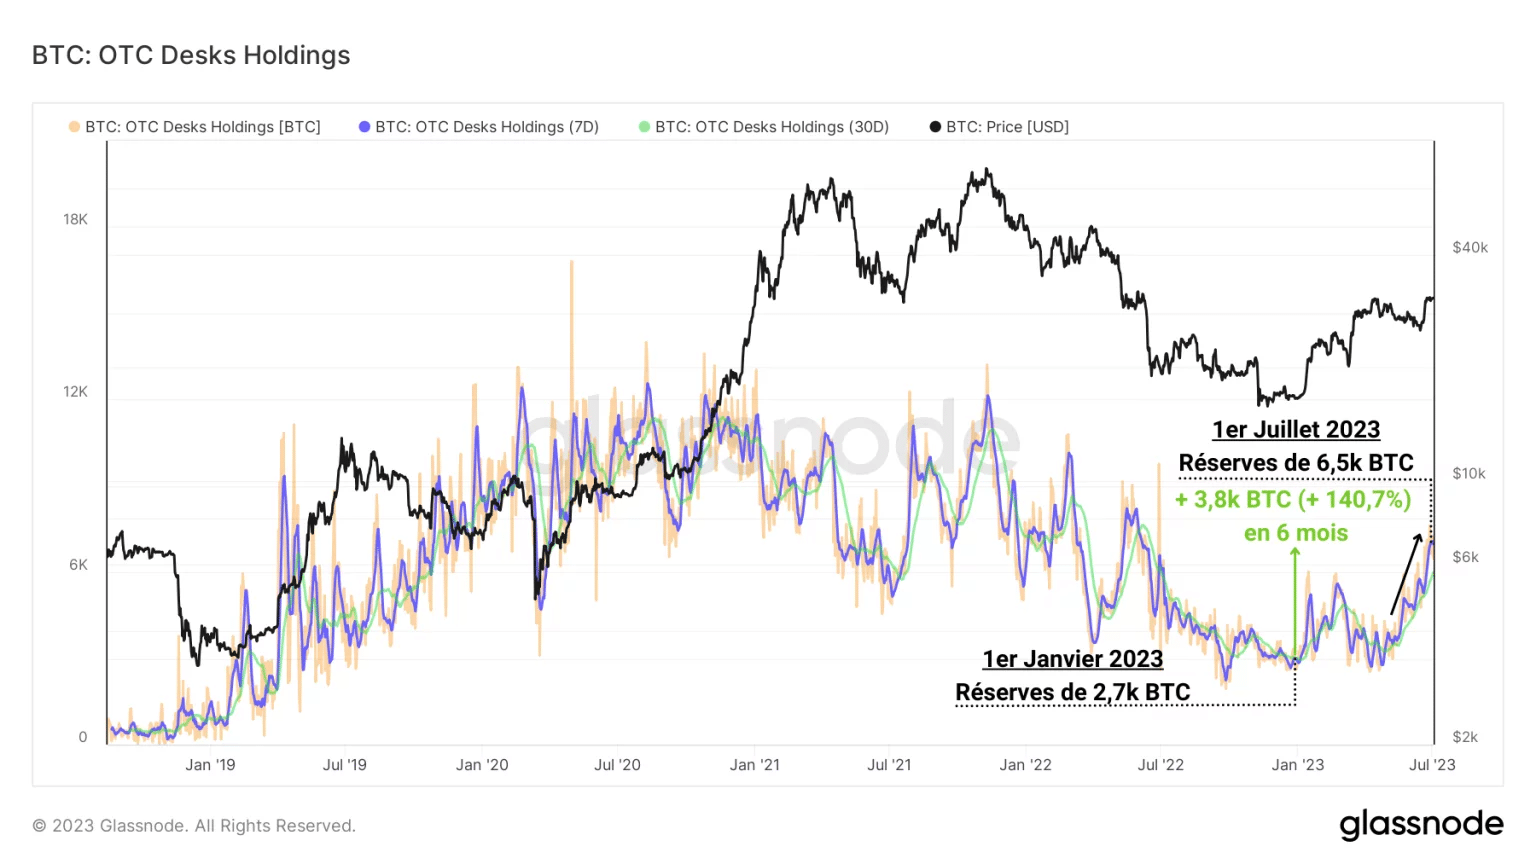
Figure 4: BTC reserves on OTC platforms
This suggests that demand from certain miners, exchanges and institutional players – who are regular users of OTC services – is also on the rise. Little by little, interest in BTC seems to be returning and 2023 is shaping up to be a pivotal year, bringing the transition between the end of the bear market of 2021 – 2022 and the future bull market, expected following the halving of 2024.
A new wave is forming
In a broader context, the current market structure bears notable similarities to the early bull markets of previous BTC cycles.
Once again, the profitability of the BTC market has bottomed out (November 2022) and is entering a new phase of profit growth. If previous cycles are anything to go by, it takes around 2 years for the percentage of supply in profit to go from a low of less than 50% to a first local peak signal, with a percentage above 99%.
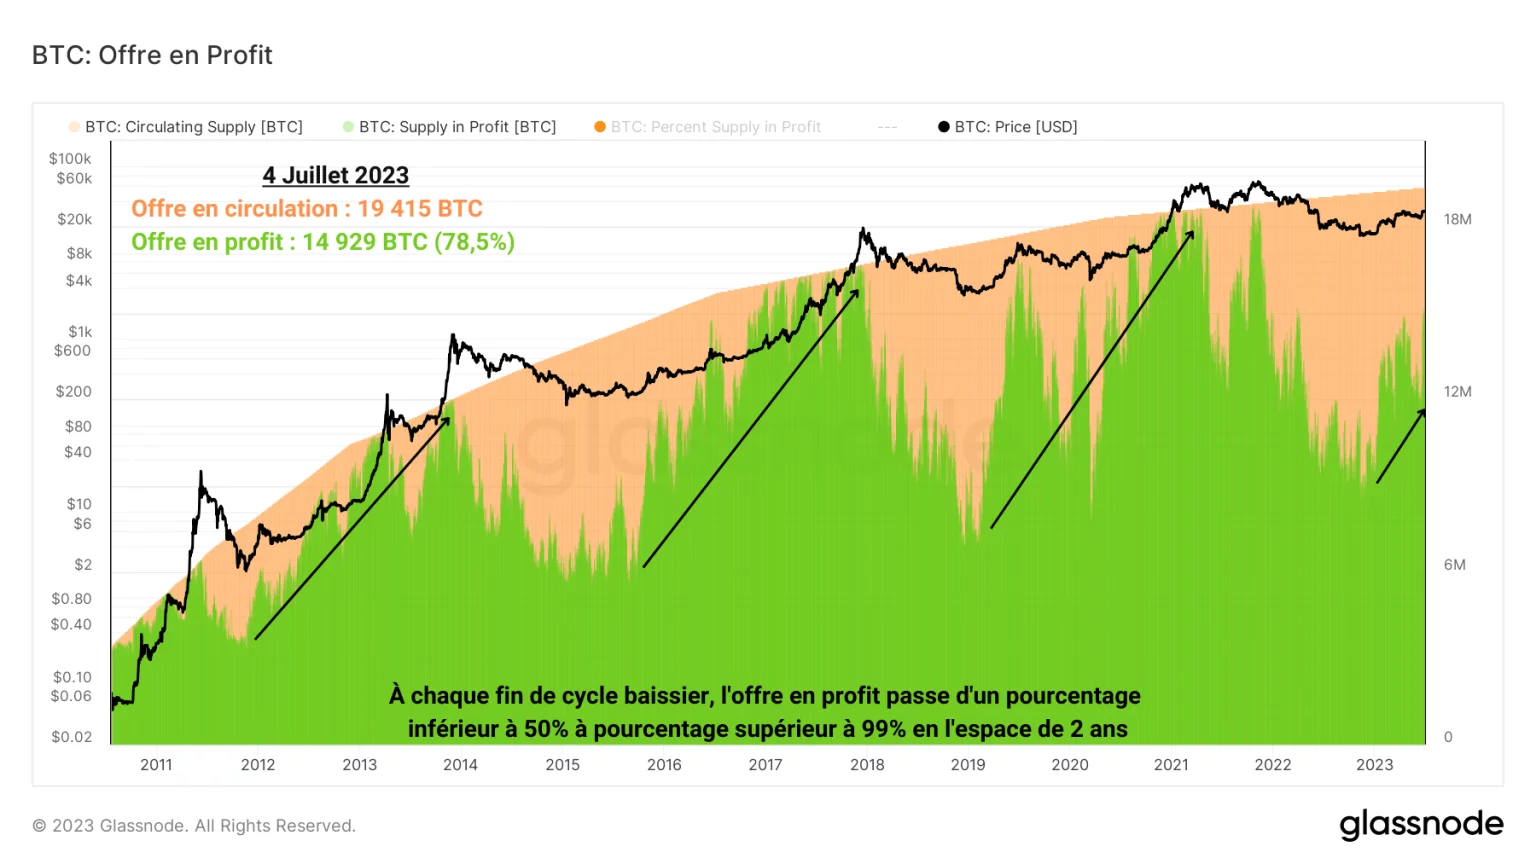
Figure 5: BTC supply in circulation and BTC supply in profit
We can therefore expect 2025 to mark the start of the bull market’s euphoric phase and the first extreme long-term profit-taking.
Taking this observation a step further with a statistical study, we can see that the current market structure closely resembles those of June 2012, February 2016 and May 2019. The following graph shows the historical average of the percentage of supply in profit (in blue), as well as variations of one standard deviation to the upside (in red) and to the downside (in green).
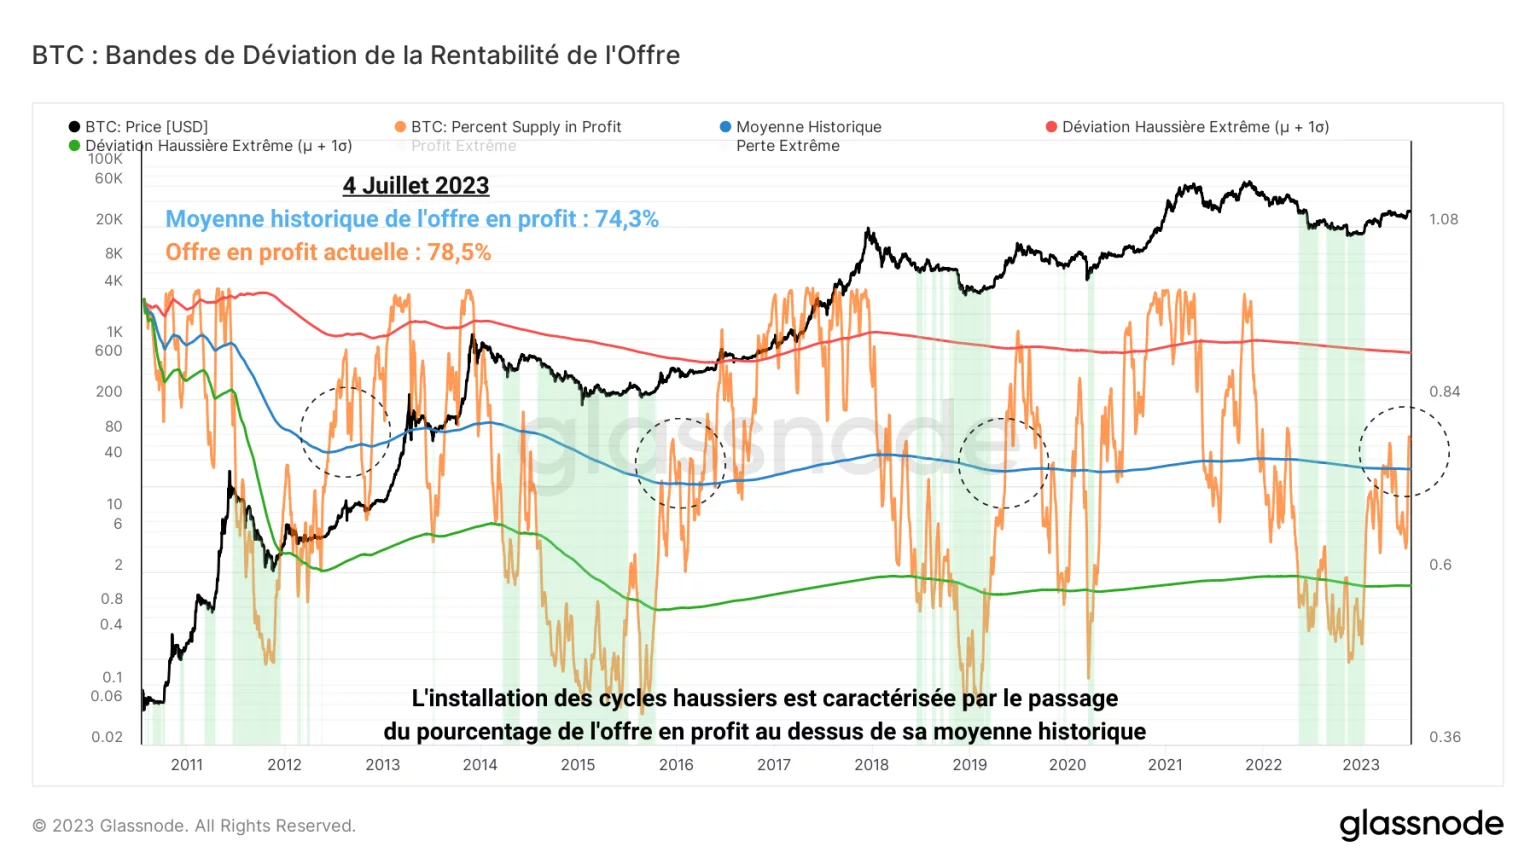
Figure 6: Deviation bands for the percentage of supply in profit
- Historically, periods in which the percentage of supply in profit is less than one standard deviation lower signal buying opportunities;
- Inversely, periods during which the percentage of supply in profit is greater than the variation of one standard deviation upwards signal selling areas.
Today, the bid-to-profit percentage is just above its historical average, at nearly 78%. This value coincides with the transitions between the end of the bear market and the start of the bull market in previous cycles.
It is now clear that the bear market is behind us and that the BTC price is about to embark on a new bull market cycle, which has historically lasted between 2 and 3 years.
Summary of this on-chain analysis of BTC
Following BlackRock’s ETF demand, there has been a significant increase in inflows into Purpose’s spot ETF, signalling a return of institutional interest in Bitcoin. This renewed demand can also be seen in the reserves of OTC platforms, which have more than doubled in 6 months.
What’s more, the current market structure bears striking similarities to the early bull markets of previous BTC cycles. It is now clear that the bear market is behind us and that the BTC price is about to embark on a new upward cycle.
However, let’s not forget that one of the historical triggers for ATH breakouts is halving, which is not expected until March-April 2024.