: Has the bull market begun?")
As the bullish break of the $30,000 mark provides a very encouraging signal for Bitcoin (BTC), the crypto market is entering a bull market configuration. However, recent coordinated profit-taking by investors and speculators has been able to offset the buying pressure of the latest entrants and curb BTC’s rise to the $35,000 level.
BTC crosses long-term pivot point
After nearly a year of unsuccessful attempts, the price of Bitcoin (BTC) has finally crossed the bull/bear pivot for the 2020 – 2023 cycle, located at the $30,000 level.
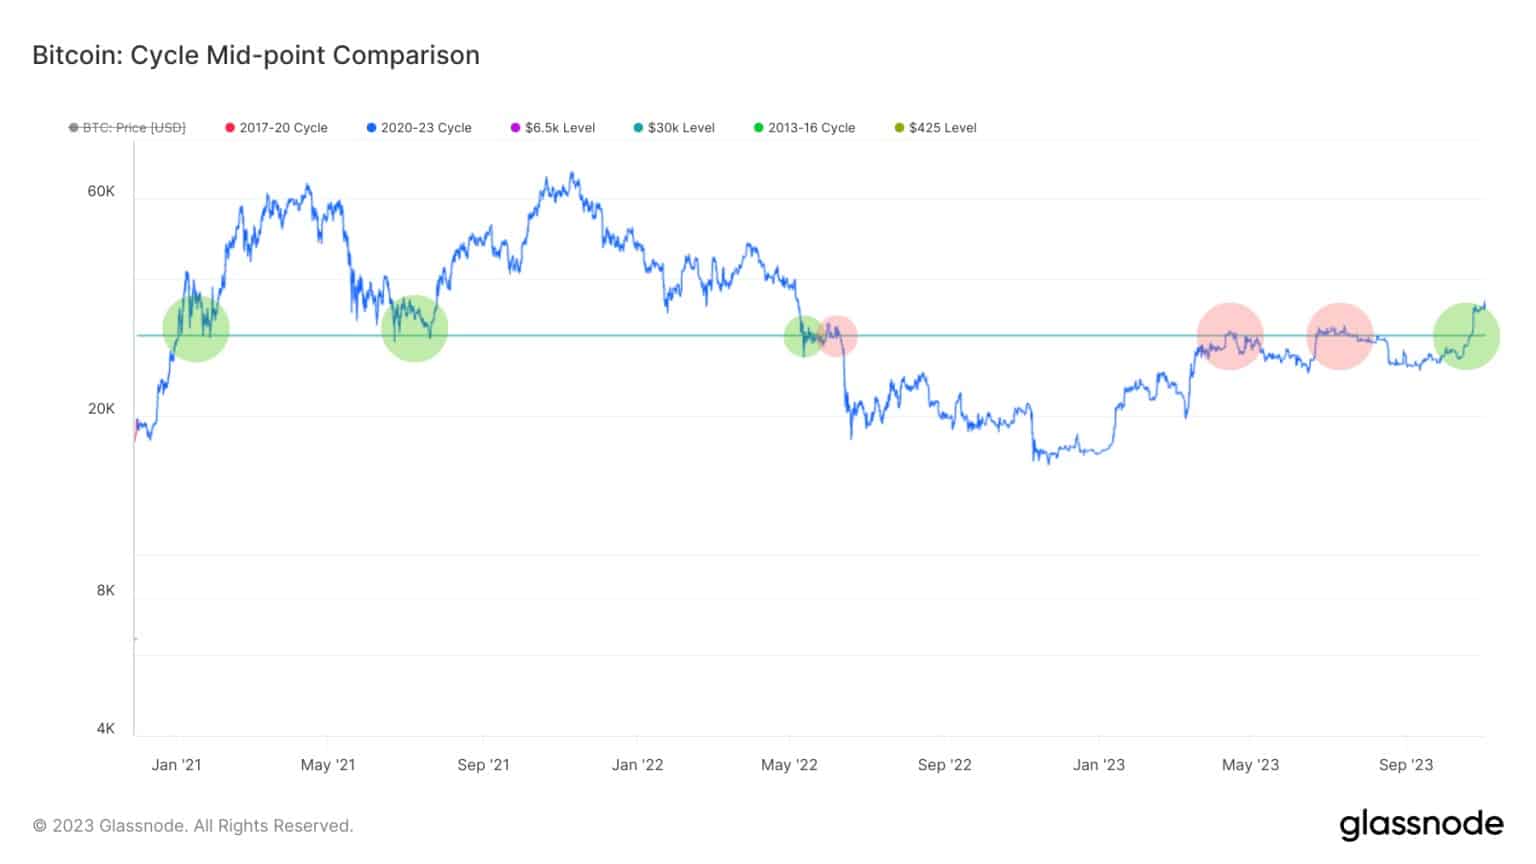
Figure 1: BTC price and bull/bear pivot for the 2020 – 2023 cycle
We’ve been documenting the evolution of the crypto market via on-chain analysis for a long time now, and it seems that the current market context is providing a very encouraging signal.
Firstly, it sends a very positive message to investors who have not yet entered the market, waiting for a less risky context to commit.
Secondly, it puts investors already in the market in a very favourable frame of mind for the advent of a long-term bull market or bull run.
BTC market cycles
It’s common knowledge that the BTC market moves in cycles. This doesn’t mean that it necessarily repeats itself identically from one cycle to the next, but rather that it rhymes and reproduces a certain underlying dynamic. In fact, market profitability oscillates between periods of growth and decline in the wealth held within the supply in circulation.
The following graph shows the oscillations in the percentage of BTC supply in profit between:
- the historical average, signalling the pivot between bullish and bearish contexts :large_blue_circle:
- statistically high values recorded during advanced bull market phases :red_circle:
- statistically low values recorded during advanced bear market phases :green_circle:
Over the course of 2023, the percentage of supply in profit has moved from statistically low values (below 50%) to more common profitability values, hovering around its average from the second quarter onwards.
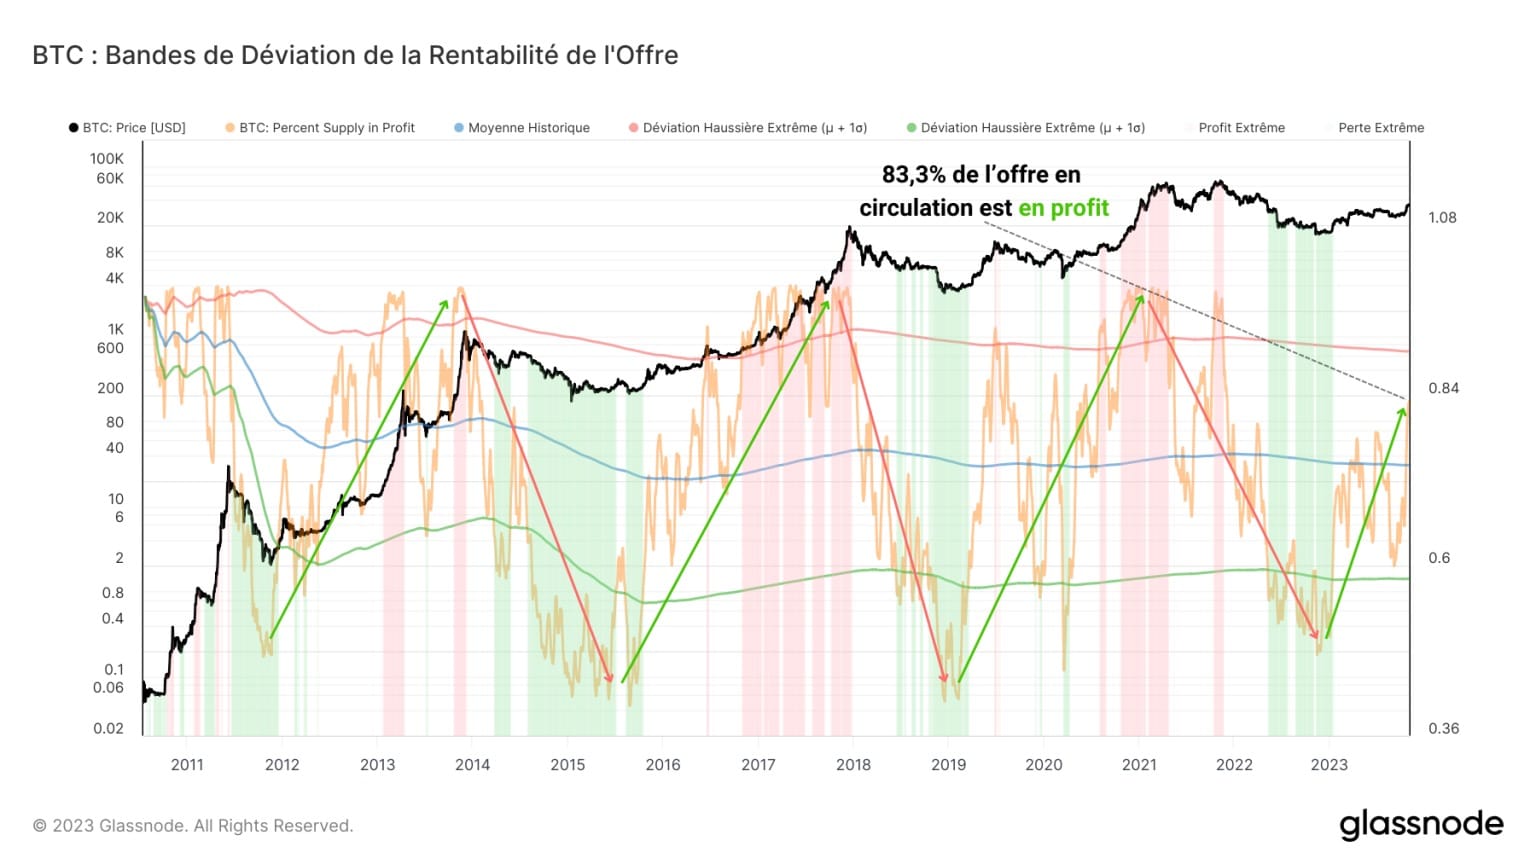
Figure 2: BTC profit offer deviation bands
Recently, this metric has significantly surpassed the historical average, with the bid-to-profit rate currently standing at almost 83%.
This clear improvement in market profitability reinforces the observation that we are entering a bull market and long-term bullish bias.
Measuring the latent profitability of investors (UTXOs aged over 155 days) :blue_square: and speculators (UTXOs aged under 155 days) :red_square: provides a concise visualization of these cycles of wealth growth and decline.
We find here the signals of the bear → bull transition model: when short-term latent profitability is higher than long-term latent profitability in a bear market context, it means that the bear market is coming to an end :purple_square:.
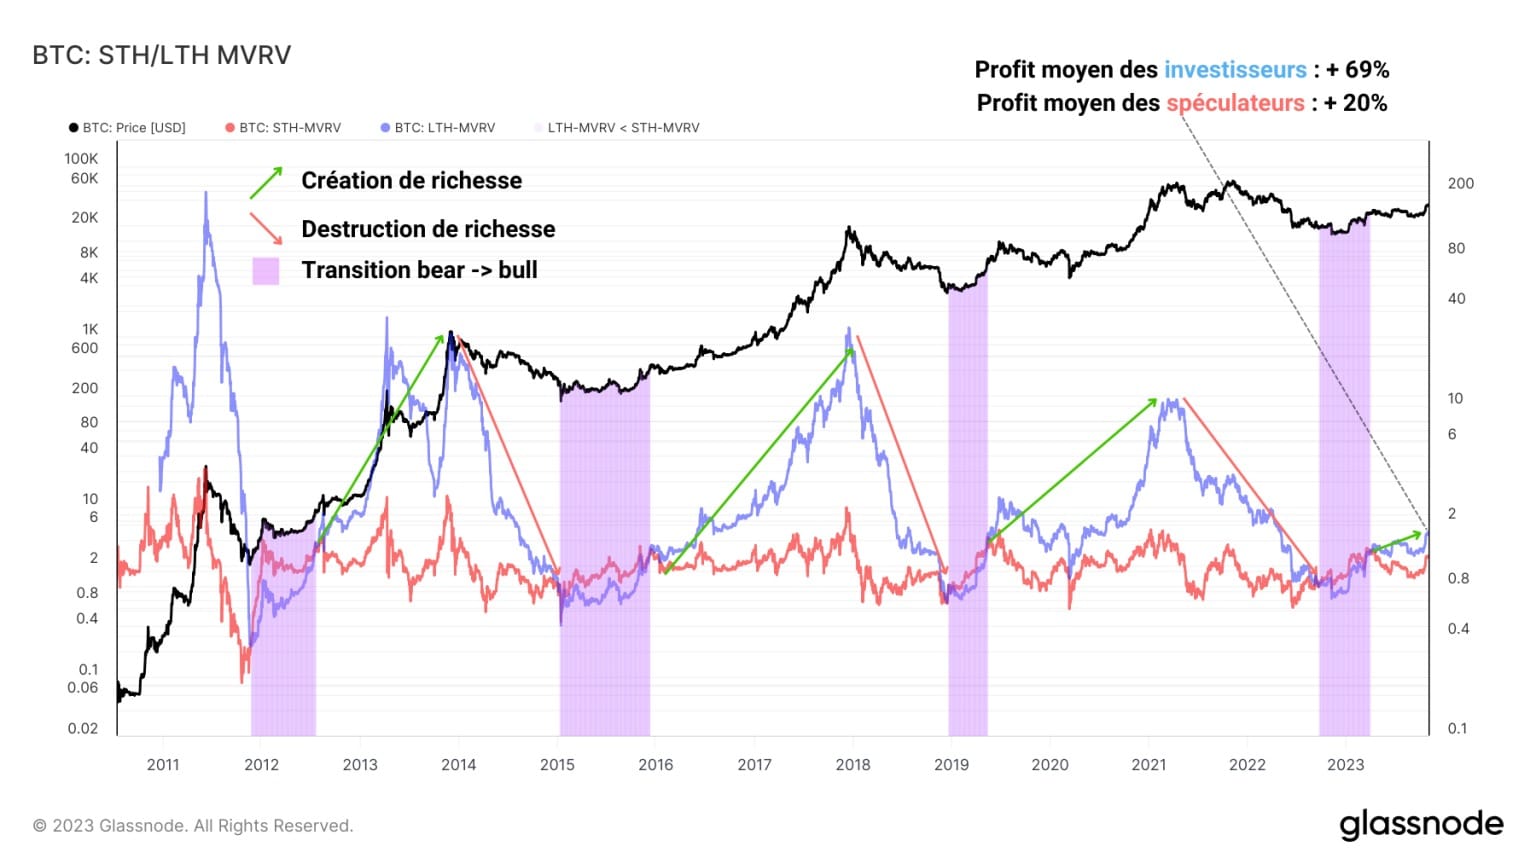
Figure 3: MVRV ratios for investors and speculators
This model, presented for the first time (and exclusively) by TCN Research in September 2022, has pointed out with surgical precision the entire transitions between the end of the bear market and the beginning of the bull market in the history of the BTC market.
While long-term profitability offers a clear signal of the cyclical dynamics underway, short-term profitability provides a precise indication of punctual stress points.
Currently, long-term latent profitability continues to grow, with the average investor holding a profit of +69%. The recent rise in the BTC price above $34,000 has also pushed speculators into a state of significant profit, with an average profit of +20%.
The condition of investors and speculators
Using the same method as above, we can also gauge the condition of participants via the percentage of profit offered by different groups.
As far as investors are concerned, the profitability of their offer evolves slowly and progressively, as we illustrated earlier.
Investors tend to experience:
- periods of high profitability (☻ 98% of supply in profit) during the advanced phases of bull markets (green)
- periods of low profitability (☺ %60 offer in profit) during advanced bear market phases (red)
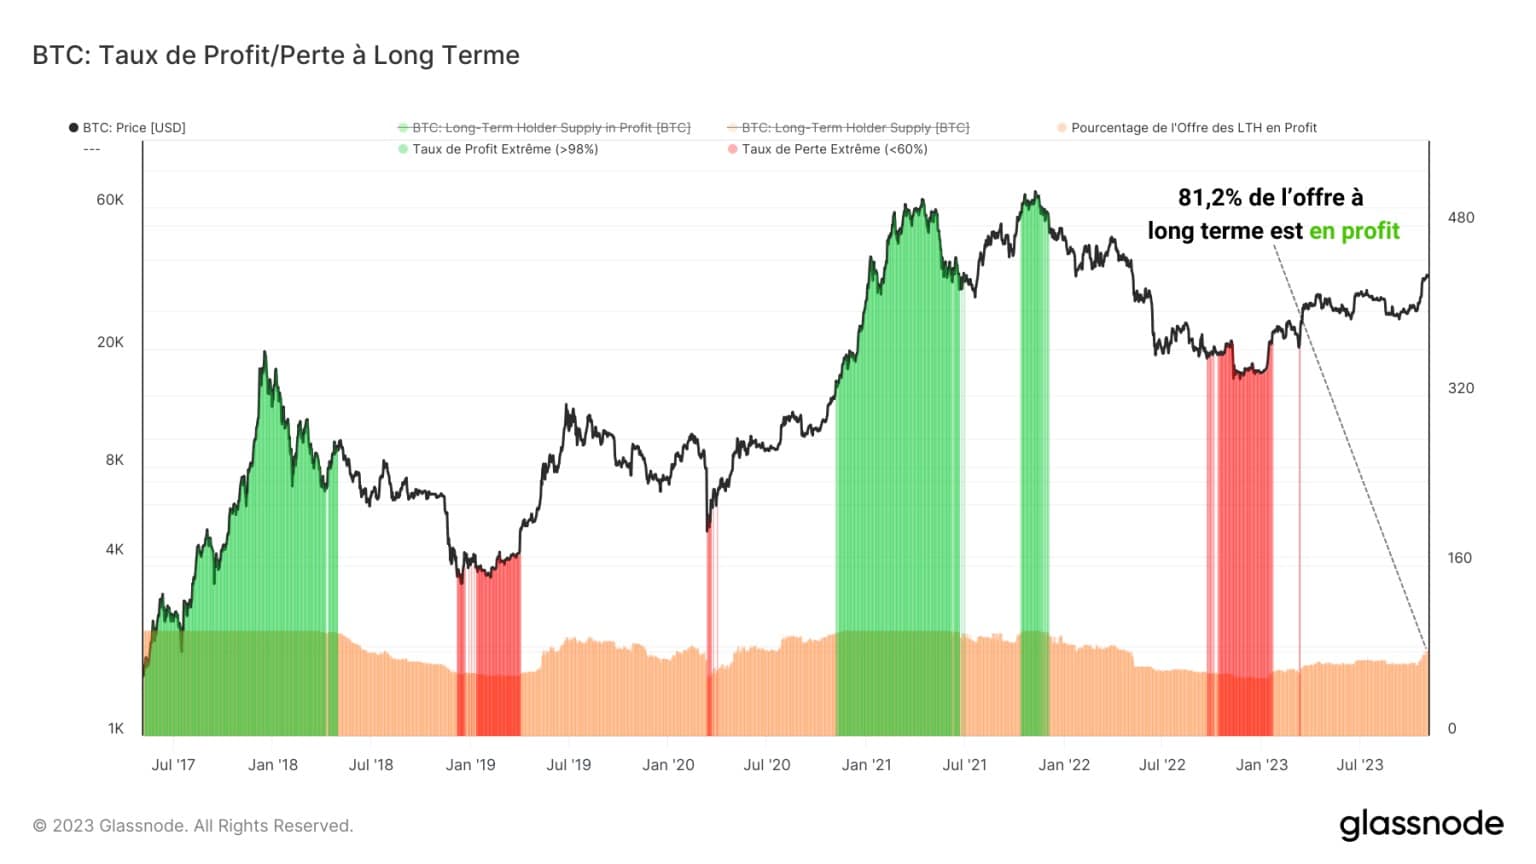
Figure 4: Percentage of profit bid by investors
Actually, the long-term profit rate is 81.2%, which means that a significant proportion of investors are in a state of latent profit and are in a position to make a profit (potential selling pressure).
As for speculators, the profitability of their offer fluctuates more rapidly and reactively, reflecting the sensitivity characteristic of this group.
Speculators tend to know :
- periods of high profitability (☻ 98% supply in profit) at local and cyclical market peaks (green)
- periods of low profitability (☺ %2 of supply in profit) at hollow and cyclical market peaks (red)
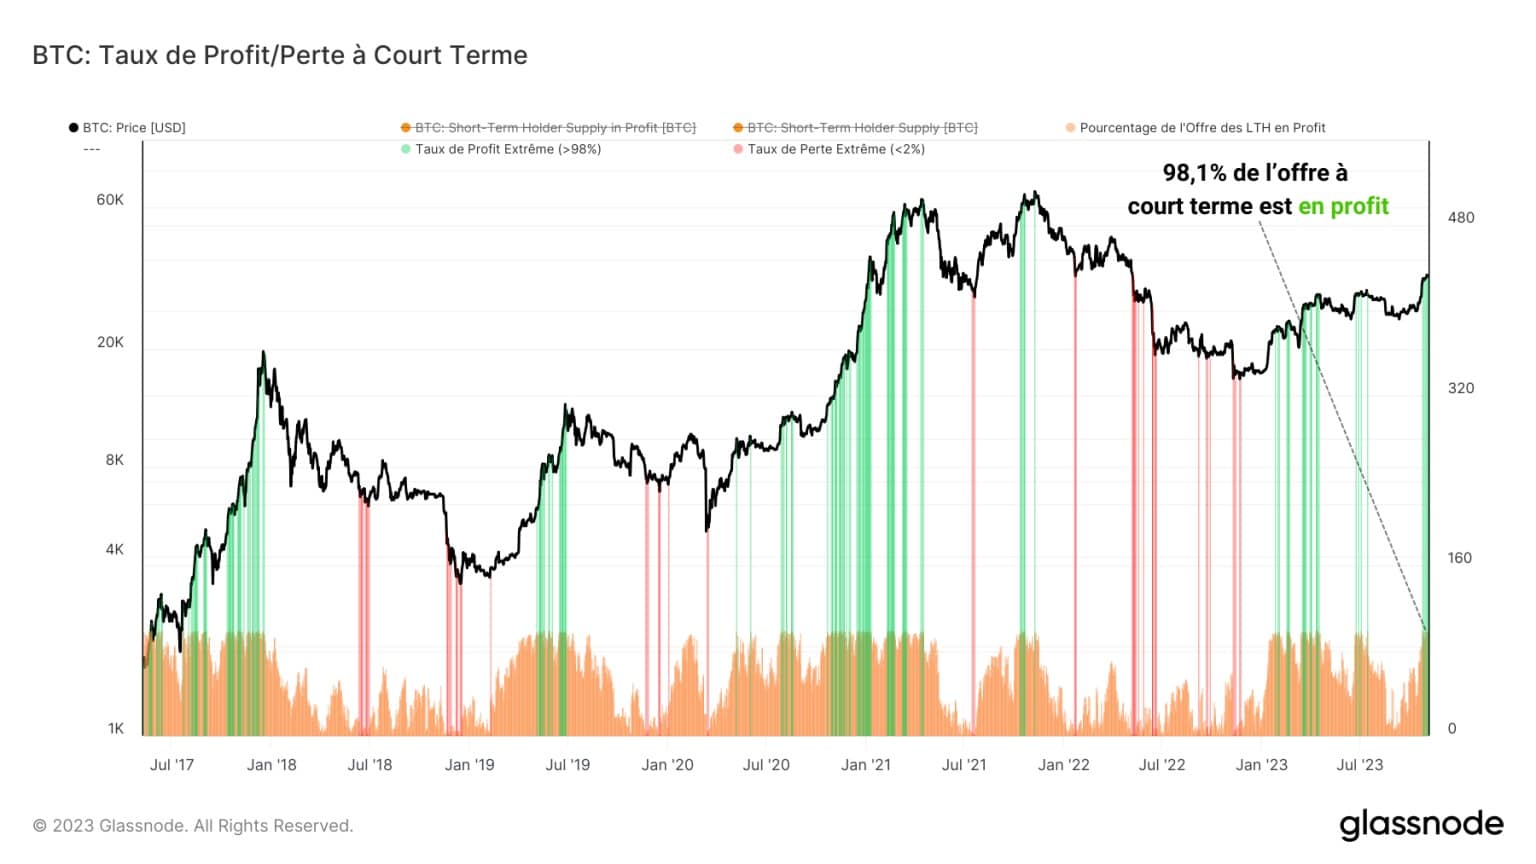
Figure 5: Speculators’ percentage supply of profit
Currently, the short-term profit rate is 98.1%, indicating that an overwhelming majority of speculators are in a position to make a profit, inducing selling pressure capable of slowing the rise of the BTC price.
Following supply movements
In order to confirm the observations made above, in this final section we will measure changes in URPD, our aim being to study how the supply of BTC has moved in response to the recent price action.
The representation of URPD separating :blue_square: investors and :red_square: speculators confirms these observations and signals the arrival of a cluster of young BTC in the $33,500 – $35,000 area.
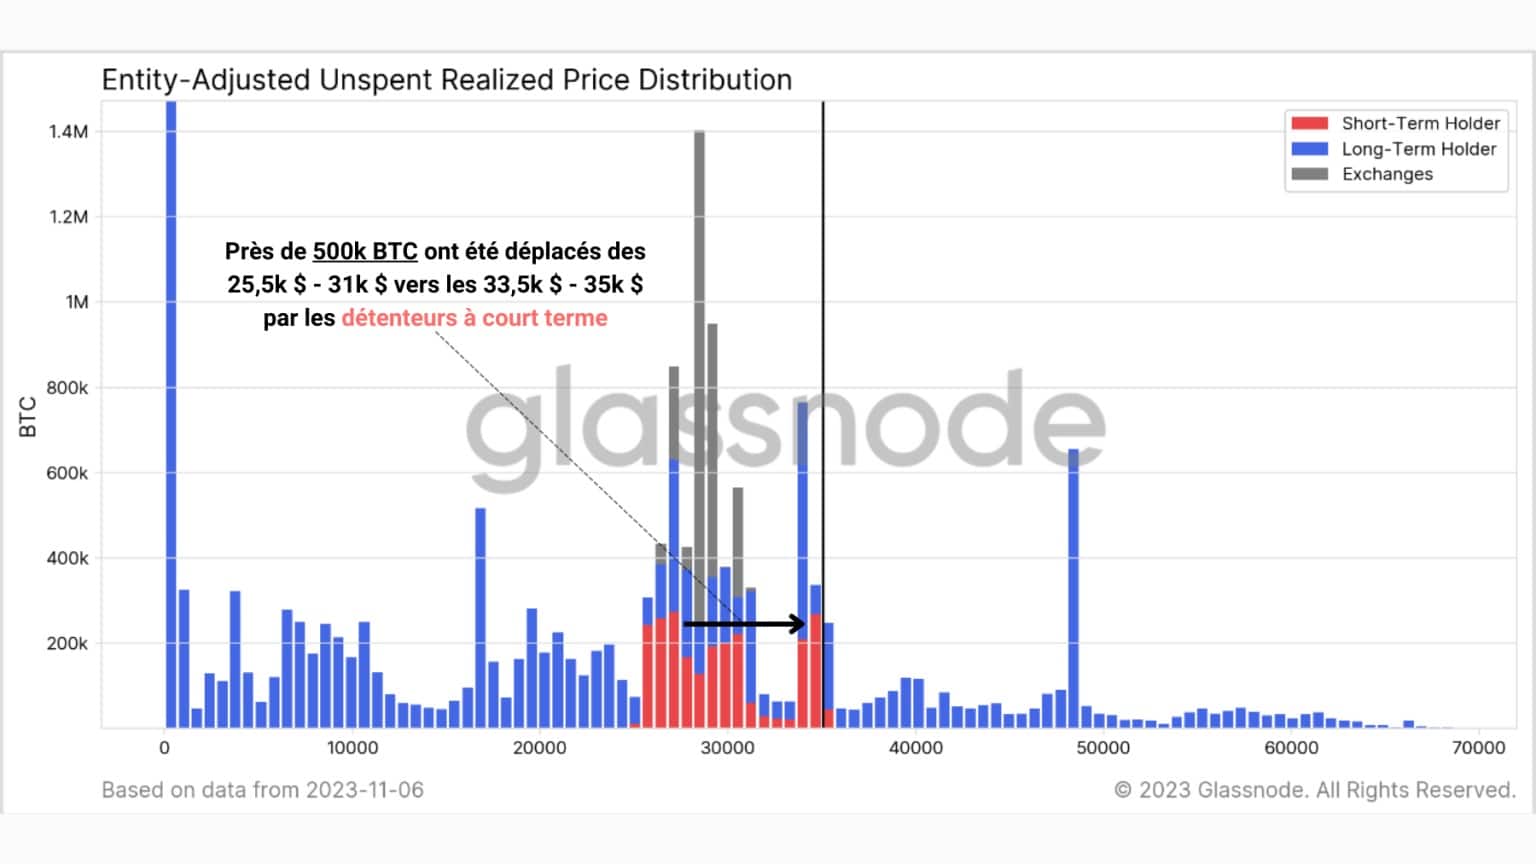
Figure 6: URPD STH/LTH
In total, nearly 500,000 BTC moved from the $25,500 – $31,000 (speculator zone) to the $33,500 – $35,000, leaving a visible trace of the spending behavior generated by the recent selling opportunity.
Summary of this on-chain analysis of Bitcoin
Finally, this week’s data indicates that the bullish break of $30,000 is providing a very encouraging signal to market participants.
With the percentage of supply in profit having significantly breached its historical average, the market is entering a bull market configuration with a long-term bullish bias.
As long-term latent profitability continues to grow, the overwhelming majority of speculators are in profit, creating strong potential selling pressure on the market.
The recent coordinated profit-taking by investors and speculators has effectively offset the buying pressure of the latest entrants and curbed BTC’s rise to the $35,000 level.