
Last week of December: Bitcoin (BTC) is still moving within its range while derivatives markets are experiencing a resurgence of power that should not be overlooked. In addition, participant engagement on the blockchain is struggling to regain the levels established in early 2021. On-chain analysis of the situation
Seventh test of the bottom of the range for bitcoin (BTC)
Testing the bottom of the range between $52,000 and $46,500 for the seventh time, the price of bitcoin (BTC) rejects the 21 eMA daily and closes the 200 sMA daily.
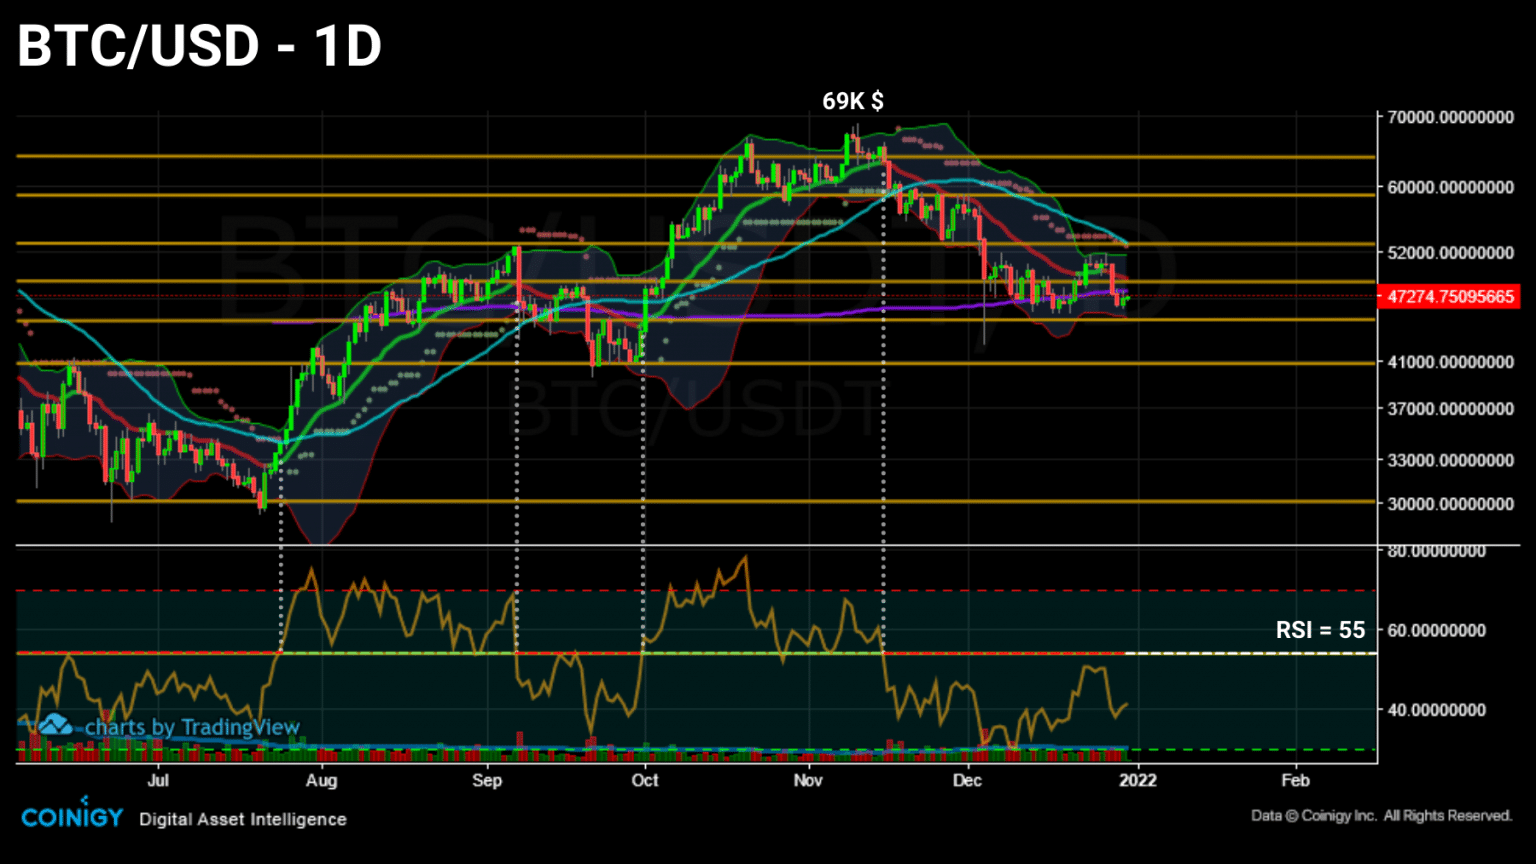
Daily Bitcoin (BTC) price chart (Source: Coinigy)
Bitcoin (BTC) is still trading in a moderately dense volume cluster with the $50,000 area serving as a threshold to be breached in the short term.
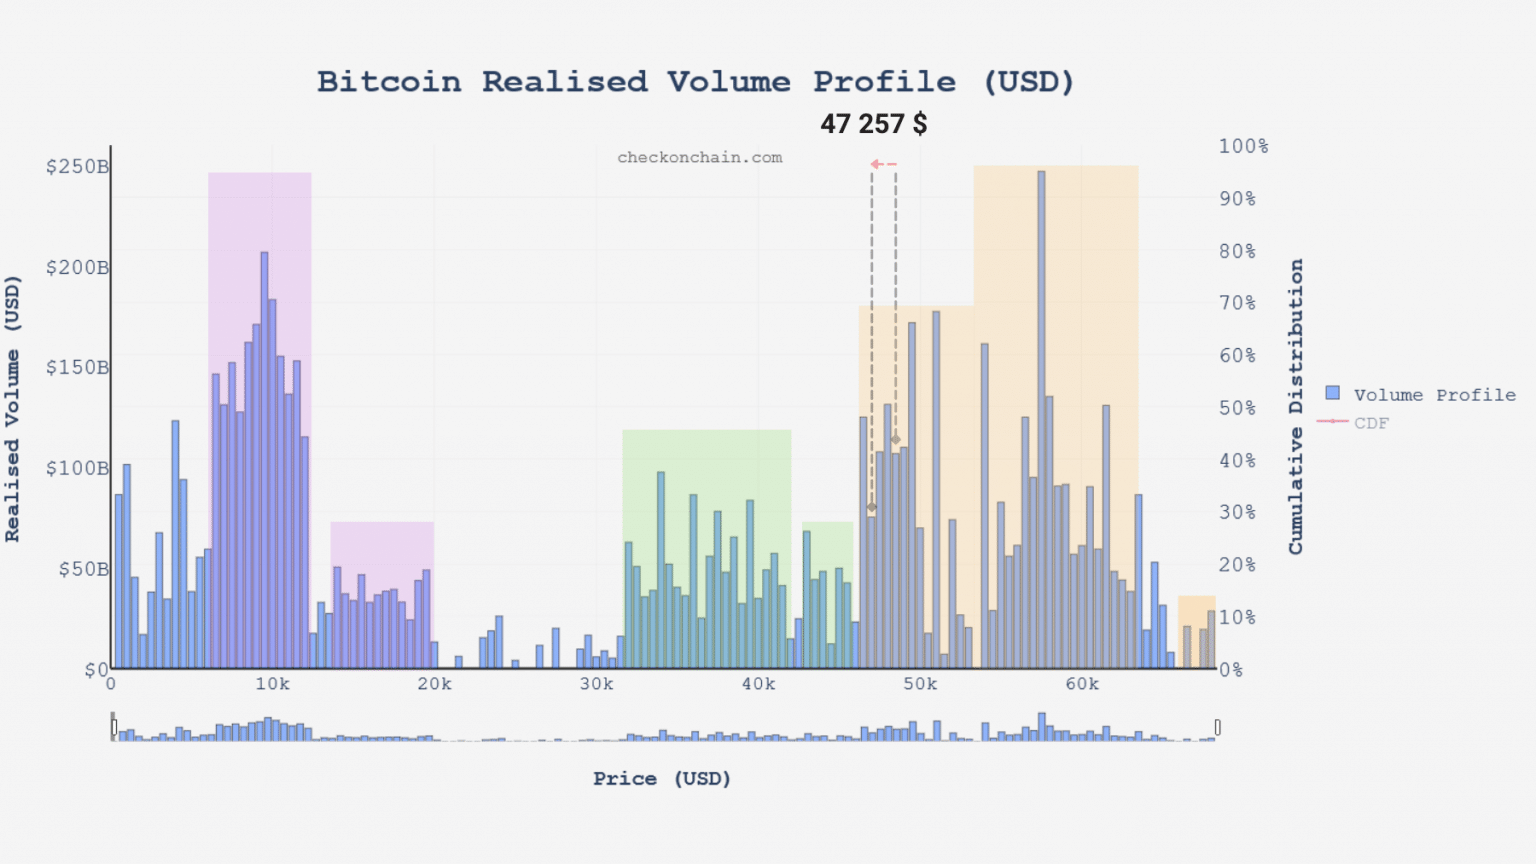
Realized Volume Chart of Bitcoin (BTC) (Source: checkonchain.com)
This week, we look at the resurgence of inflows on exchange platforms before observing the rapid resumption of the derivatives markets’ influence on the BTC price and the evolution of participant engagement throughout the year.
Year-end deposits on exchanges
To begin with, let’s note that Bitcoin (BTC) is progressing within a moderately dense volume cluster where the $50,000 area serves as a threshold to be breached in the short term. since our December 17 observation.
While this may be a sign of caution on the part of some investors, this micro-trend may also be explained by the propensity of a significant number of participants to sell a portion of their tokens in order to fund year-end expenses or report losses for the following fiscal year.
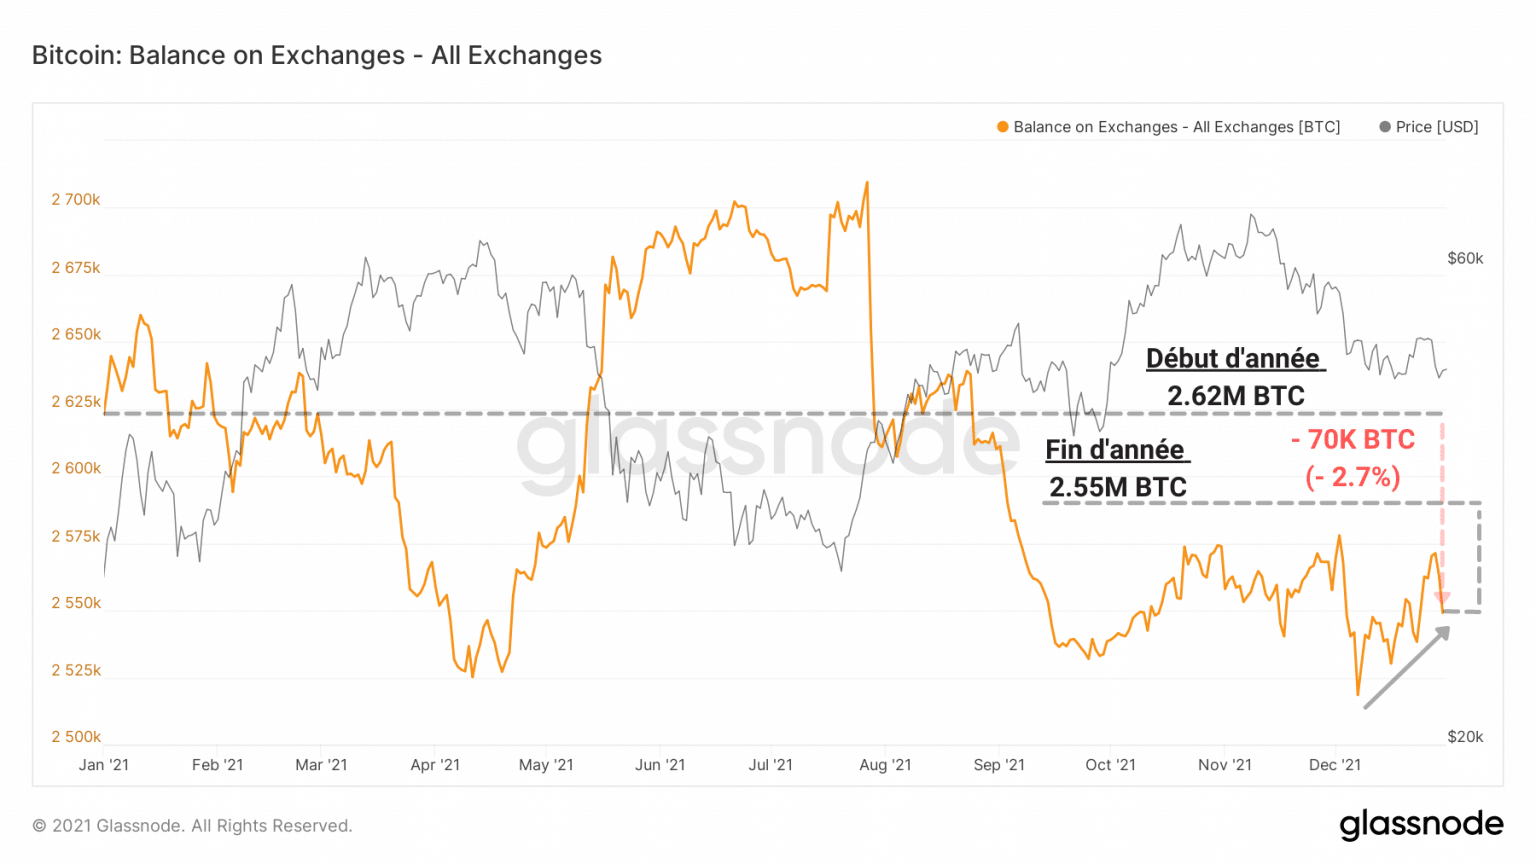
Graph of exchange reserves (Source: Glassnode)
Overall, exchange reserves have seen only a very small net change this year, although the downward trend remains intact from a long-term perspective.
From 2.62 million BTC at the beginning of the year to 2.55 million BTC today, this is a net decrease of 70,000 BTC, or a 2.7% reduction.
We can clearly see this behaviour via the net transfer volume of exchanges, which has spent the entire year oscillating between plus and minus 5,000 BTC.
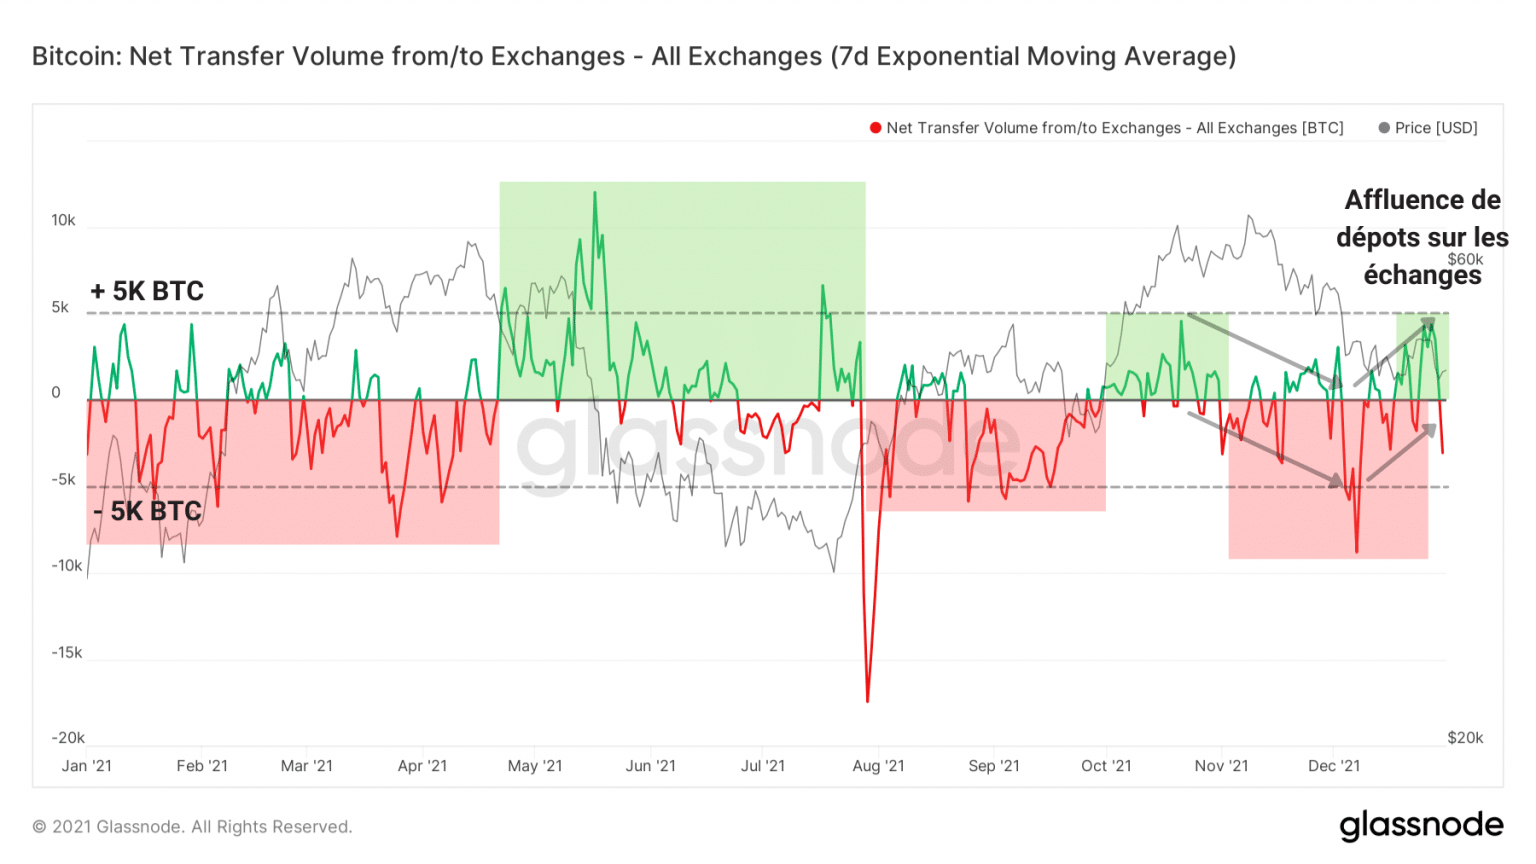
Net Trade Transfer Volume Chart (Source: Glassnode)
That said, over the past week we have seen another reversal, with inflows dominating again as bitcoin (BTC) sits near its support.
In the immediate future, this trend is worth watching to see if it will moderate or strengthen during January 2022.
Derivatives markets gaining power
Let’s now look at the dynamics of the derivatives market, the nemesis of the spot market where speculation is rife.
While the successive waves of liquidation in November and December seemed to have purged this environment of its excess leverage, it seems that this effect was only short-lived.
Indeed, funds allocated to future contracts quickly flowed in (green) after the early December purge (red).
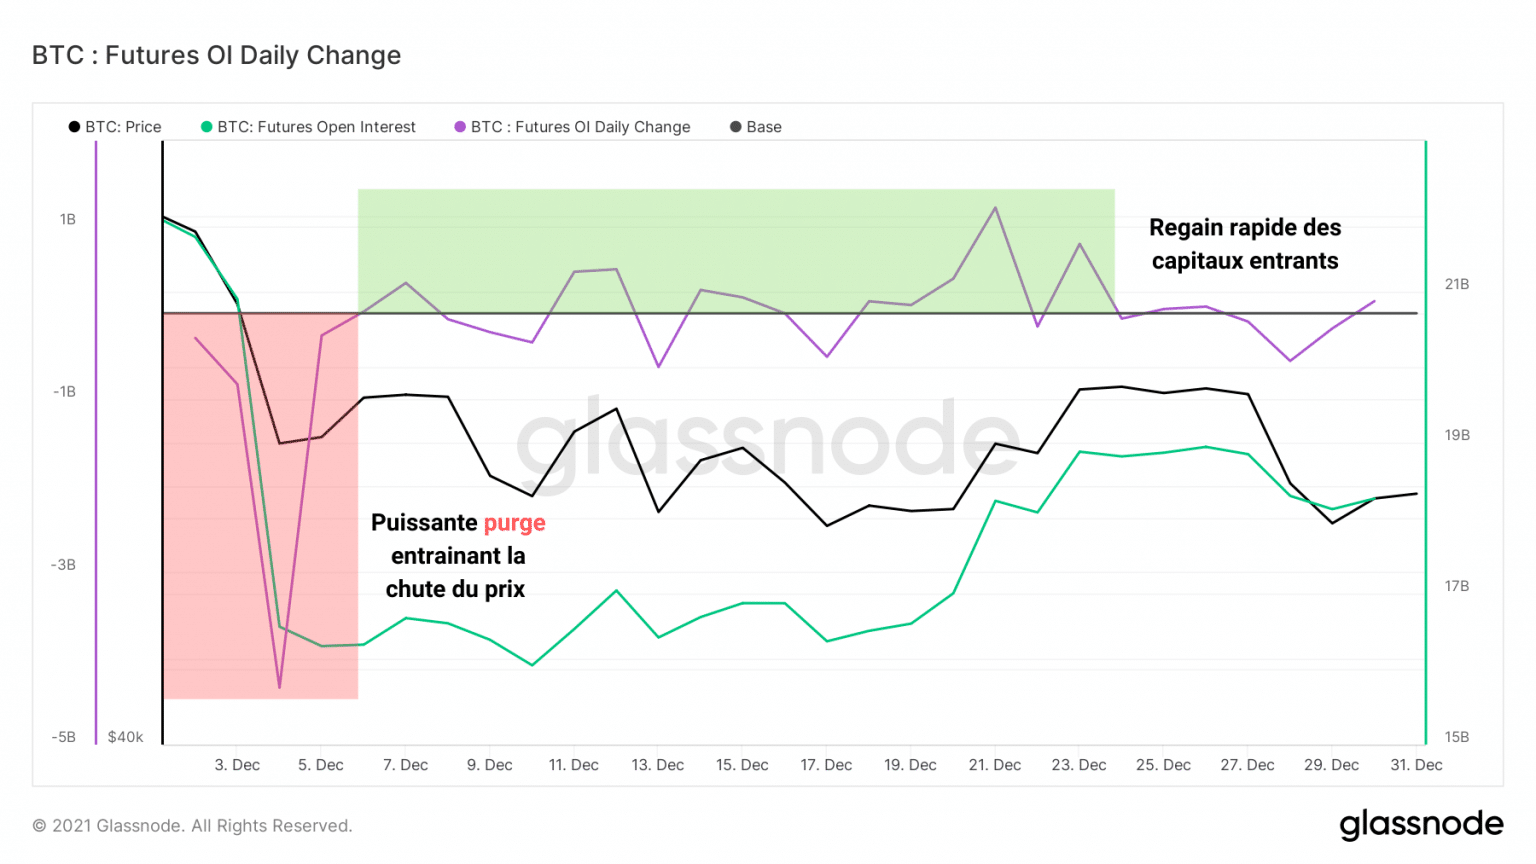
Chart of the daily variation of open interest (Source: Glassnode)
This return of interest in risk-taking is not without its accompanying backlash: the growing influence of speculation in the spot market.
Illustrating this, the dominance of open interest has again crossed the 2% threshold, the level at which the impact of derivatives markets is sufficient to cause the bitcoin (BTC) price to fall or rise, depending on the size, frequency and direction of liquidations.
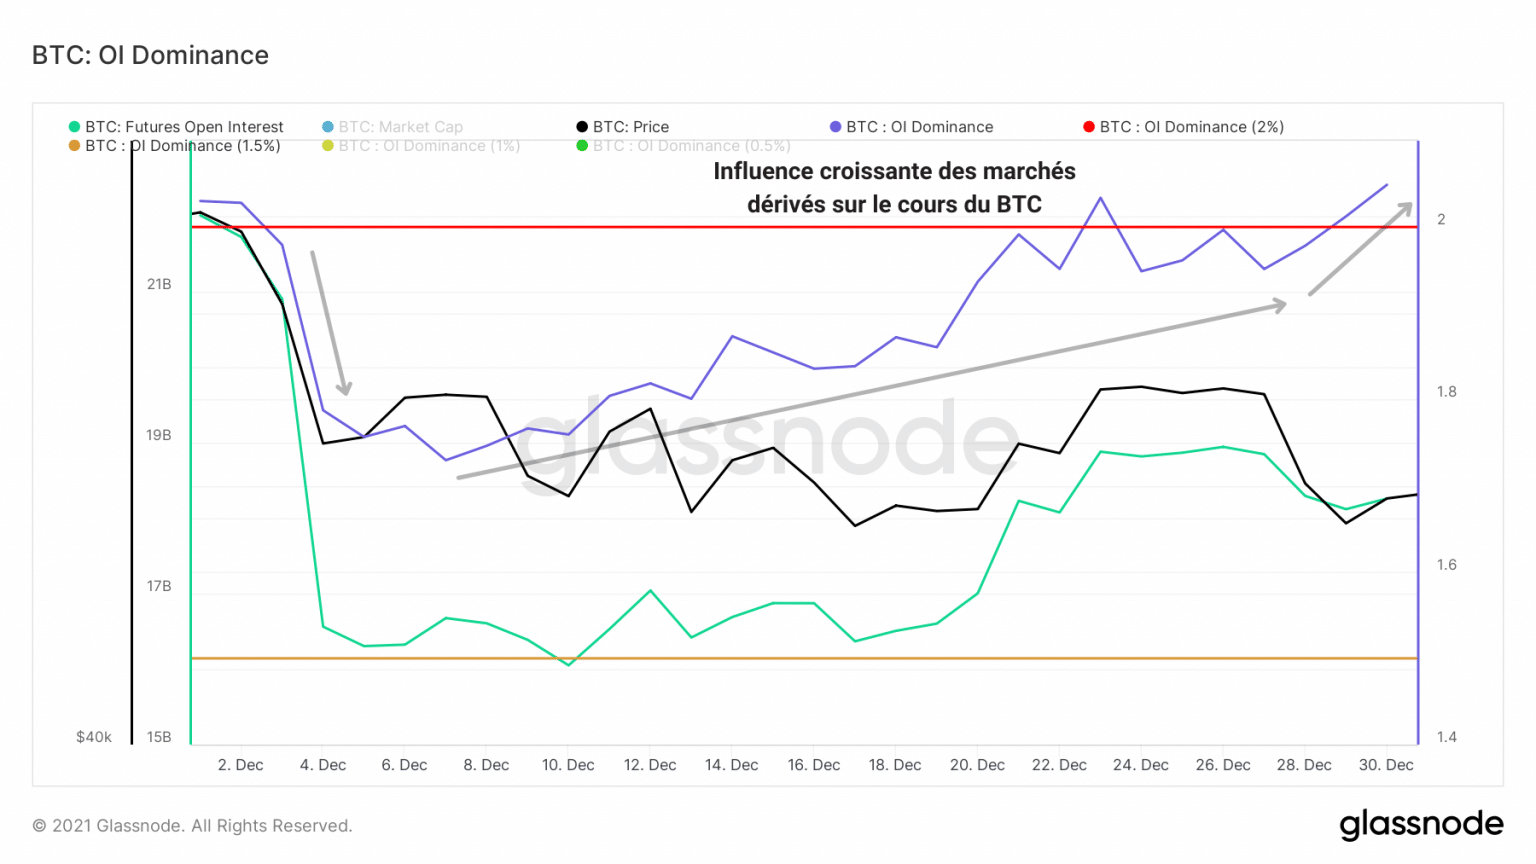
Open interest dominance chart (Source: Glassnode)
At this stage, it would be advisable to be cautious in terms of investments, as the likelihood of a new cascade of sell-offs is increasing by the day.
Moreover, it is still too early to venture a guess as to where the market will be heading at the turn of the year 2022, although the study of sell-offs will be useful in the coming weeks.
As it stands, bullish speculators have maintained a moderately dominant sell-off rate since the early December purge, while shorts are mostly unaffected.
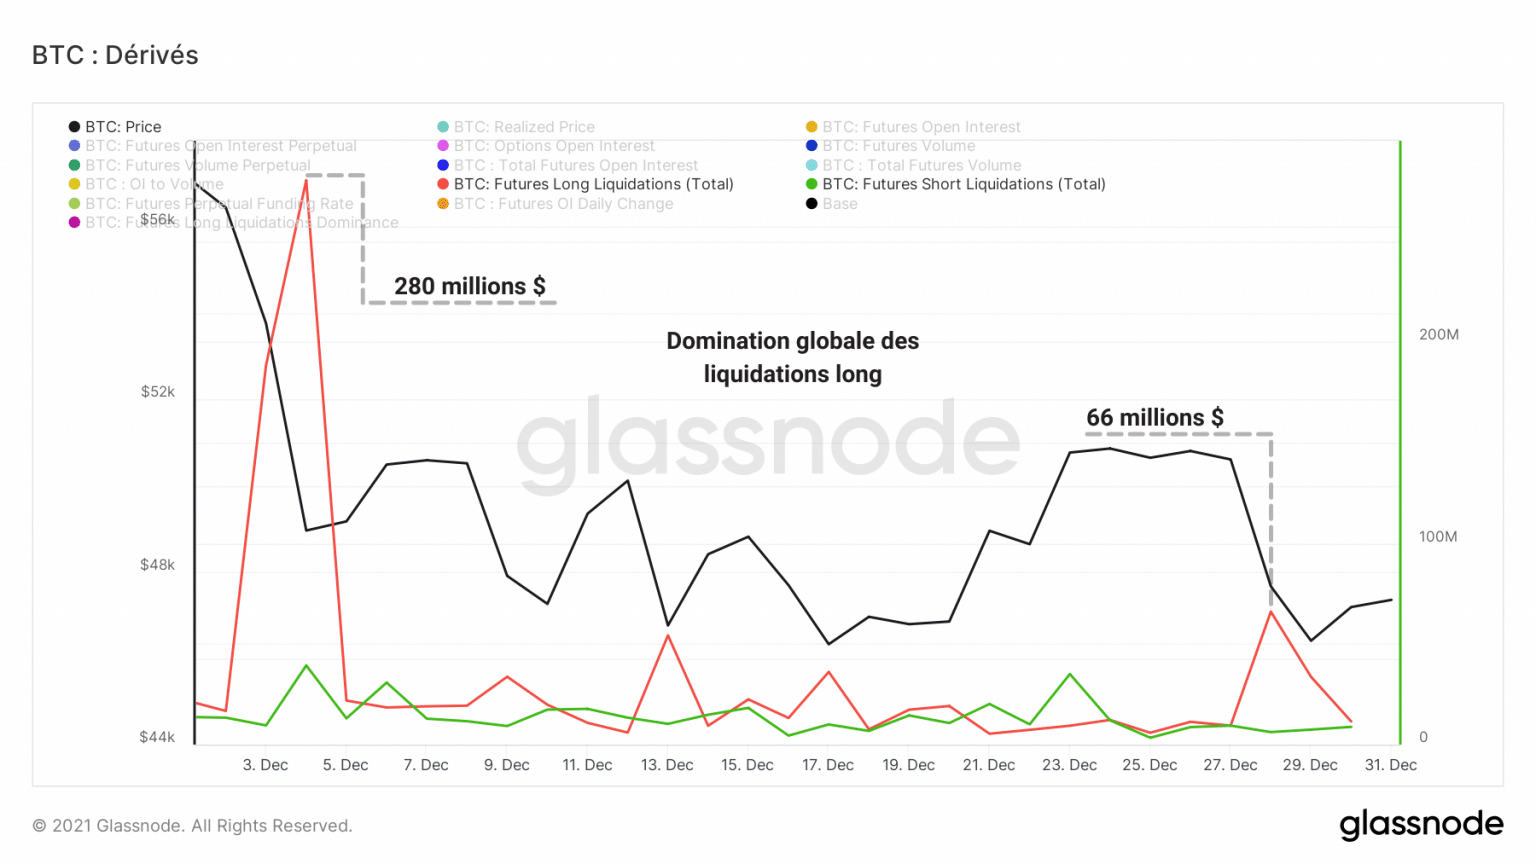
Chart of future contract liquidations (Source: Glassnode)
Add to these observations the fact that the financing rate of perpetual futures is slightly positive (☻ 0.01%) and sustained.
This implies that speculators are maintaining a moderate bullish bias but are not taking excessive risks given the current state of the market.
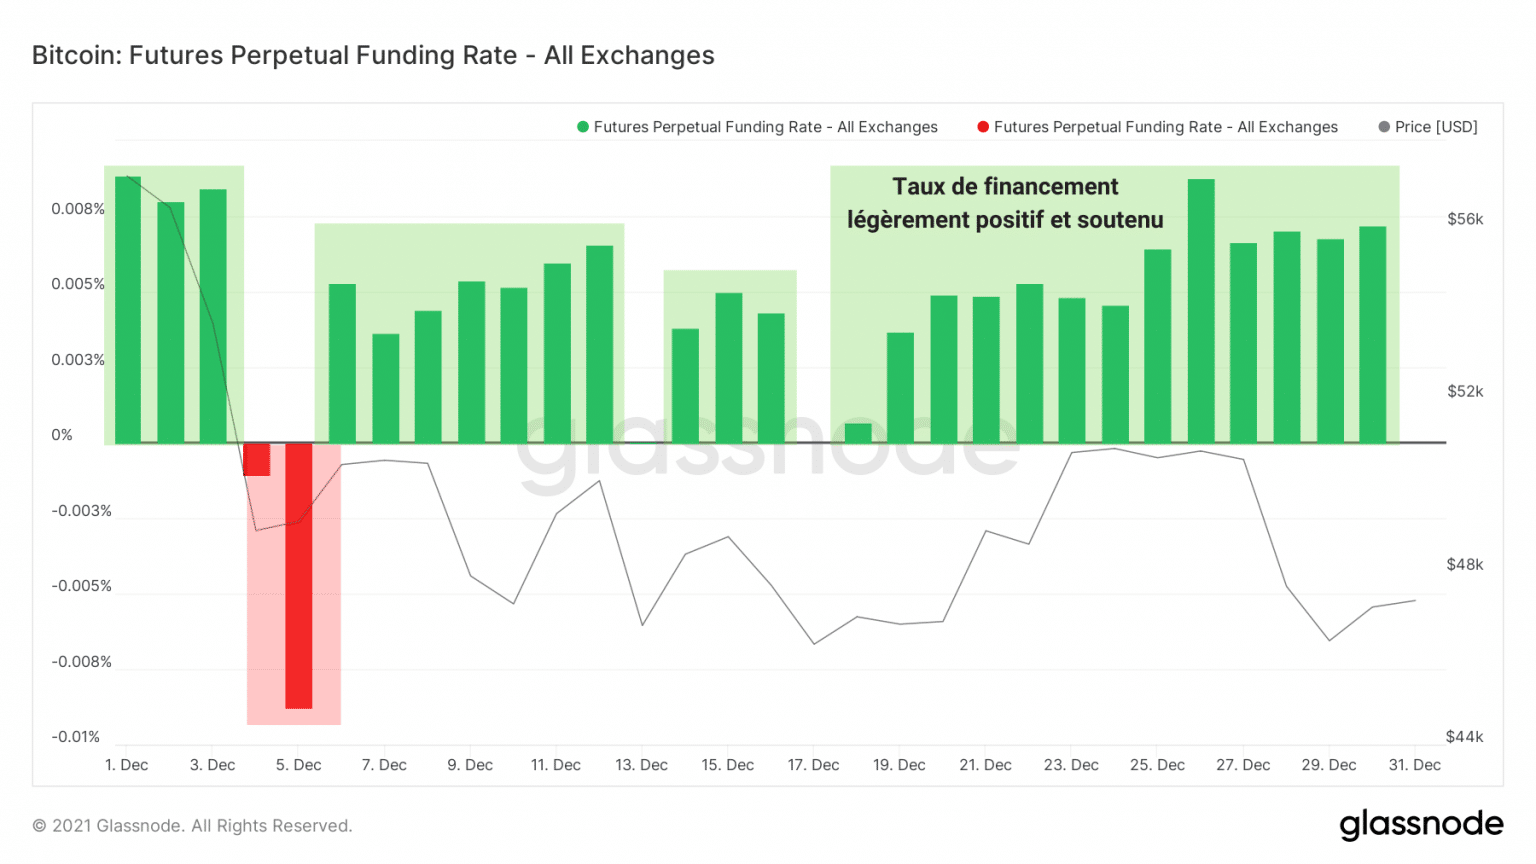
Chart of future contract financing rates (Source: Glassnode)
Corroborating this lack of aggressiveness, stablecoin-backed leverage continued to grow throughout the year.
By choosing to provide stablecoins as collateral rather than native tokens, speculators protect themselves from volatility by reducing their risk of loss (and gain).
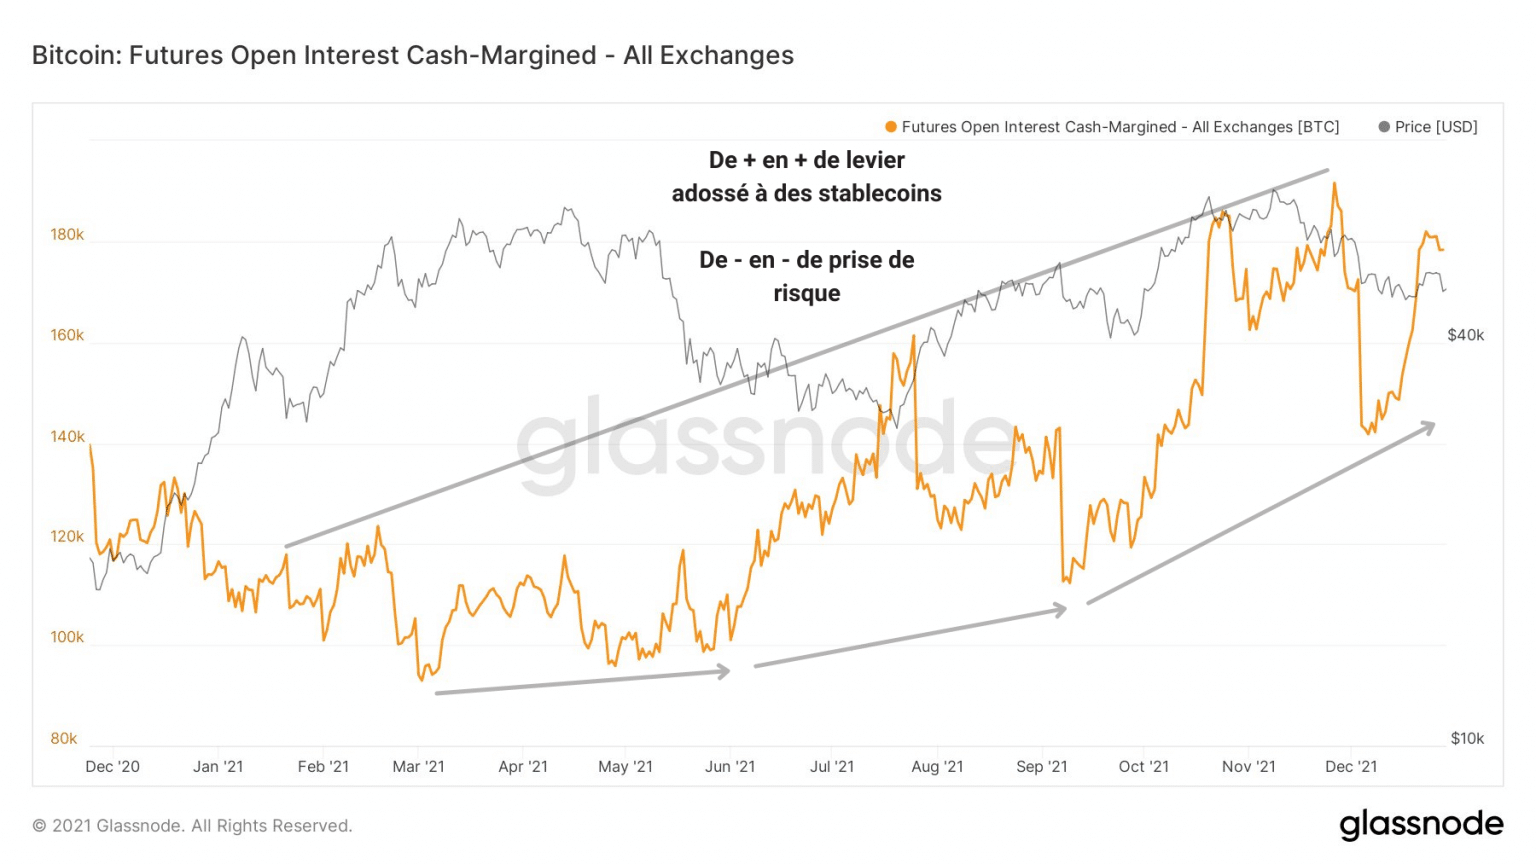
Graph of open interest backed by stablecoins (Source: Glassnode)
This trend indicates that some participants in the derivatives markets, while attracted by the idea of high profit, have opted for the lower risk card for the time being.
Traders are missing out
Let us conclude this analysis by identifying a notable change in the engagement of entities on the network over the course of this year.
Highlighted by the drastic drop in transaction fees, channel usage has greatly decreased since the May sell-off.
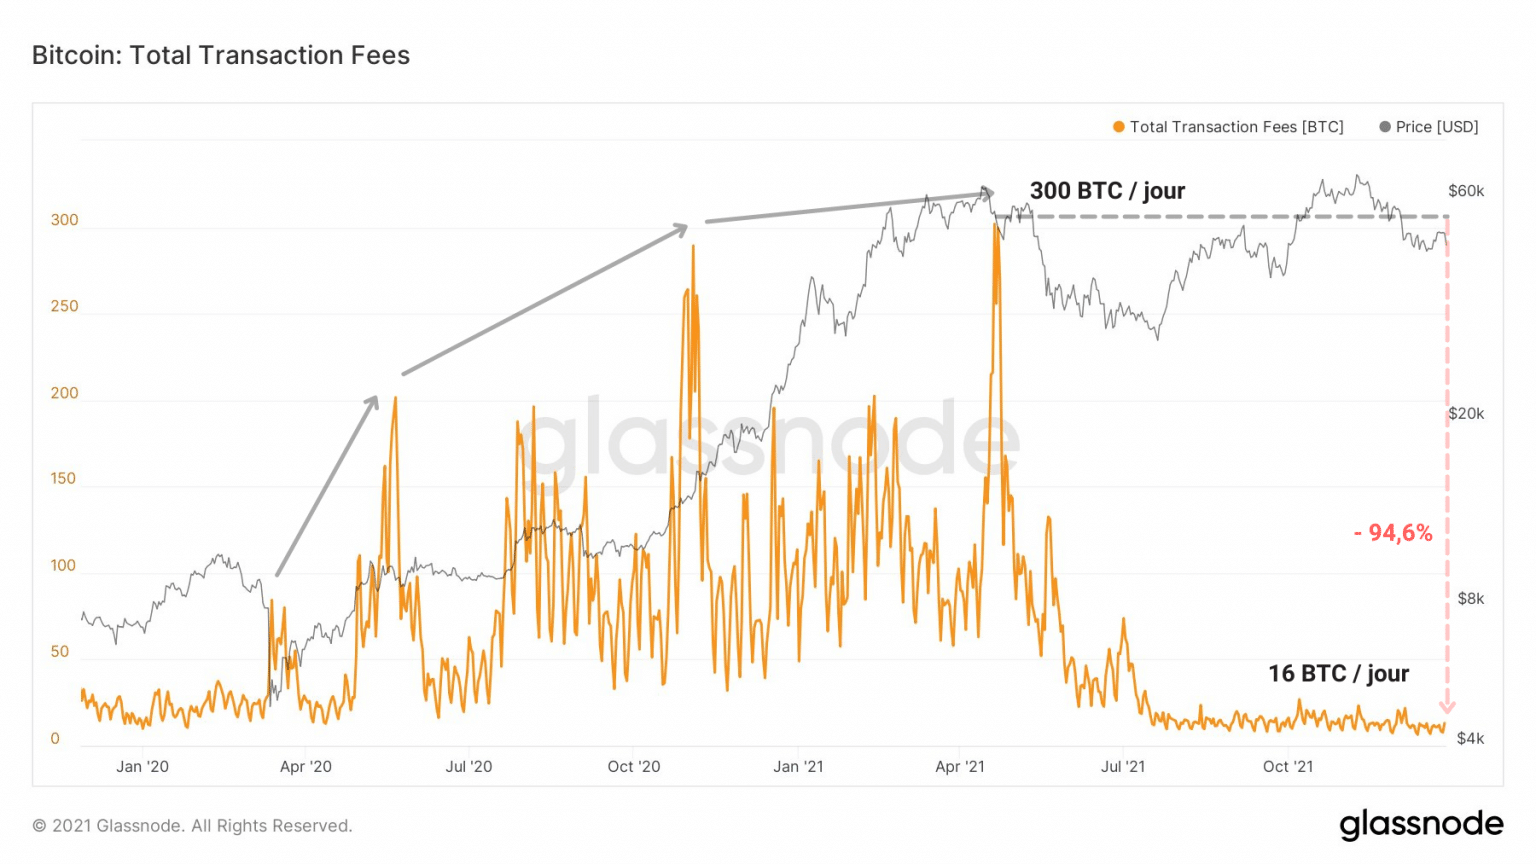
Bitcoin (BTC) Transaction Fees Chart (Source: Glassnode)
As mentioned several weeks ago, some entities, ejected during this phase of high bearish volatility, have still not recovered from this trauma.
And some will never recover. As in every capitulation, only a minority remains while the majority panics.
This behaviour can be seen clearly in the transfer volume curves of different trade sizes.
Often associated with small transaction sizes ($0 to $10), the retail players necessary for people to adopt and use bitcoin (BTC) have been missing since the spring.
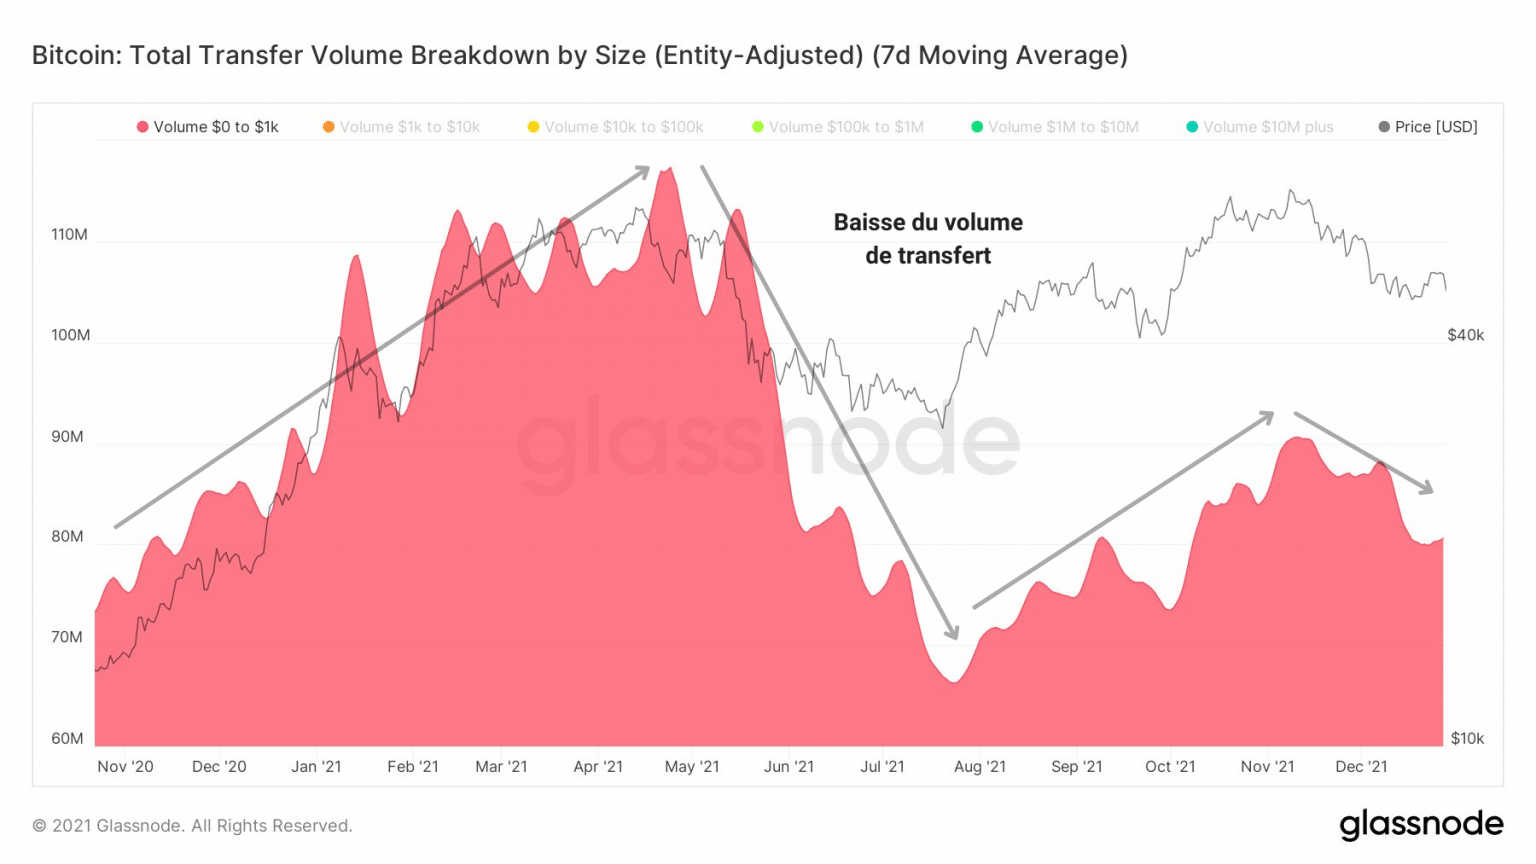
Graph of transfer volume of transactions between $0 and $1 (Source: Glassnode)
Indeed, whether it is for micro-payments (0 to 1 dollar) or small payments (1 to 10 dollars), the volume of transfers has never managed to reach its pre-May levels.
This drop in transfer volume, resulting from a lack of commitment from retailers but also from small holders, was one of the strongest bearish aspects mentioned by the community to announce an entry of the market in bear market.
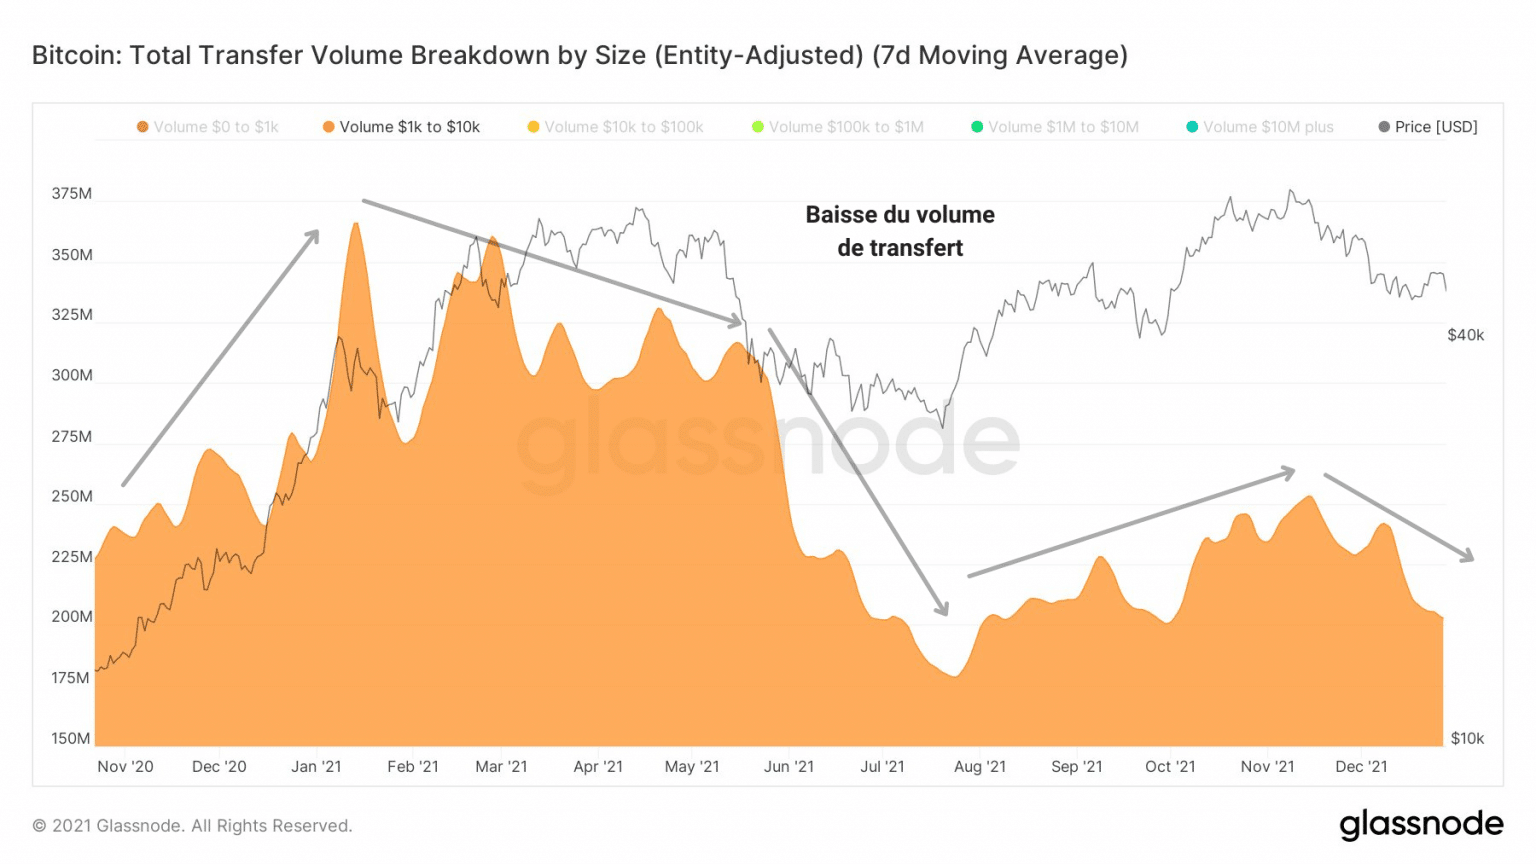
Transfer volume chart of trades between $1 and $10 (Source: Glassnode)
However, despite this drop in channel usage, it seems that large companies, investment funds and institutional players have not sounded the death knell for the current bullish phase, described by some as a macro range.
Symbolised by deals in excess of $10m, these entities have quickly recovered from the May capitulation and have returned to a similar commitment to that of early 2021.
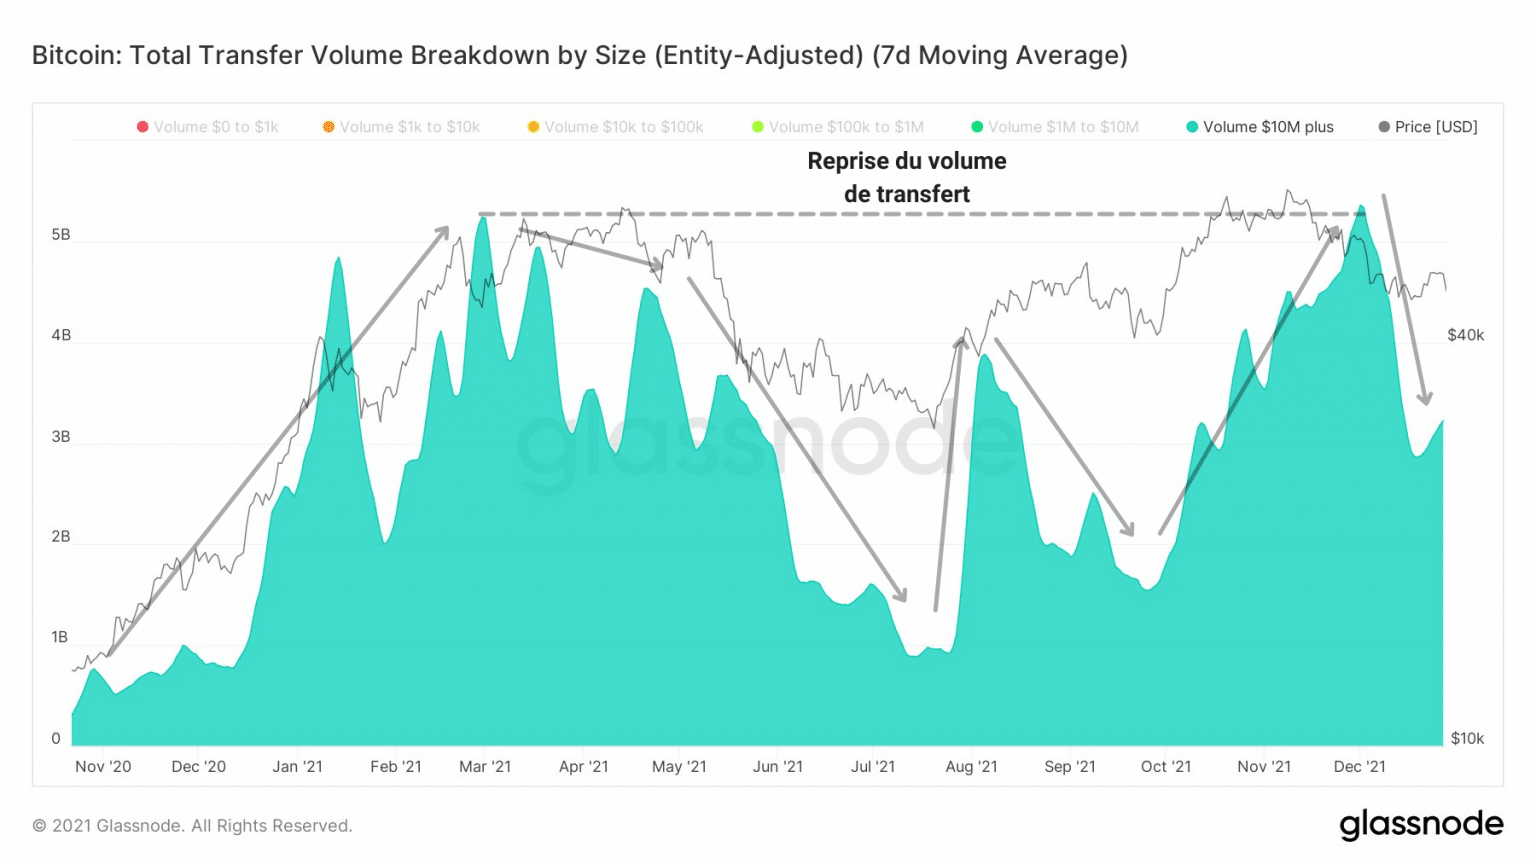
Chart of transfer volume of transactions exceeding $10 million (Source: Glassnode)
Whatever one might think, this year marks the beginning of a new chapter for bitcoin as a network and as a market.
The arrival of institutional investors, the development of derivatives markets, the advent of the Lightning Network, and the popularization of on-chain analysis have all made Bitcoin more accessible, more understandable, more efficient, and more manipulable.
Synthesis
In conclusion, trade flows have varied little over the course of this year, although the transfer of tokens from LTH to STH has been the main dynamic following the May capitulation.
The rise of the volatility and risk-bearing derivatives markets so soon after the early December purge tells us that speculators want to remain in the market for the coming months.
Finally, the lack of use of the blockchain by traders and small holders suggests that the adoption of bitcoin by individuals has a long way to go.