
Is the Bitcoin (BTC) correction coming to an end? Despite a controlled distribution of holders over the long term and the recent waves of losses made by the market, strong spot demand remains as the derivatives markets influence the Bitcoin price less. On-chain analysis of the situation
Bitcoin consolidates above a hotspot
Following the new wave of sell-offs, the price of Bitcoin (BTC) is consolidating in a range between $52,000 and $46,500, supported by the 200 daily moving average (200 sMA daily).
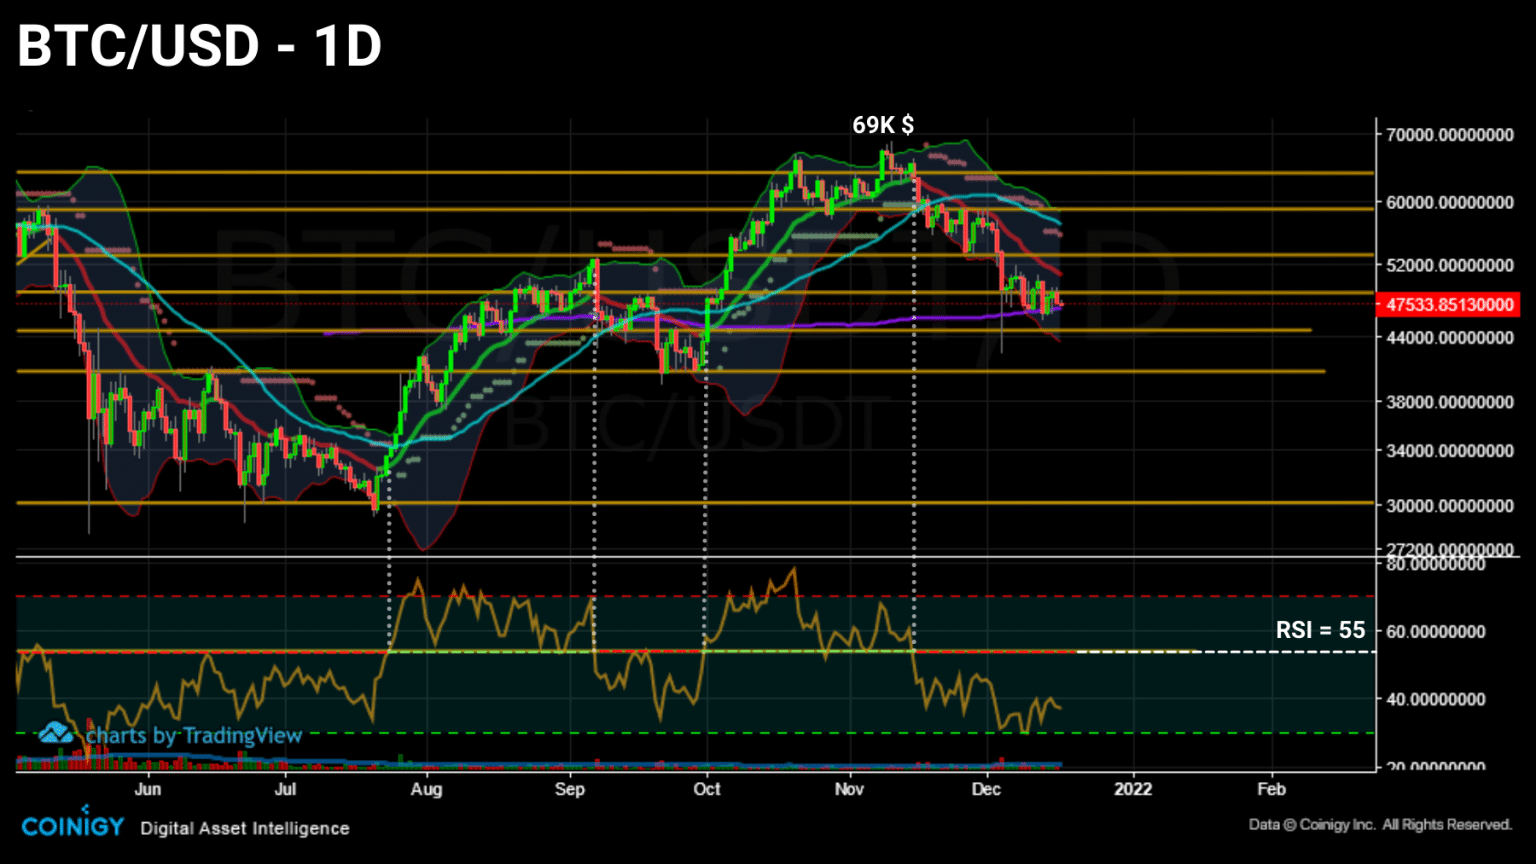
Daily chart of Bitcoin (BTC) price (Source: Coinigy)
Now above a moderate support area, Bitcoin (BTC) is under two large volume clusters that could slow its price rise.
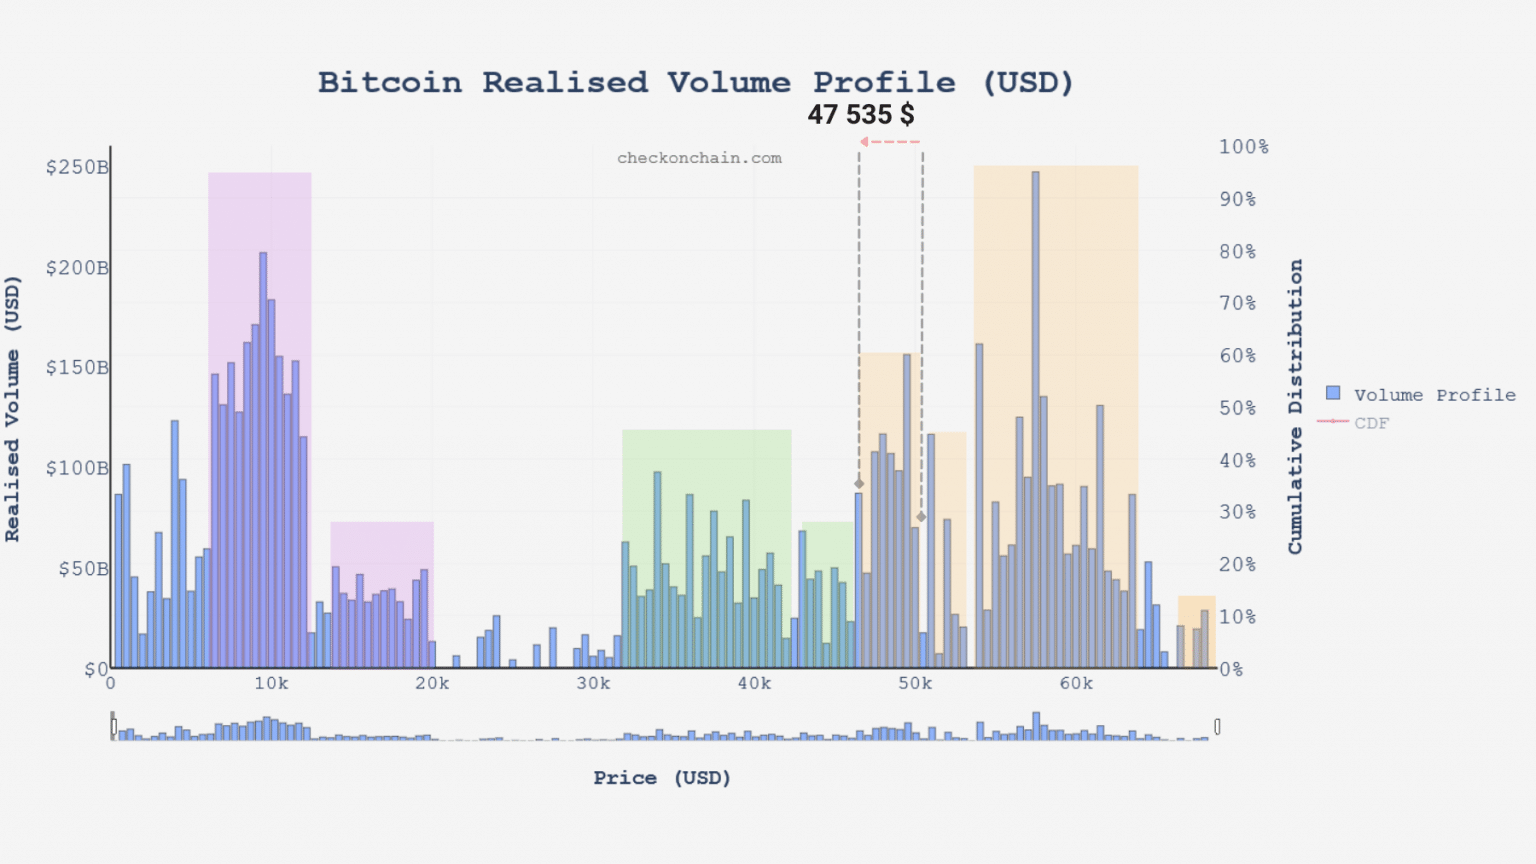
Realized volume chart of Bitcoin (BTC) (Source: checkonchain.com)
This week we will assess the dynamics of LTH supply, spot demand and spending behavior to determine if the market structure favors a bullish or bearish bias.
Long-term investors are gradually distributing
Let’s begin our study by examining the behavior of entities holding their BTC for more than 155 days: the LTHs.
Having formed a high in November of 13.2 million BTC, the supply held by this cohort has reached the pivot point at which a distribution phase can potentially begin.
Following successive liquidation cascades in November and December, these seasoned investors have spent their BTC minimally and gradually, without giving strong signs of leaving the market.
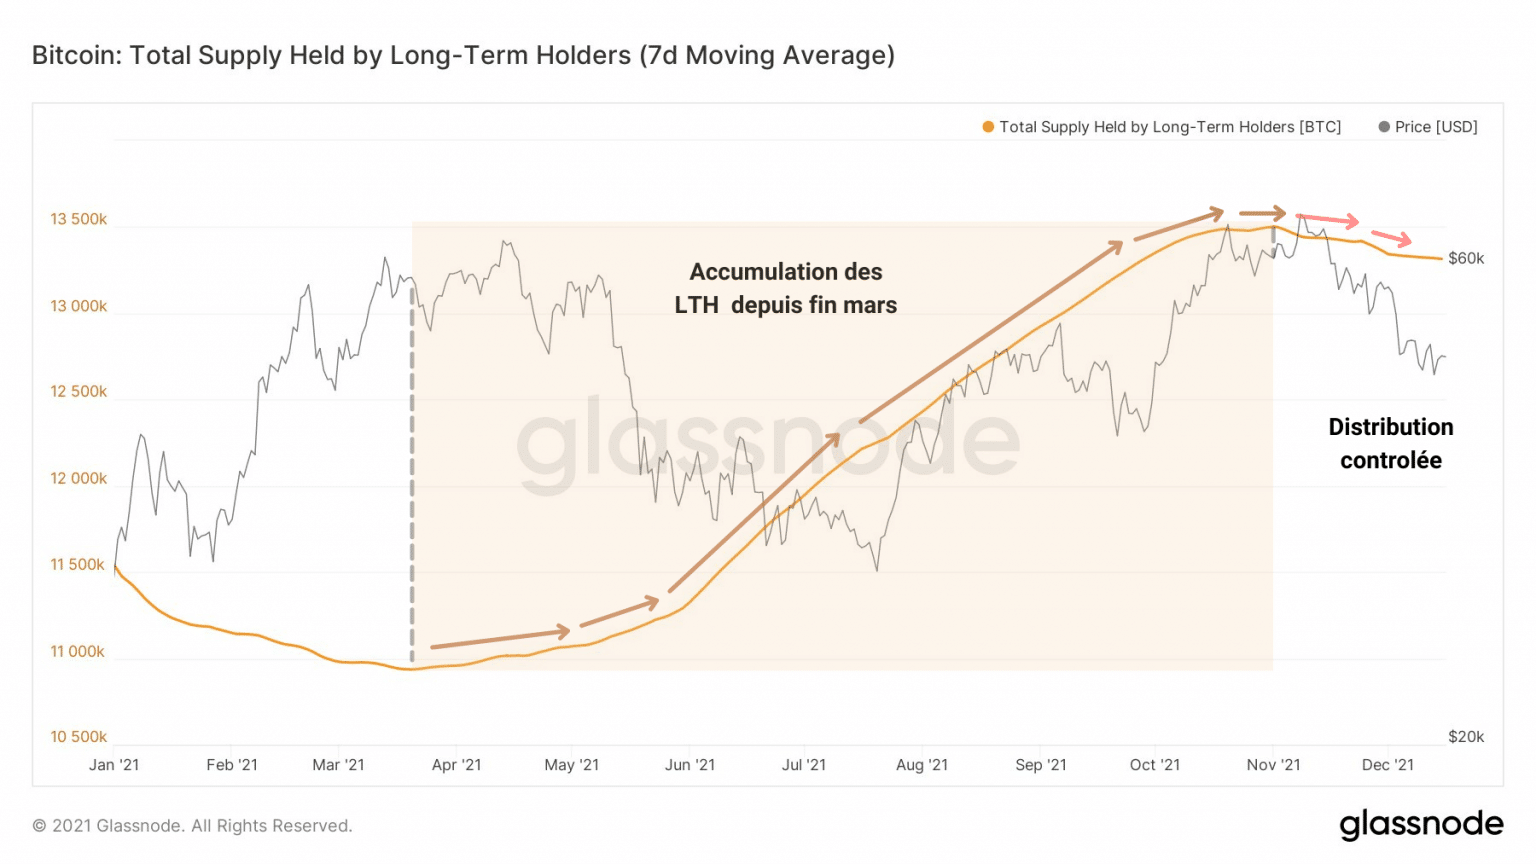
Graph of supply held by LTH (Source: Glassnode)
This controlled distribution is evidence of the paradigm shift that was highlighted last month: Bitcoin is being considered as a store of value by more and more entities.
As a result, it is becoming an illiquid asset, migrating from exchanges to cold storage as demand increases.
Confirming this, the net change in LTH position shows a modest distribution from ATH, a sign that many are waiting for a better valuation of BTC before agreeing to part with it.
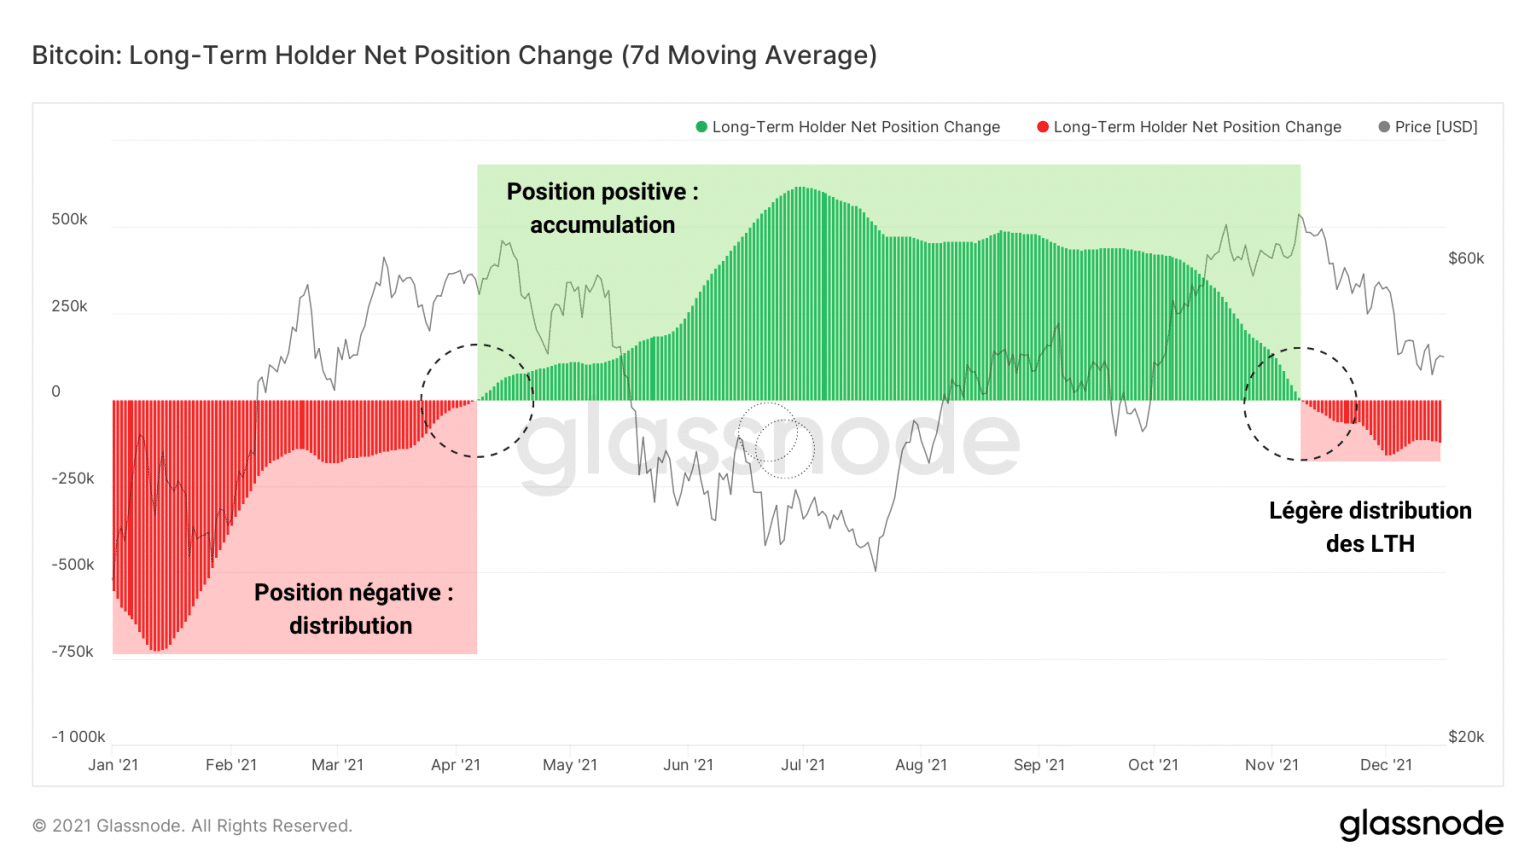
LTH net position chart (Source: Glassnode)
The opposite dynamic can be identified by grouping all Bitcoin addresses with a non-zero balance by weight:
- Fish (from 0.01 to 1 BTC) ;
- Sharks (from 10 to 100 BTC);
- Whales (1,000 BTC and above).
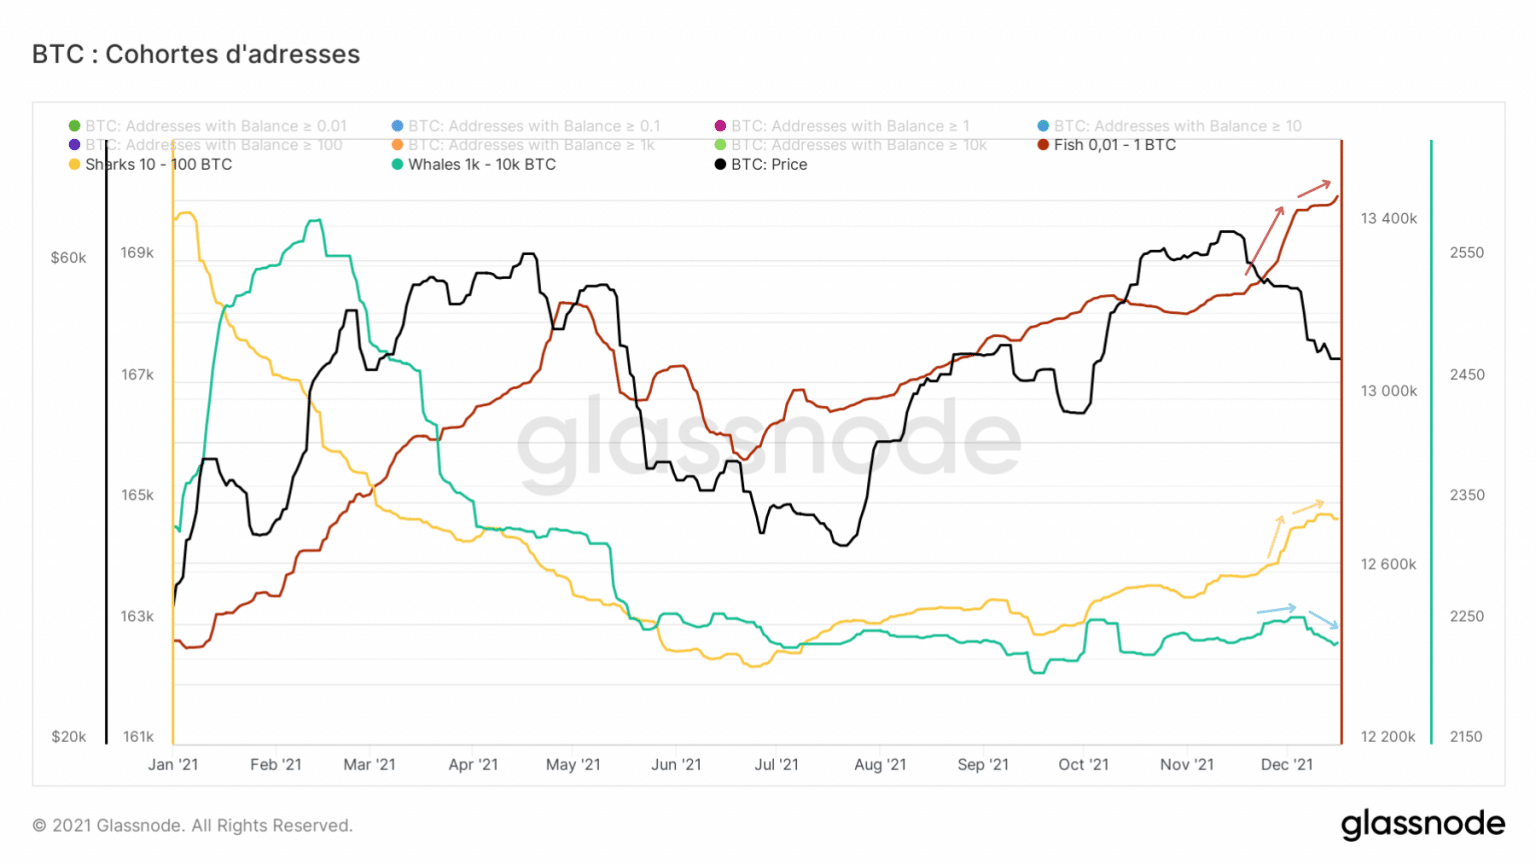
Graph of BTC held by bitcoin address groups (BTC) (Source: Glassnode)
While this chart does not shed light on the direct behaviour of market entities, it is a relevant proxy for the fact that small holders have accumulated a lot of BTC during the recent correction.
Indeed, as suggested by the evolution of the supply held by STHs, short-term investors have resumed a buying behaviour after a long distribution phase.
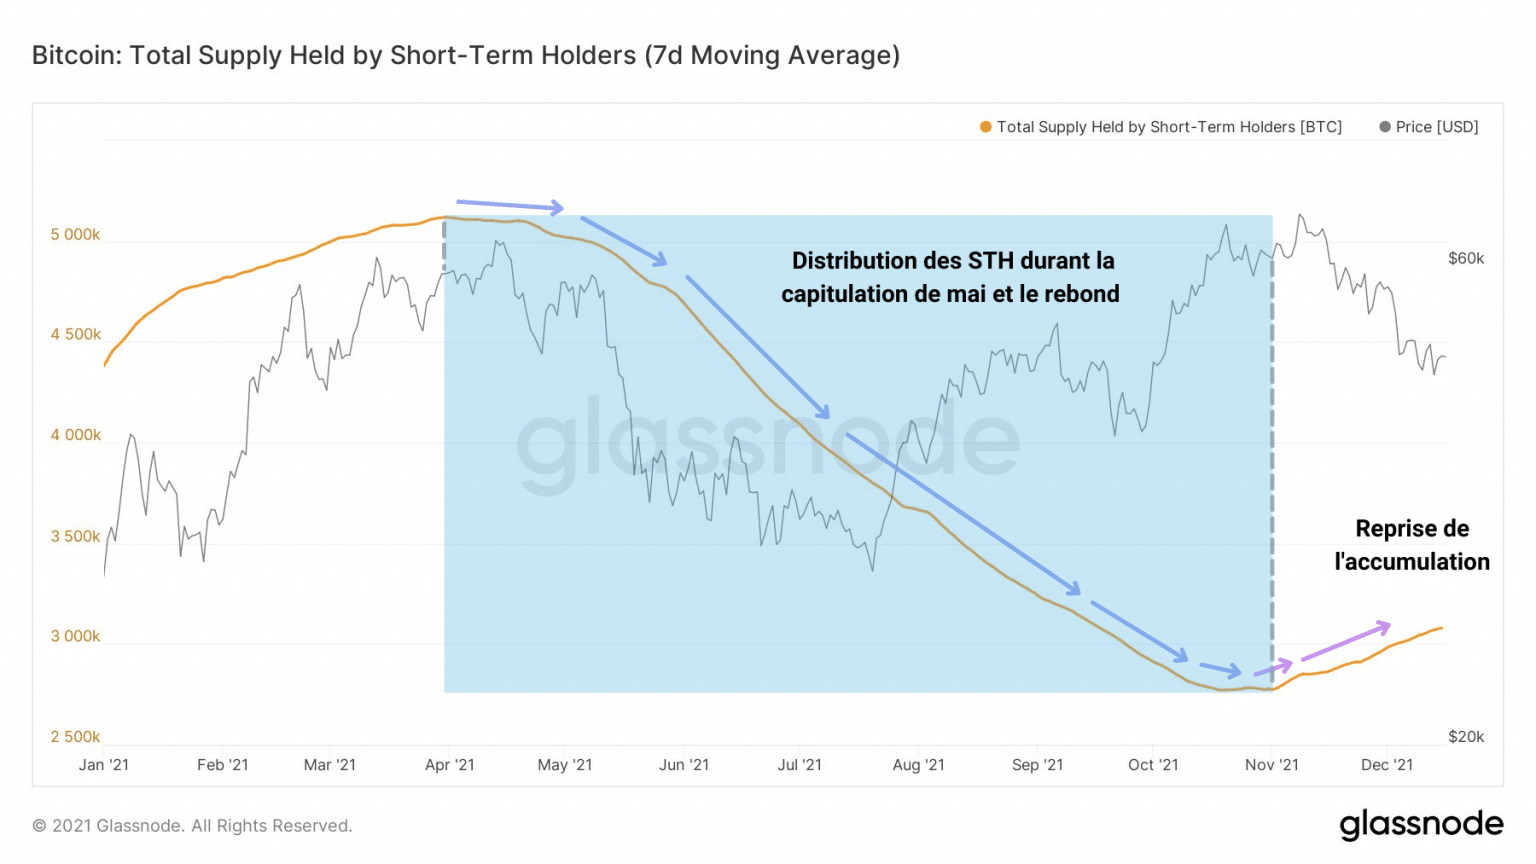
Graph of supply held by STH (Source: Glassnode)
In sum, we could be on the verge of experiencing a new transfer of supply in circulation, a sign of a continuation of the bull run if STH demand is able to fill the selling pressure induced by LTH’s profit-taking.
Sustained spot demand
In parallel, spot demand continues to perform well, with exchange reserves maintaining a structurally downward trend since March 2020.
Note however that around 40,000 BTC were punctually deposited on the exchanges over the past week
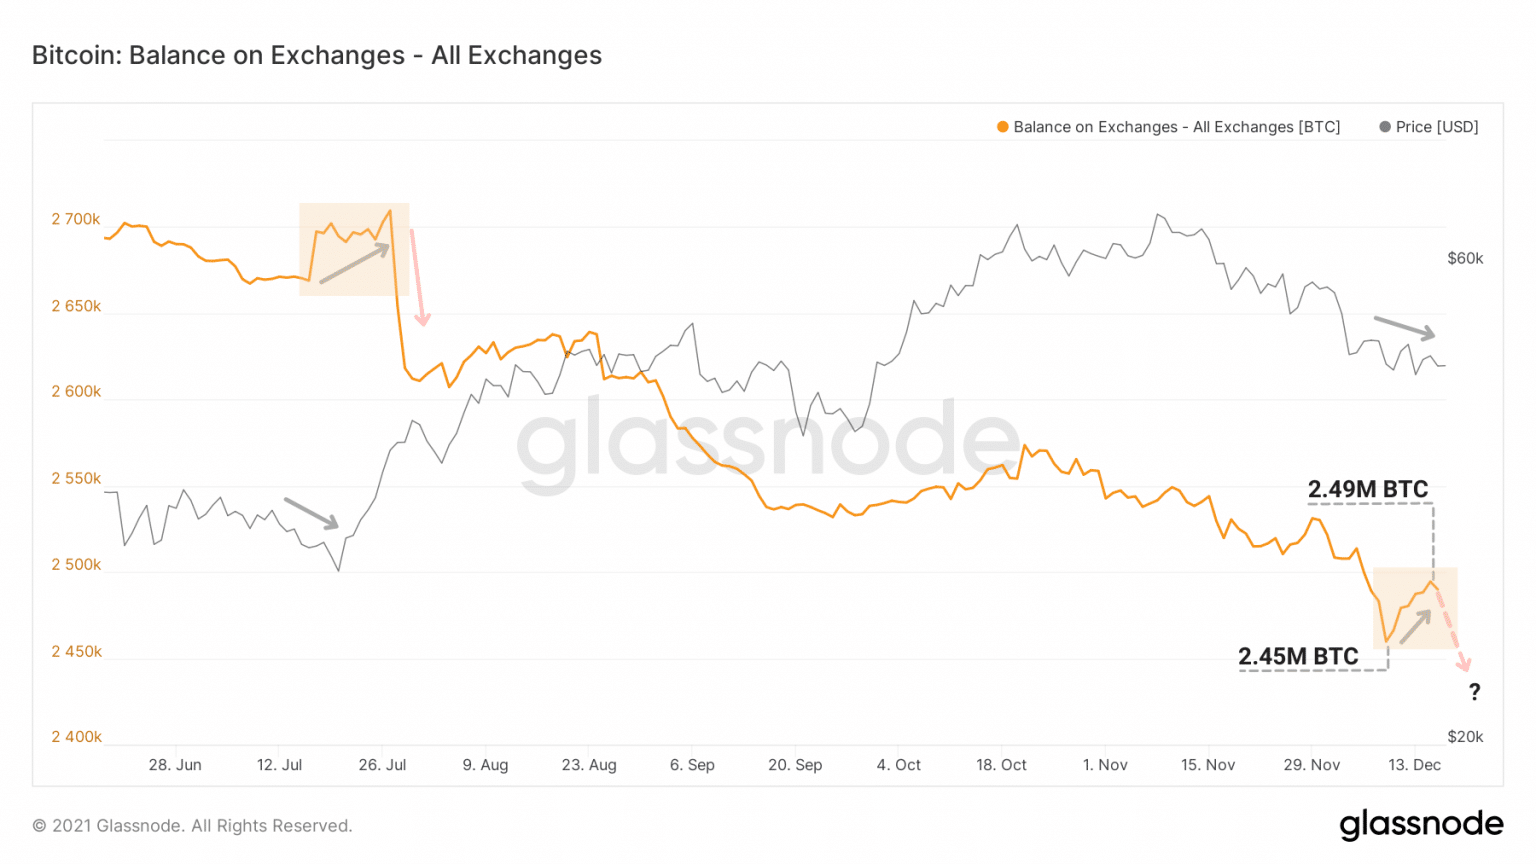
Exchange Reserves Chart (Source: Glassnode)
It is not surprising to see BTC flowing into trading platforms during correction periods.
This behaviour indicates the willingness of some players to be prepared to sell some of their capital should the market show significant indicators of weakness.
While many have not yet divested themselves of their BTC, some participants are nevertheless cautious.
This can be clearly seen in the net transfer volume of trades: after a large withdrawal phase in the last few months, deposits dominated the flows from December 10 to 15.
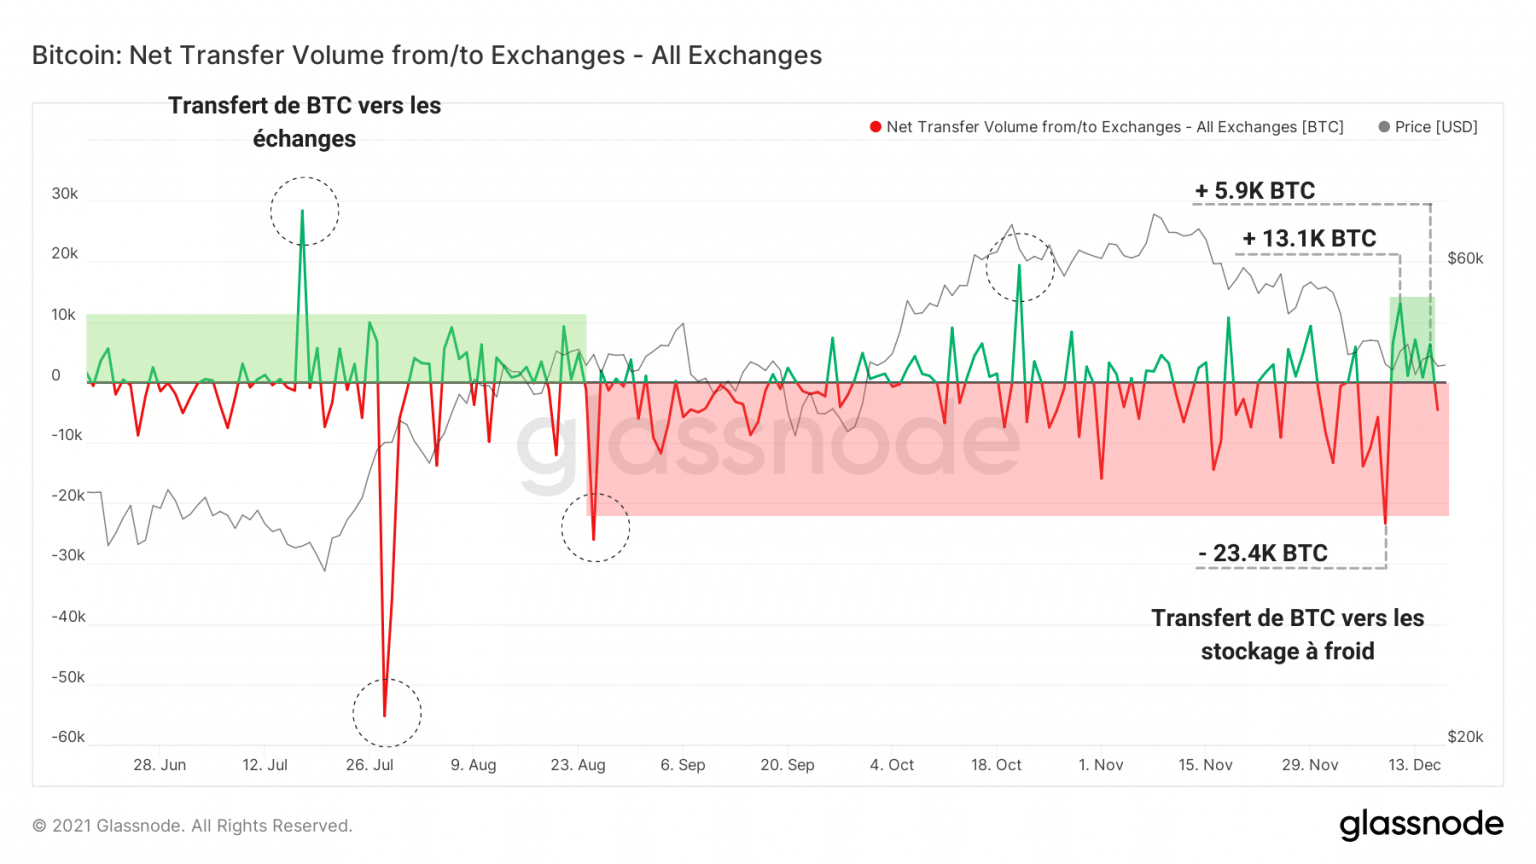
Net trade flow chart (Source: Glassnode)
However, these inflows do not constitute an established and verifiable trend for the moment. It will be appropriate to monitor this dynamic closely if it becomes more pronounced.
On the other hand, it is very encouraging to see the fervor with which the Canadian Purpose Bitcoin Spot ETF is accelerating its accumulation.
Over the past 14 days, the total amount of BTC acquired by this institution has increased by 18.8% to 30,000 BTC.
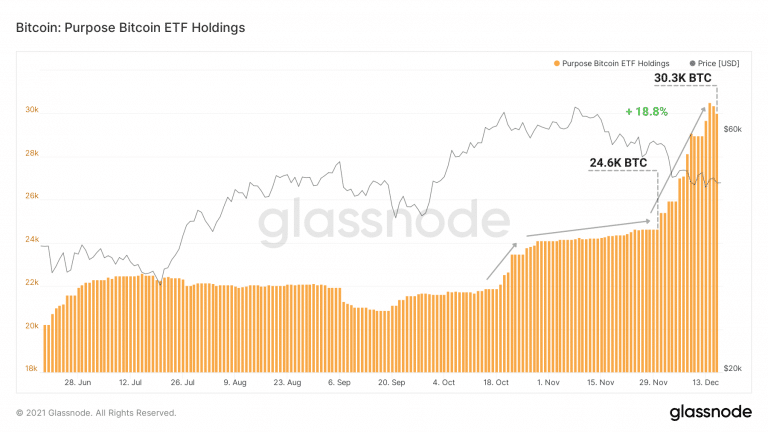
Graph of supply held by Purpose ETF (Source: Glassnode)
While many institutional investors are still missing, the buying pressure induced by spot demand is far from negligible and sends a strong signal that bitcoin is attracting more and more capital despite the correction.
Less and less realized losses
Let’s turn to the financial health of the market. The aSOPR is holding close to its neutral zone, a sign that the market is making small losses overall.
As mentioned by superswell, it would be desirable to see this indicator move back above this threshold to test it as support.
This would signal a bullish continuation of the market if LTHs decide to take profits in the strength of a STH demand supported rally.
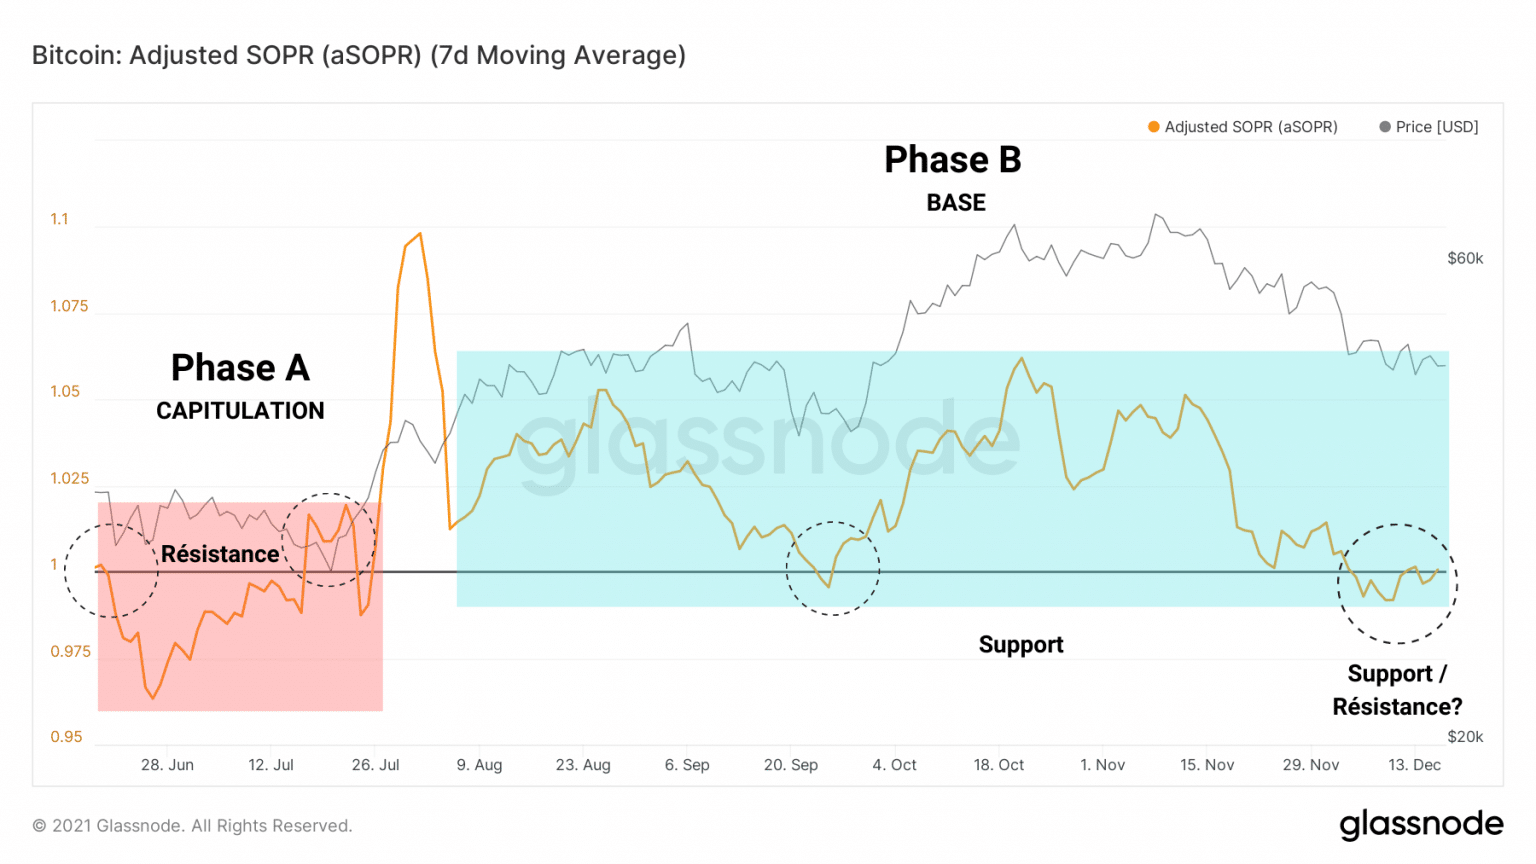
Bitcoin (BTC) aSOPR Chart (Source: Glassnode)
The fact that aSOPR has remained so close to 1 is partly due to the fact that fewer losses have been made in the last few days.
While some participants have continuously sold their BTC at a loss since the ATH, the increase in realized losses has put significant selling pressure on the bitcoin price, combined with the liquidations seen since December.
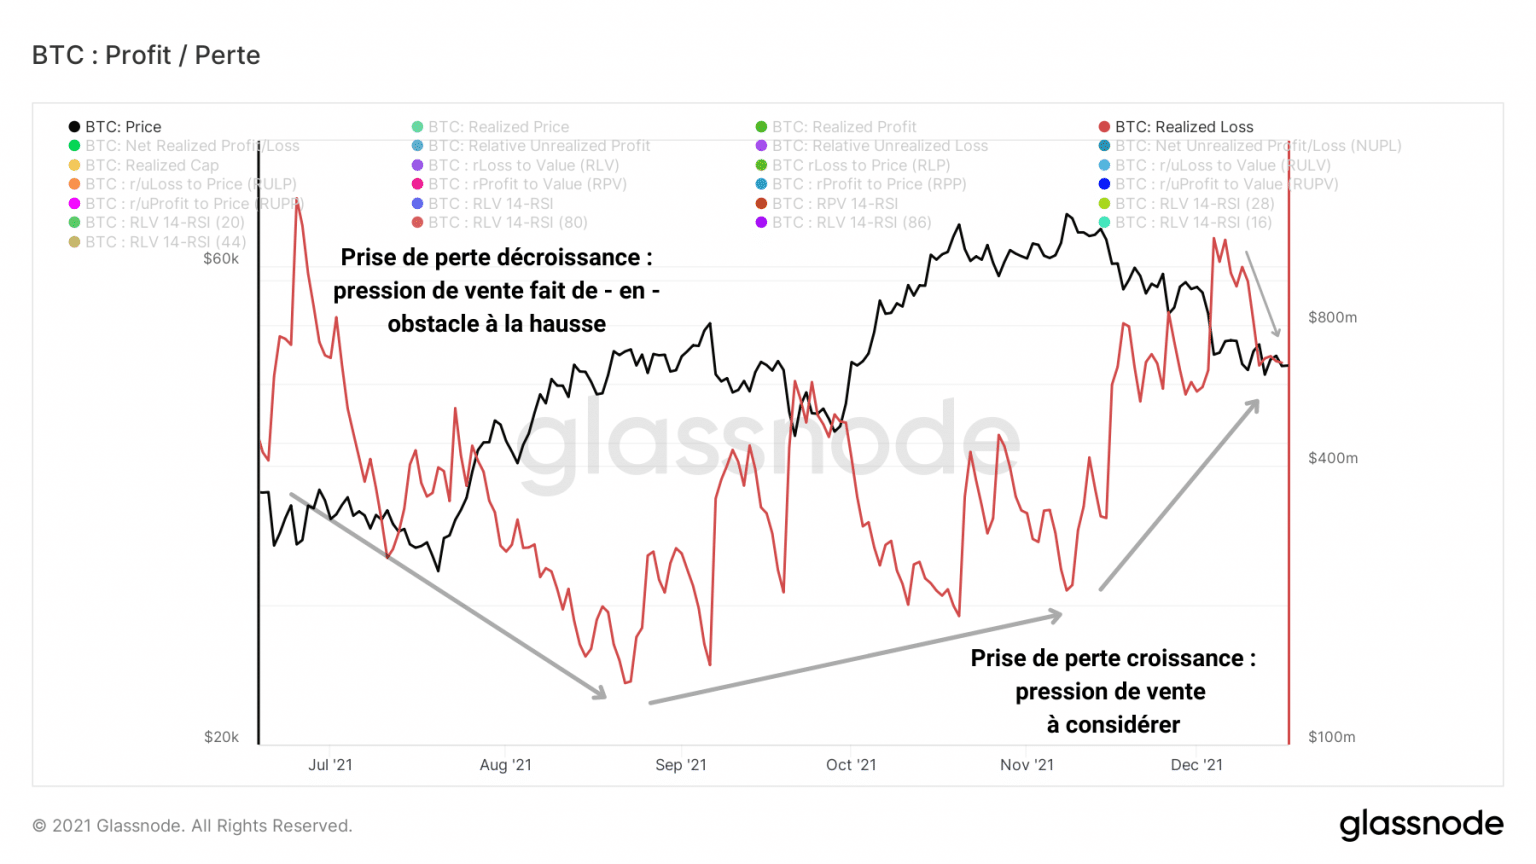
Graph of bitcoin (BTC) realised losses (Source: Glassnode)
A desirable sign of recovery would be to see this curve decline over the next few days, a sign that confident participants are refusing to take more losses despite bearish price action in the short term.
Moreover, the RLV ratio, which weights realised losses by the realised value of the market, indicates that the pain suffered by investors is less than technical price analysis would suggest.
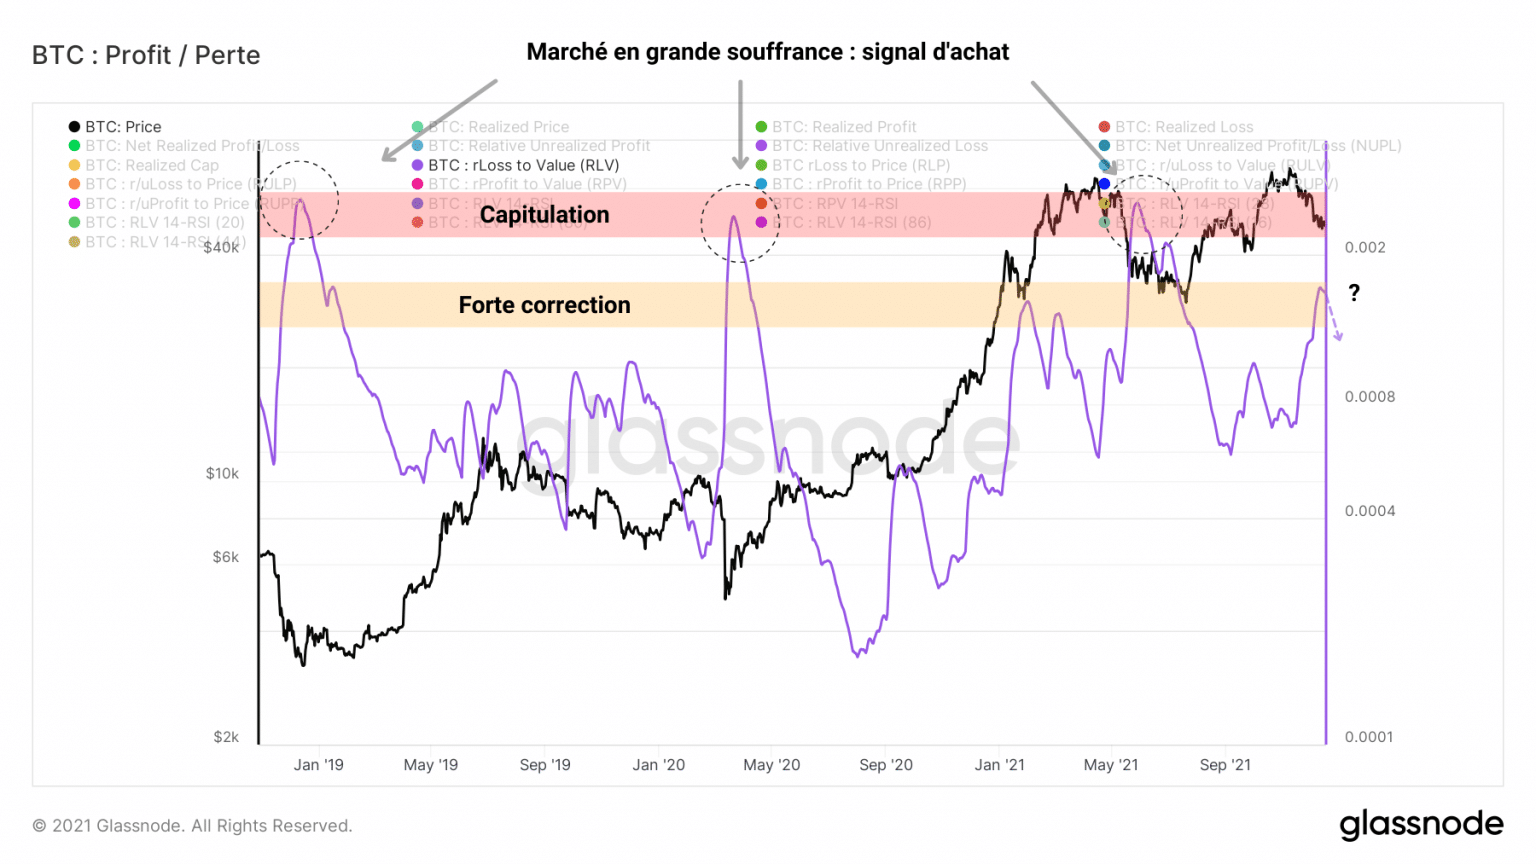
Graph of Bitcoin (BTC) RLV (Source: Glassnode)
While the price holding below $51,000 may be of concern to many, we cannot at this point consider the market to be in a state of capitulation.
In fact, this structure could allow BTC to form a healthy base before resuming its rise.
A beneficial purge
Corroborating this thesis, successive waves of liquidations have succeeded in diminishing the influence of derivatives markets on the bitcoin price.
Inspired by Permabull Nino, open interest dominance measures the ratio of total funds allocated to future contracts to the market capitalization of BTC.
Thus, the lower this ratio, the more the market is driven by spot demand. Put another way, with less open interest, the market can actually begin an organic and healthy trend in any direction.
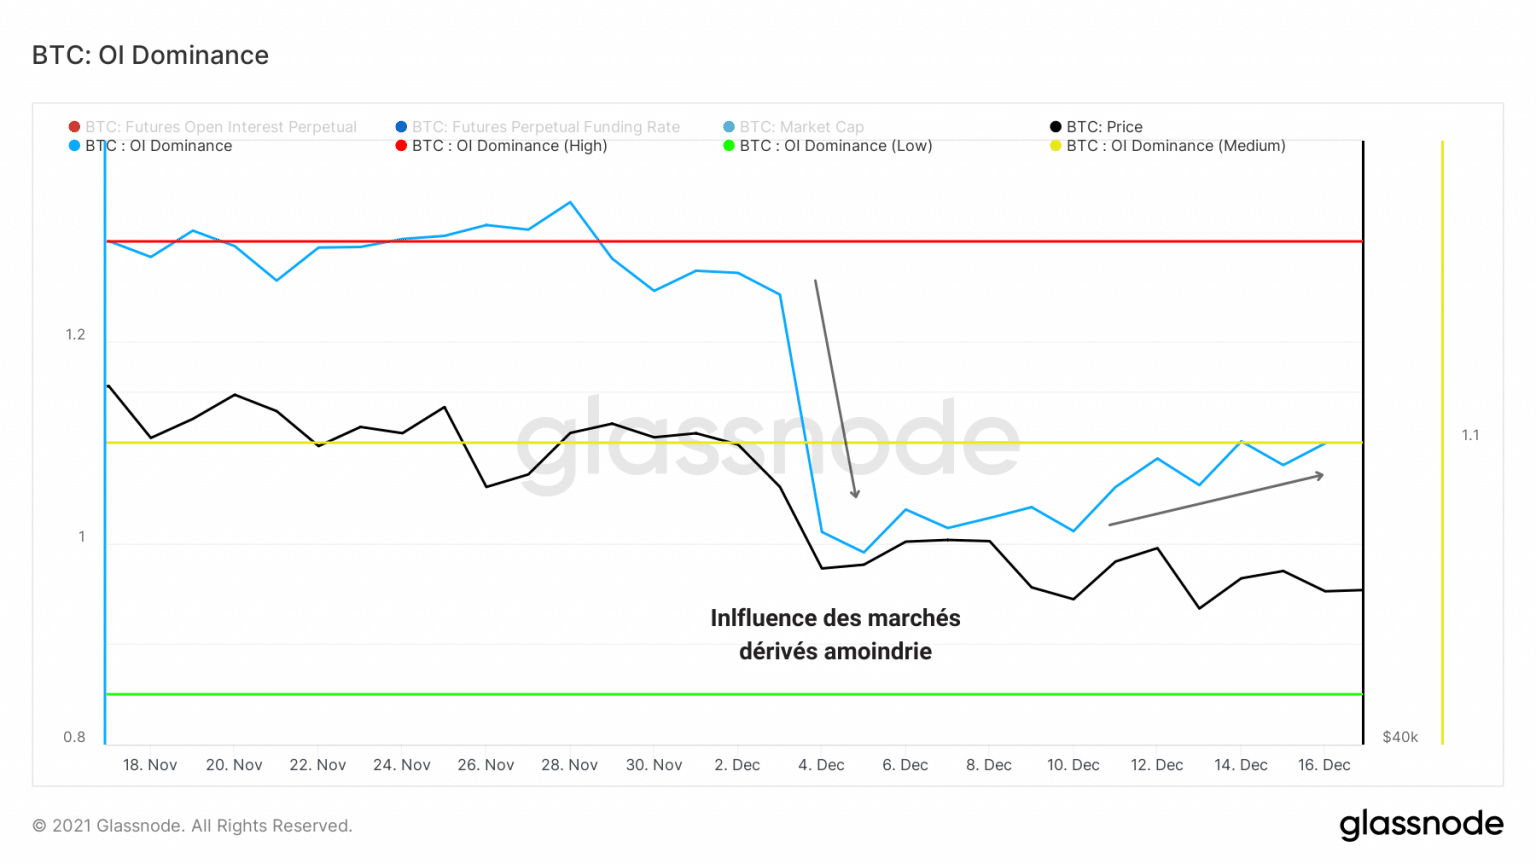
Open interest dominance chart (Source: Glassnode)
Despite the recent price drop, the overall on-chain picture remains optimistic and suggests a lateralization of the price before a decision is made by participants.
It should be noted, however, that the stress in the traditional markets could have a significant impact on the price of bitcoin, as its correlation with the US financial indices is currently high.
Summary of this on-chain analysis
Finally, now is not the time to worry about a long-term trend reversal, although we should allow ourselves to consider a pessimistic scenario should it arise
Following the signs identified last week, long term holders are beginning a soft distribution, filled by sustained spot demand.
After the decline in realized losses and the influence of futures on the bitcoin (BTC) price, the market seems ready to resume healthy growth if the selling pressure allows for a breakout from the top of the current range.
This year-end will be driven by the clash of buying and selling forces. Let’s remain cautious until the market chooses a clear direction