
This week marks a welcome lull following the volatility events of May and June 2022. Profitability has halved since the November 2021 ATH, leading to widespread financial distress, while the network is operating at a low level and lacking in participant engagement. On-chain analysis of the situation
Bitcoin: the calm after the storm
The Bitcoin (BTC) price is back above $20k and stabilizing, providing a period of rest following the high volatility of the past few weeks.
Now at a local low, the current bear market is experiencing a significant lack of on-chain activity, a classic bear market symptom.
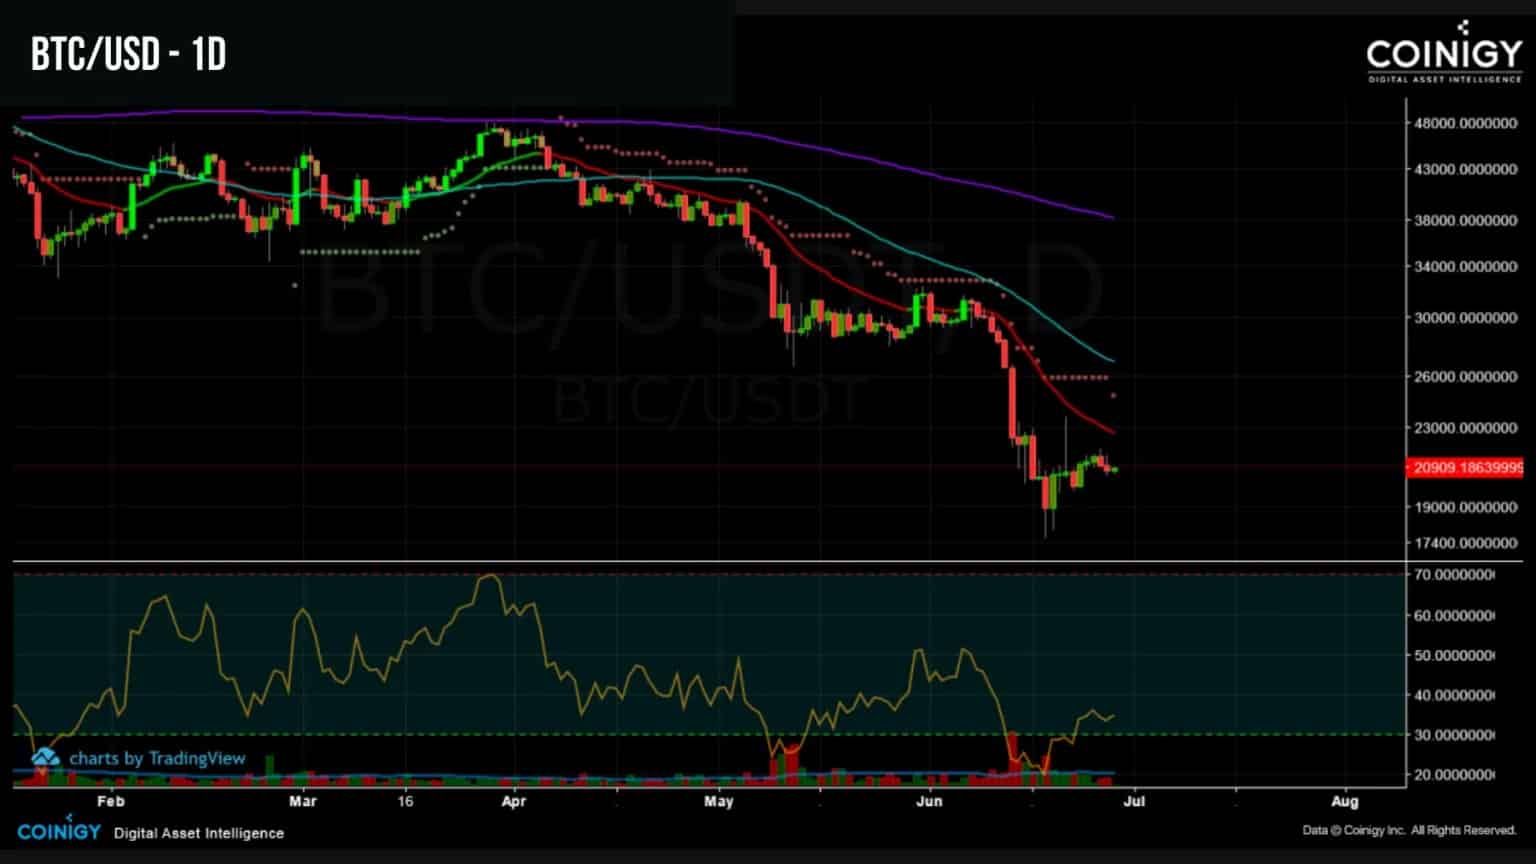
Figure 1: Daily Bitcoin (BTC) price
This week we will be evaluating:
- the profitability status of the network;
- the purging of excess leverage in the derivatives markets;
- the lack of onchain activity and economic engagement.
Significantly reduced profitability
Given the selling pressure on the BTC price in recent months, it is appropriate to note that the network’s profitability is close to the 50% mark at this stage of the bear market.
With an aggregate profitability of 54.3%, BTC circulating on the Bitcoin network remains mostly in profit despite the recent purge and is a testament to the growing resilience of participants over the cycles.
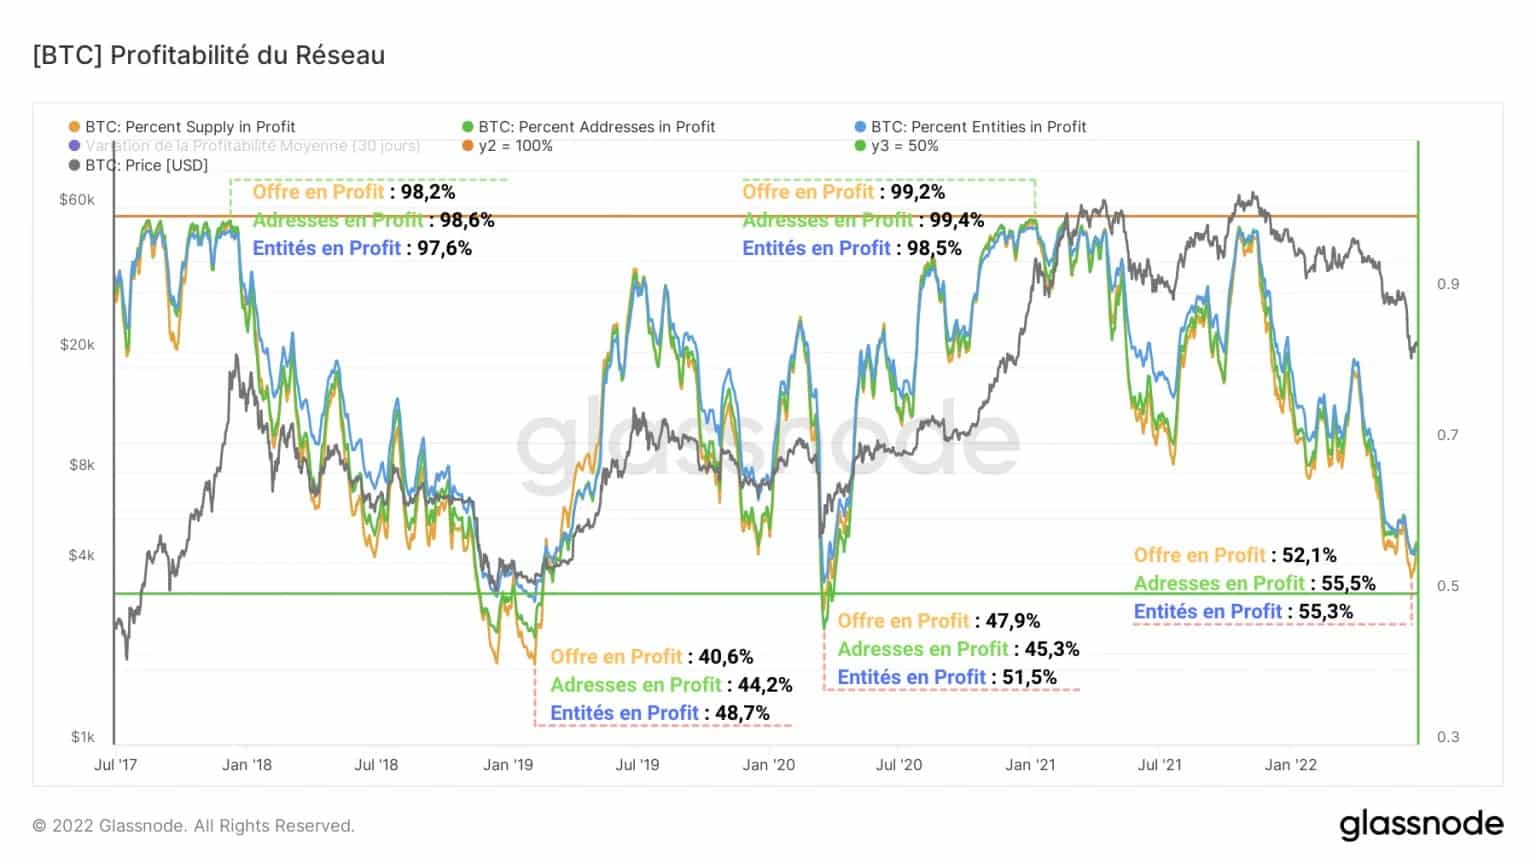
Figure 2: Profitability of the Bitcoin network
With historical lows recording profitability below 50%, and given the latent losses still held by LTHs, a further fall is plausible and would exhaust the remaining selling pressure within the LTH cohort.
In response to this fall in overall profitability, a record volume of loss-making coins was moved between May and June, during the two periods of bearish volatility.
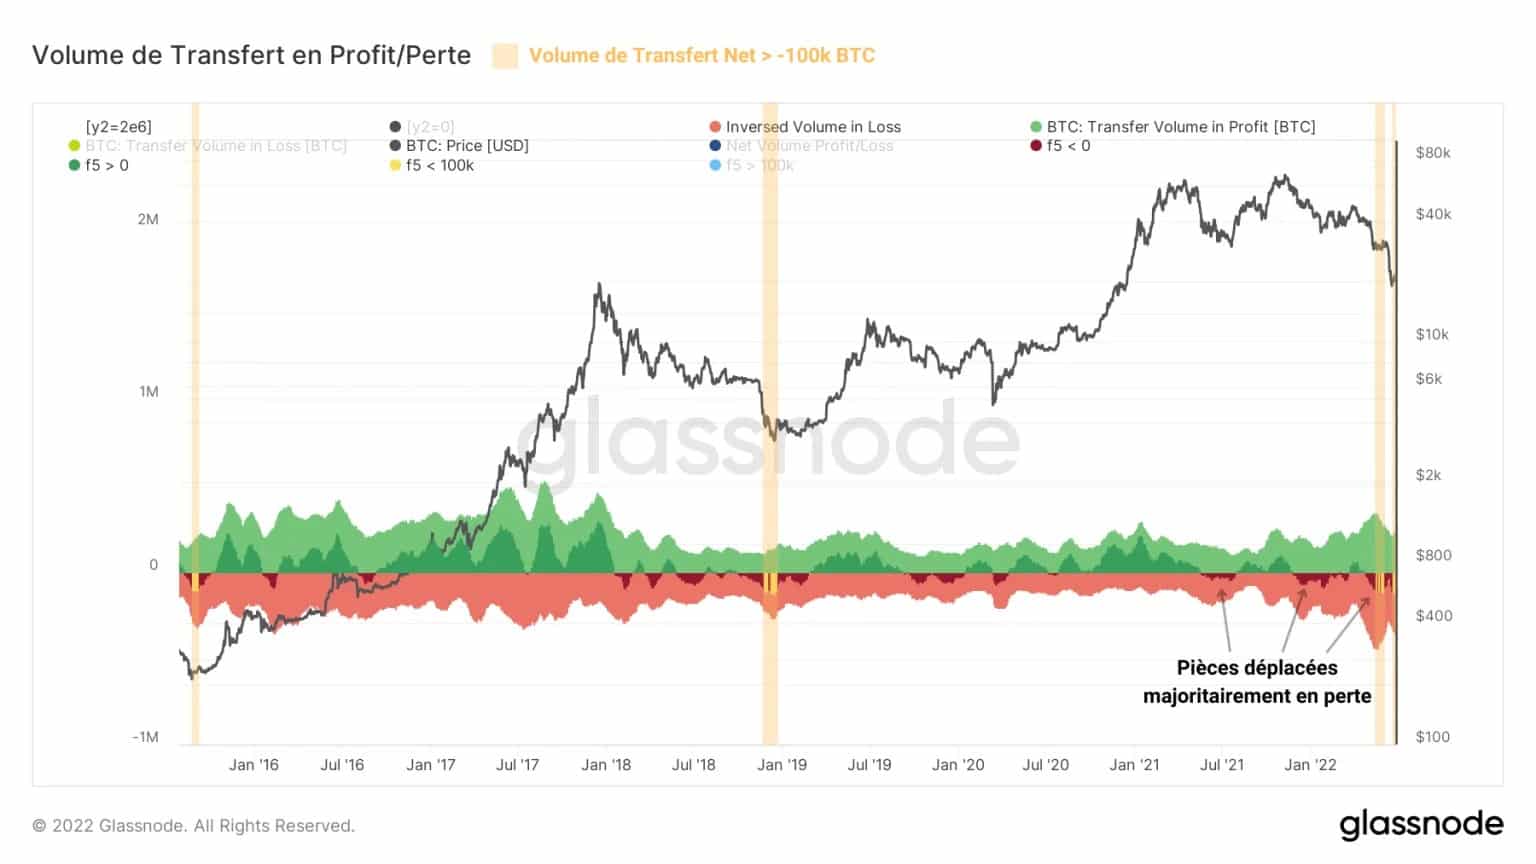
Figure 3: Transfer volume in profit/loss
These transfer volumes in loss are often associated with deposits to trading platforms (desire to sell) or portfolio reorganisations.
Spikes in volumes exceeding 100,000 BTC (orange) have again been recorded, indicating that the magnitude of the decline has triggered behaviour similar to that seen at the end of the 2015 and 2019 bear markets.
Weak onchain activity
Lack of investor participation can be seen on the blockchain, especially through the measurement of the number of new active entities, for the first time on the Bitcoin network.
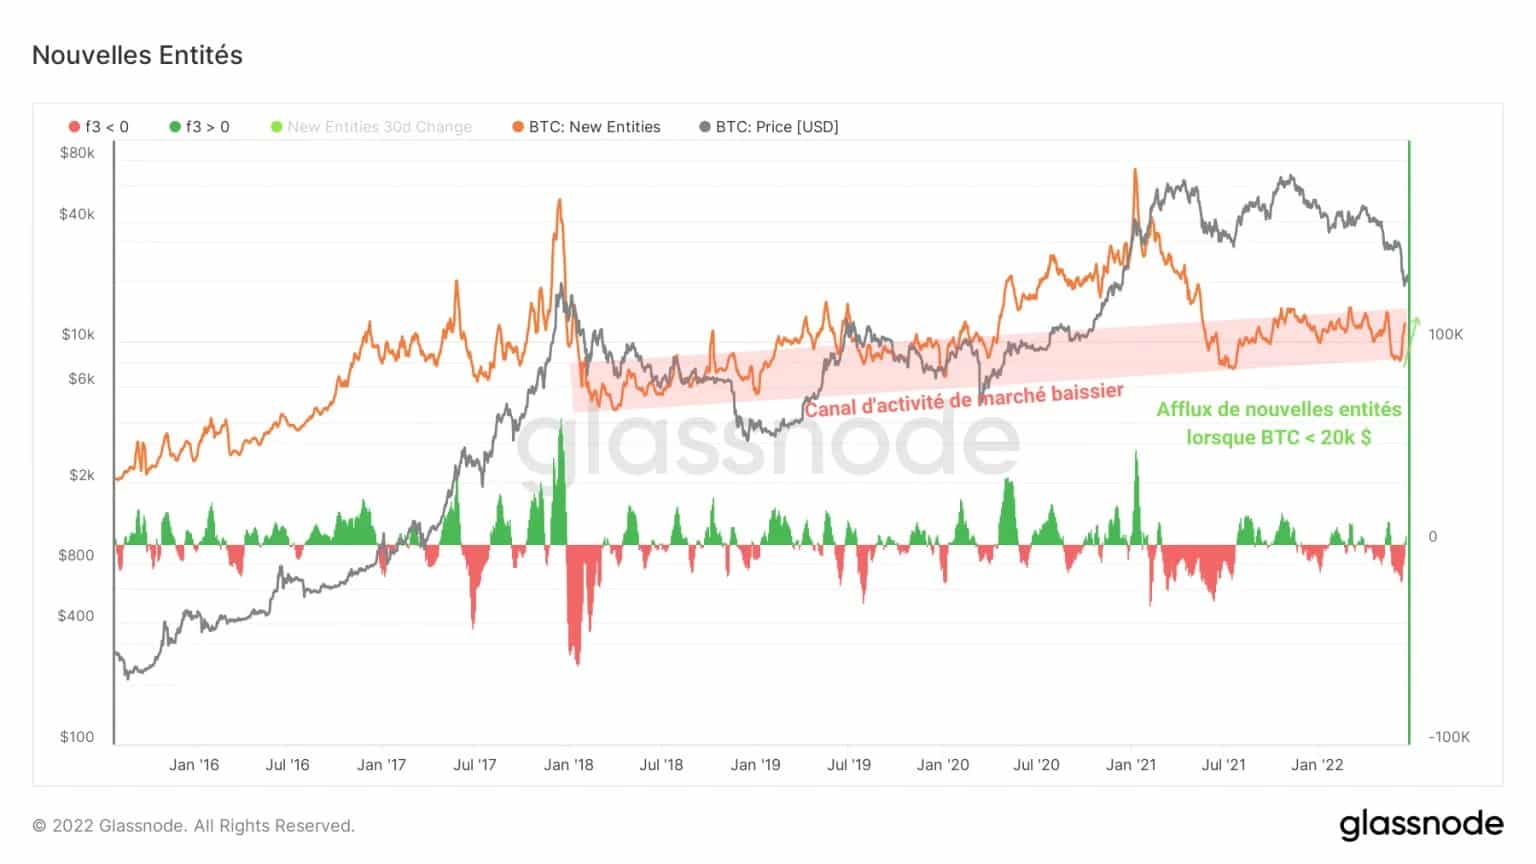
Figure 4: New entities
Despite limited interest when compared to recent bear market values, the drop in the price of BTC below $20k has generated palpable interest, with nearly 104,000 entities joining the market in less than 7 days.
Note, however, that this rise remains on a “normal” scale and that this metric is still moving within a long-term bullish channel (red) representing a high conviction investor base.
However, this is not the end of the bear market. Indeed, before the price can enter a new uptrend, the economic commitment of participants will need to recover.
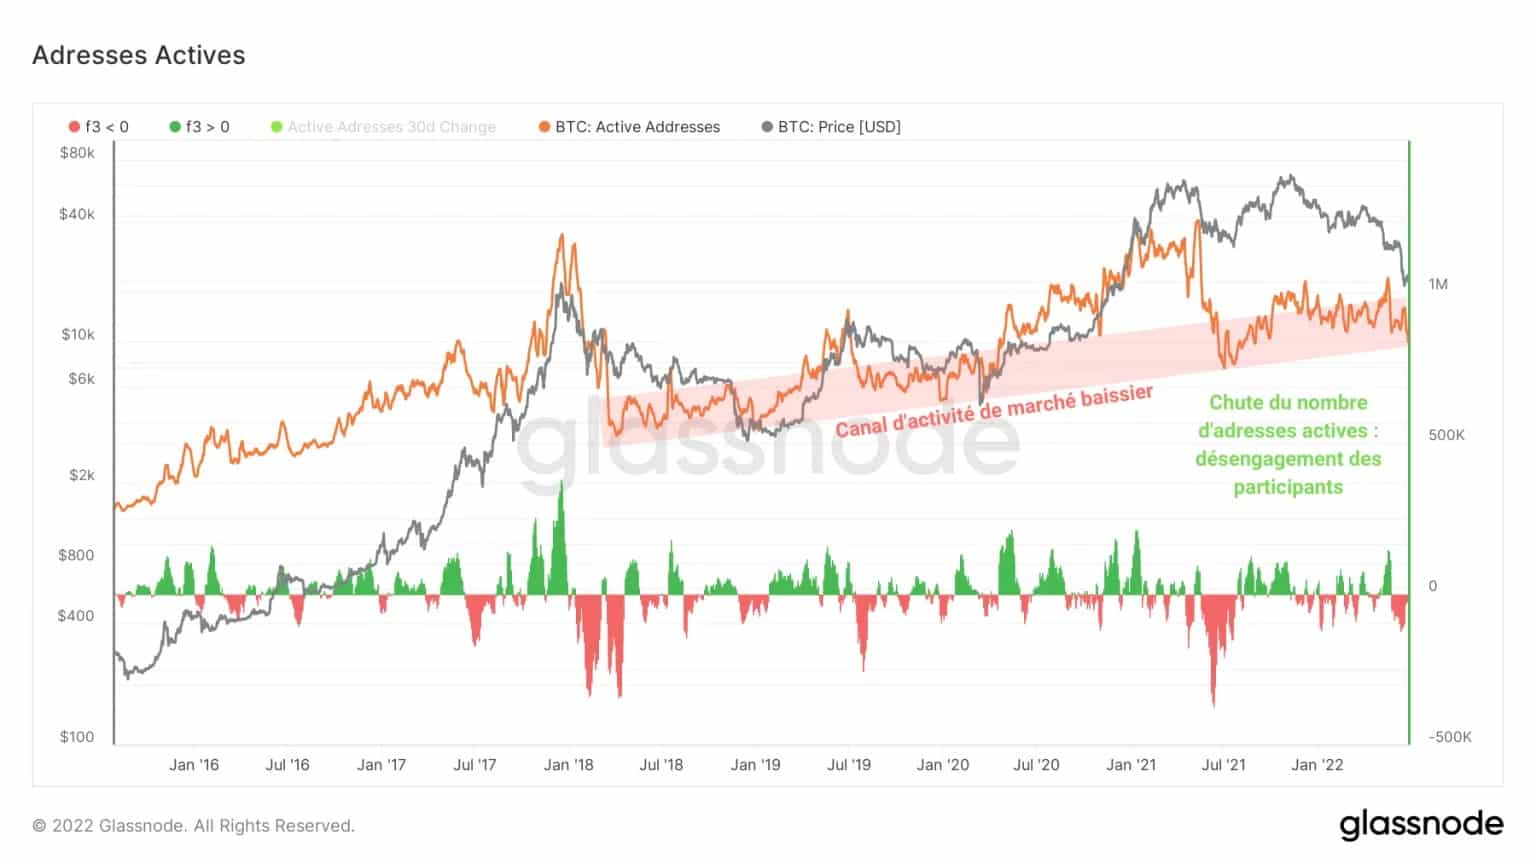
Figure 5: Active addresses
The number of active Bitcoin addresses, also in a long-term uptrend channel, continues to fall with the recent sell-off, a sign of some participants leaving the market.
With 833k active addresses to date, the Bitcoin network continues to grow but is showing signs of weakness in terms of on-chain activity and investor participation.
This is supported by a stagnant transaction count since September 2021. With around 240k transactions per day, the Bitcoin network is moderately busy.
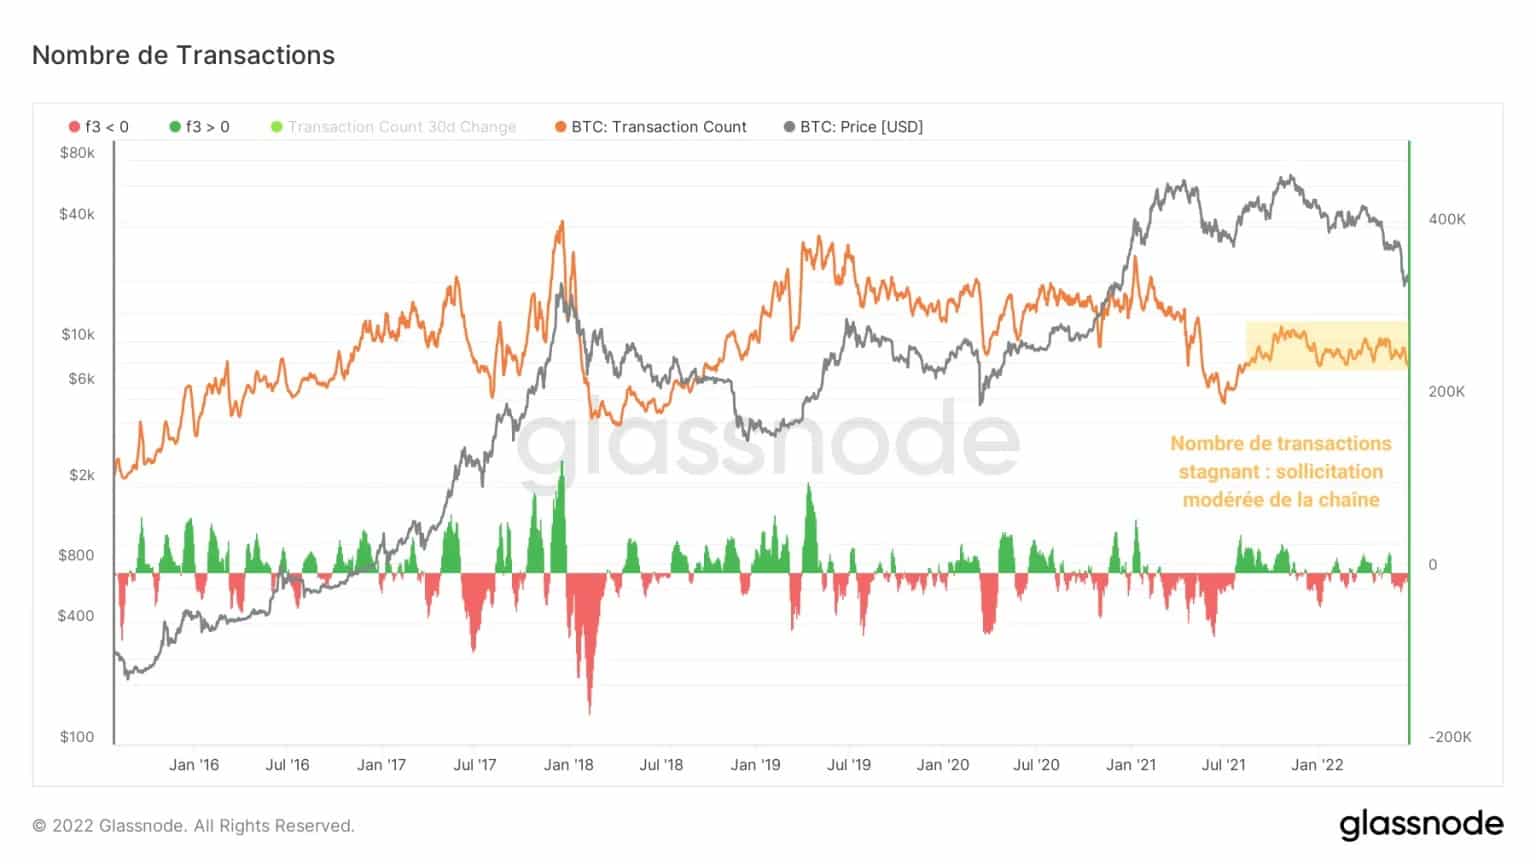
Figure 6: Number of transactions
The lack of serious interest in BTC is reflected in a drop in transfer volume, a drop/stagnation of transactions, an empty mempool and a low demand for block space.
These conditions are fulfilled during the advanced phases of bear markets, during which many investors have been ejected / liquidated. This leaves only a base of high-conviction participants who will accompany the newcomers during the next bull run.
In addition, the fees paid to exchange platforms for their deposit, withdrawal and transfer services are currently at a very low level (☺ 10k BTC per day).
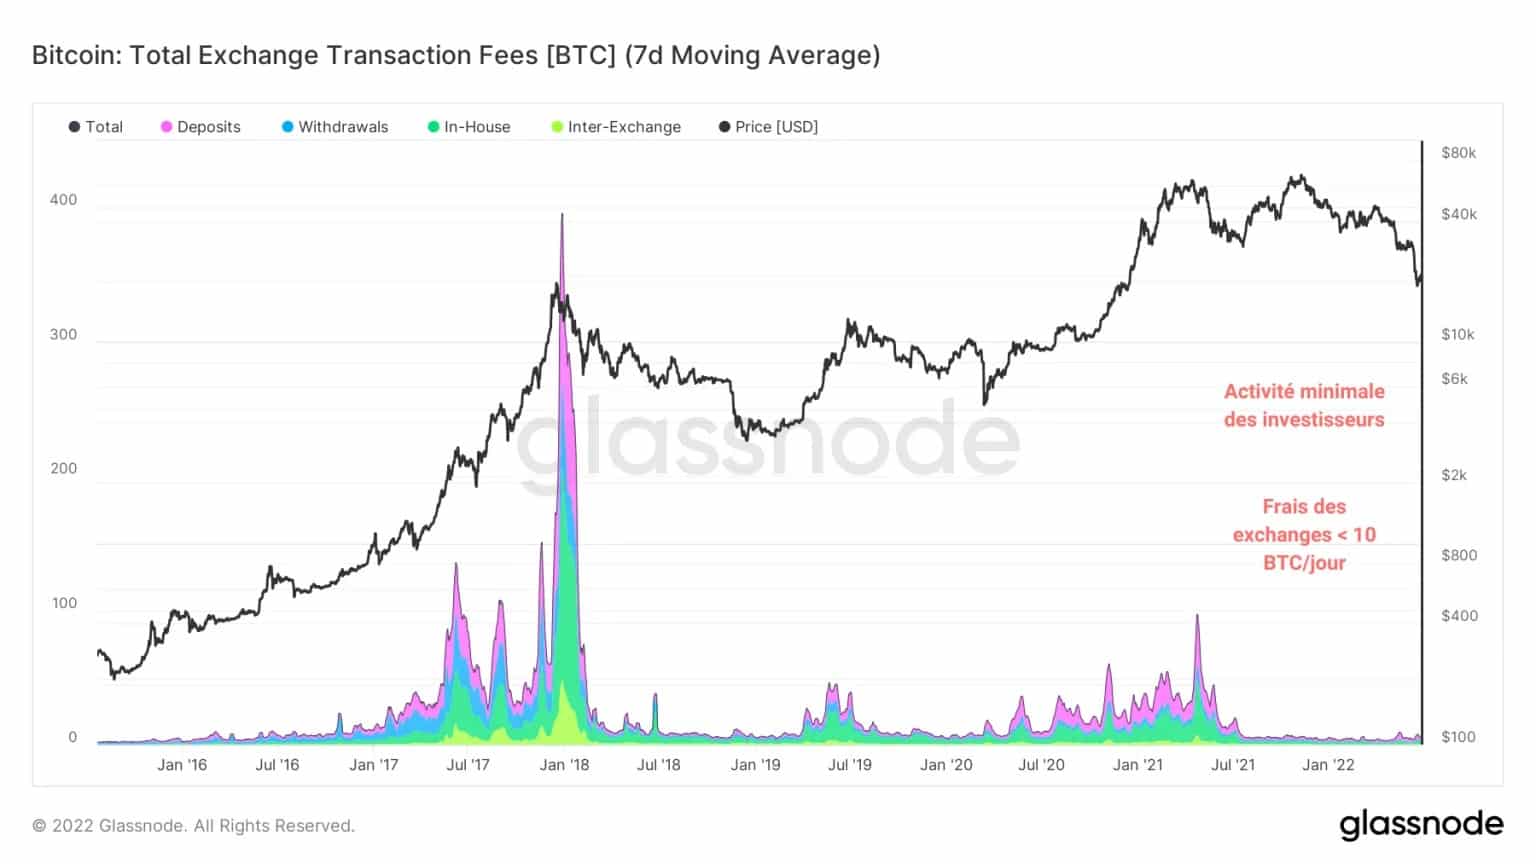
Figure 7: Exchange fees
This indicates that there has been very little activity on the exchanges since May 2021 and no activity to match that achieved during the bull markets of 2016 – 2017 and 2020 – 2021.
We can however observe 2 slight spikes in fees associated with deposits (desire to sell) during the recent downturns, a sign that some participants rushed to sell their coins on the exchanges in response to the price volatility of the last 2 months.
Purge in leverage
Following the mid-June purge, open interest (OI) on USD settled futures fell 28%, reflecting massive contract closures and indicating a purge of leverage on USD collateralised positions.
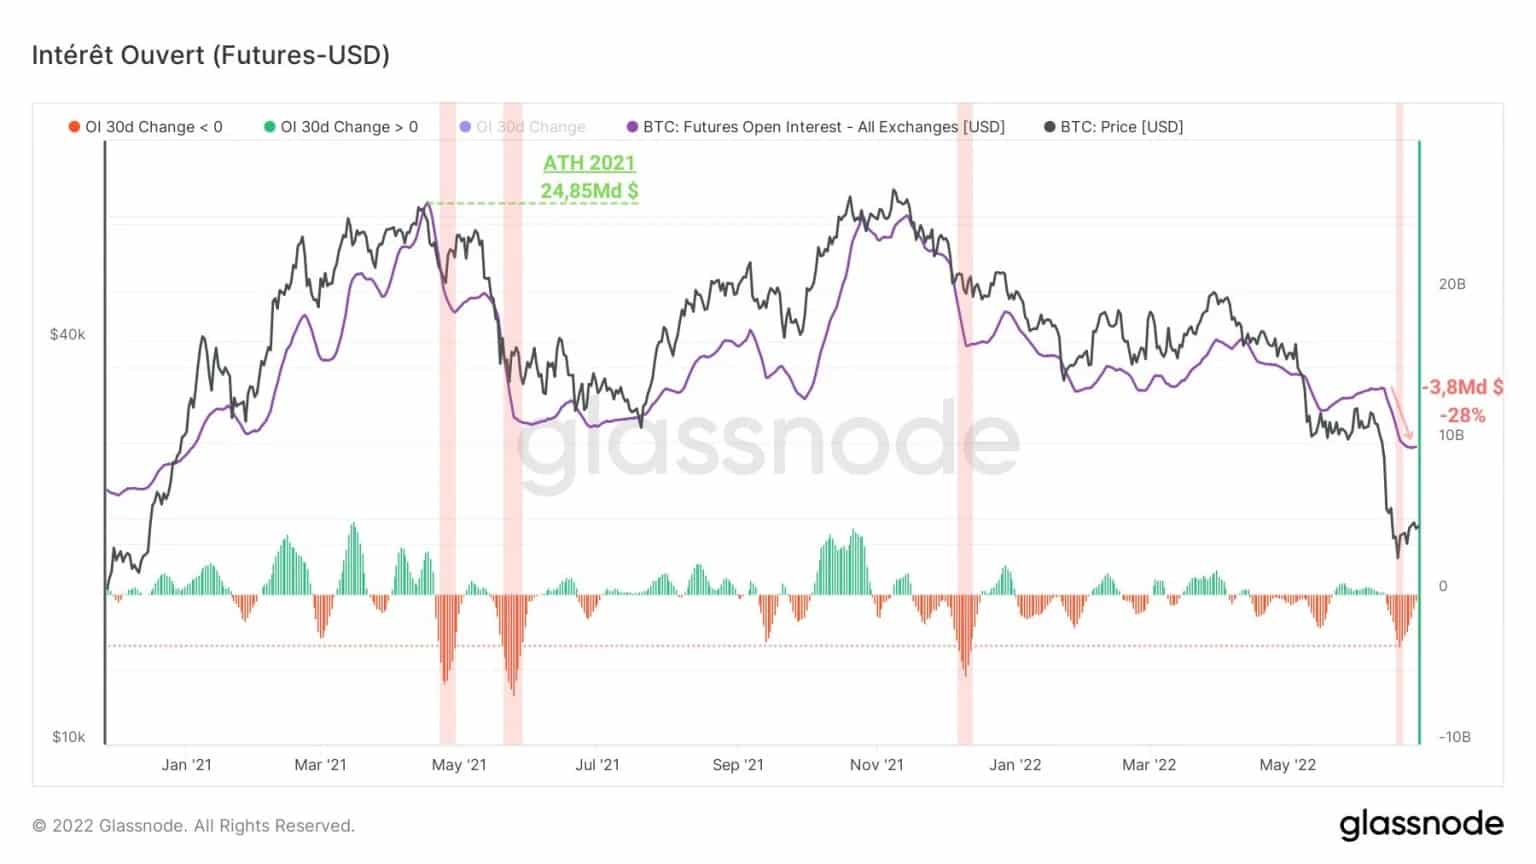
Figure 8: Open interest in USD
A purge of this magnitude (-$3.4bn over 30 days) has only occurred 4 times in 2 years and has emptied the market of excess risk impairing the organic growth of the BTC spot price.
To date, the IO is down over 50% since its May 2021 ATH, providing an encouraging note for short/medium term price action.
Summary of this on-chain analysis
In sum, this week marks a welcome lull following the volatility events of May and June 2022.
The network’s profitability has halved since the November 2021 ATH, leading to a general state of financial distress. This context seems conducive to the exhaustion of selling pressure, now controlled by the loss-making assets of the LTH.
The Bitcoin network is operating in an under-regulated state, with a distinct lack of commitment from participants. This dynamic is typical of bear markets where investors desert the blockchain in anticipation of better days.
A sharp drop in open interest settled in USD indicates that a purge of leverage has taken place in the derivatives markets and provides a healthier market environment today than in the past two months.
Sources – Figures 2 to 8: Glassnode