
The week we are experiencing in the stock market is the last decisive week in terms of economic fundamentals, with continued disinflation in the US and a further rate hike by the Federal Reserve (FED). Despite the rebound in its historical volatility, the Bitcoin price is still slow to make its technical choice in light of the post-FTX excitement.
Federal Reserve terminal rate in sight but FED remains restrictive
Tuesday 13 December saw the release of US inflation figures for November. The market was reassured to see the third consecutive month of disinflation confirmed by the US consumer price index. However, it should be borne in mind that the annual growth rate of the price system is still over 7% and that the Central Bank’s objective is to bring the inflation rate down to 2%.
The FED unveiled a new monetary policy decision on Wednesday evening, increasing the interest rate of its fed funds from 4% to 4.5% and reminding us that interest rates will remain at around 5% for several months until the rise in prices is finally broken.
The main uncertainty for the year 2023 is whether rates held so high for several months will not end up triggering an economic recession. How would the crypto market behave in such an economic context? The answer is not obvious, at least it cannot be seriously argued because in the young life of cryptocurrencies there have only been two major recessions and two occurrences are not enough to infer consequences.
In any case, the dominant fundamental theme for the crypto market currently remains the financial strength of the centralized platforms and this week it was Binance that brought feverishness to investors by suspending withdrawals in stablecoin USDC for a few hours. In the short term, it is imperative that withdrawals from Binance cease and reverse into deposits to restore immediate confidence.
Despite all of these bearish fundamentals for the crypto market, the Bitcoin (BTC) price is still attempting to stabilize, thus preserving the potential bullish divergence pattern between price and momentum (represented below by the RSI technical indicator) over the medium term.
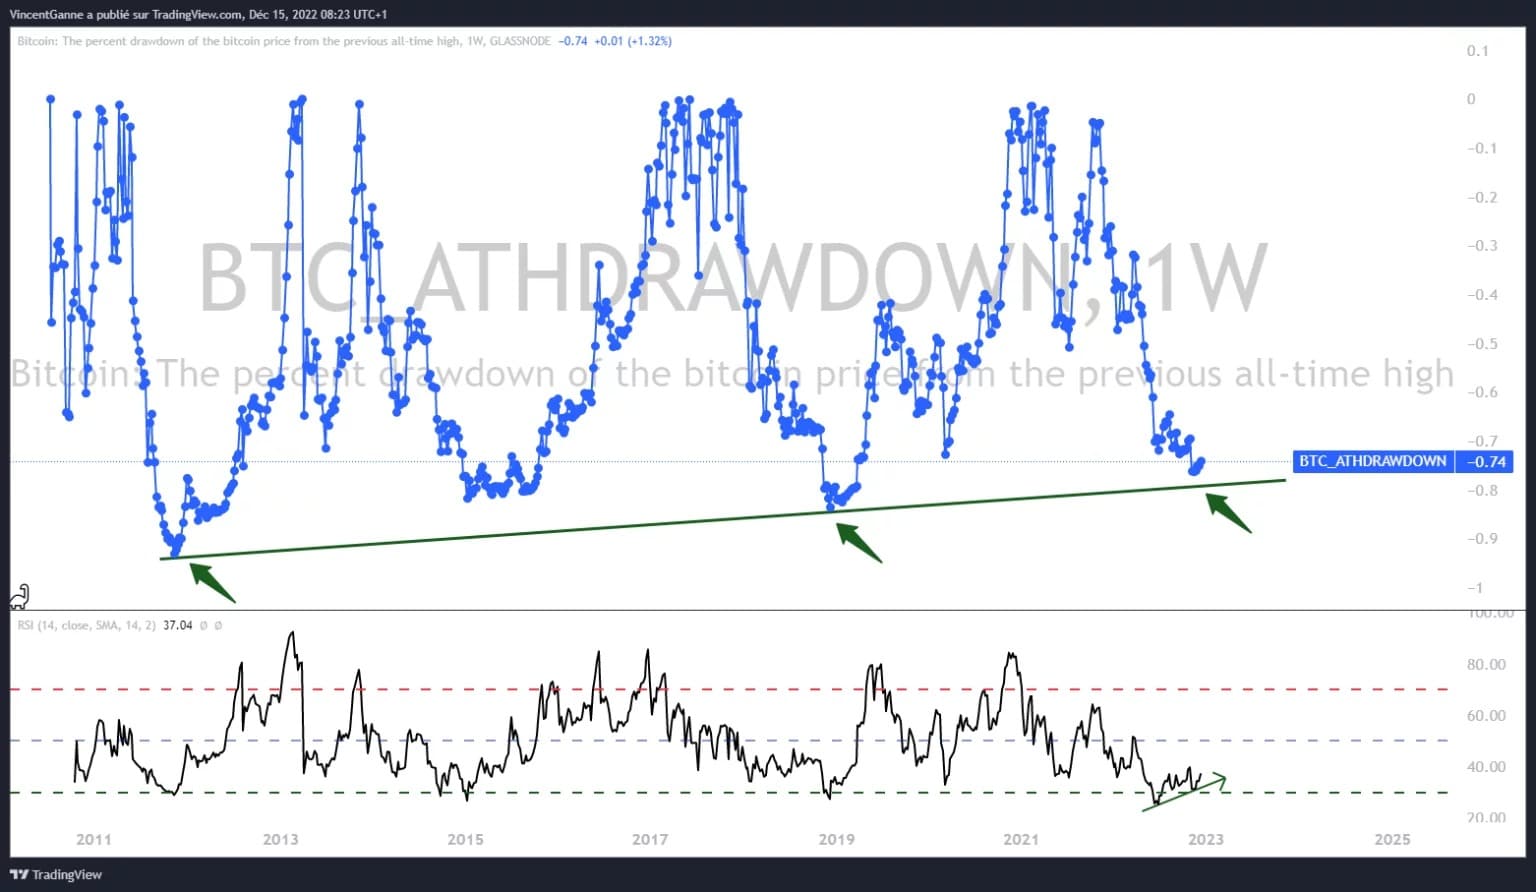
Chart that exposes the % drawdown in bitcoin’s price since its previous all-time high
Bitcoin, technical picks still await despite volatility rebound
Let’s get back to the technicals as we near the end of this busy week on the fundamentals front. The bitcoin price remains anchored in bear market until it is able to break through the $18/19K technical resistance with high volume. This is always the graphical border between the continuation of the downtrend and the validation of a long-term low.
Below I have selected a chart with the Bitcoin Rainbow indicator that highlights the role of this chartist resistance. If the market were to break through it, it would then propose a reintegration of the Rainbow’s lower bound, which would be an end-of-bear market signal (in contrast to the bearish reintegrations in 2011 and 2014). At the time of writing, this signal is still pending.
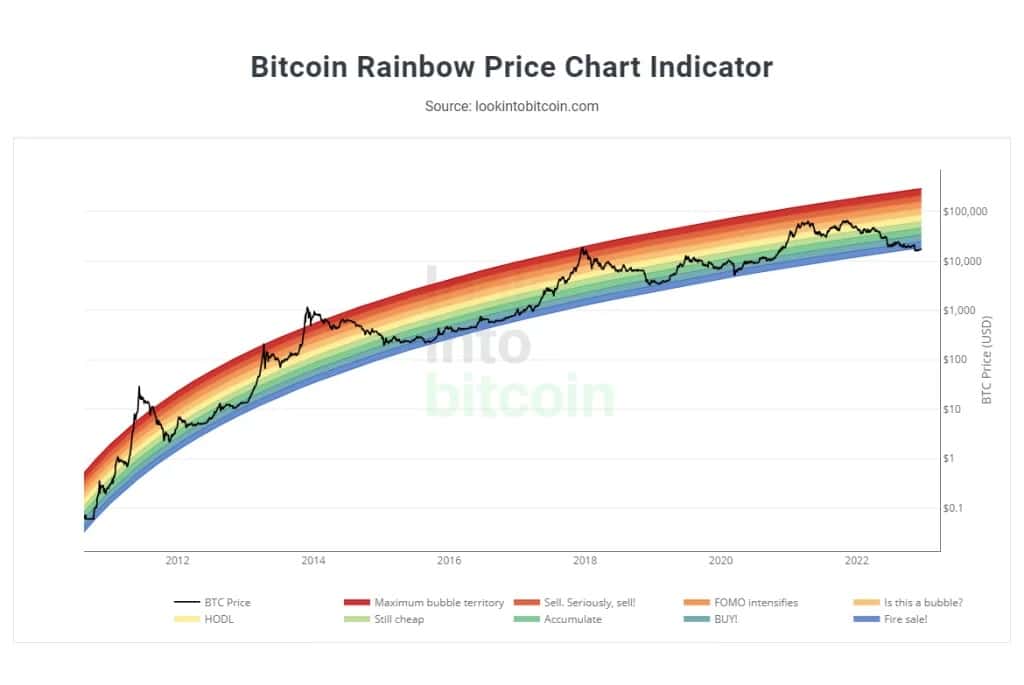
Chart showing the Bitcoin Rainbow indicator with the bitcoin price (black curve)