
Despite a lack of momentum in the bitcoin price, the position of short-term holders (STH) of BTC, coupled with new flows out of exchanges, are sending an encouraging signal. On-chain analysis of the situation
Low volatility near the bottom of the bear cycle
Bitcoin has been trading below $20,000 for the past two weeks, near the bottom of the $24-18,000 range. While bond and equity markets continue to bleed, BTC remains surprisingly stable, for now.
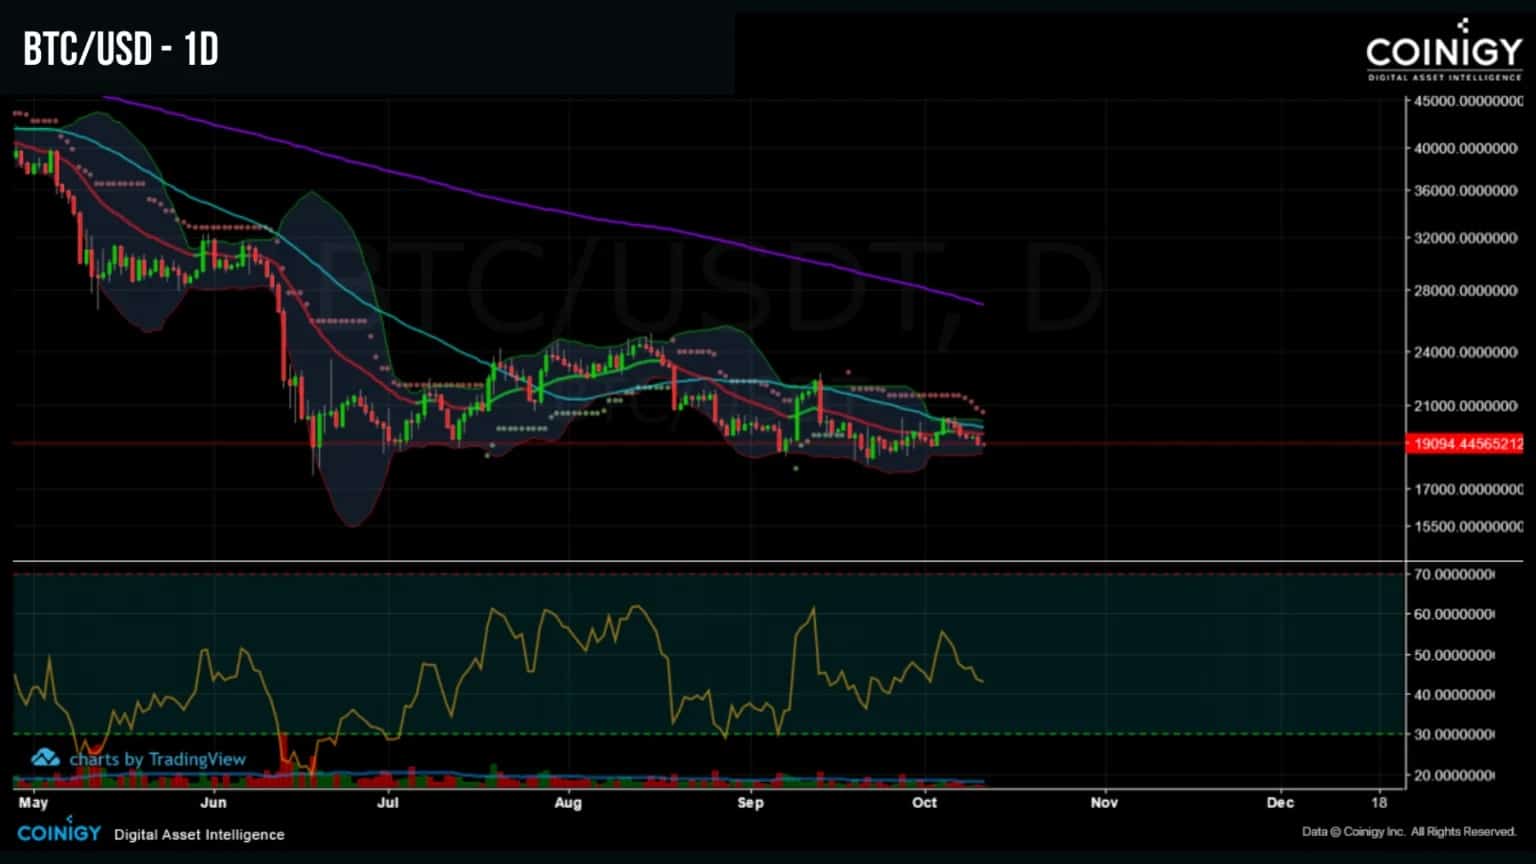
Figure 1: BTC daily price
While HODLing behavior dominates and long-term holders (LTH) wait patiently for the storm to pass, bitcoin’s price movement is likely to be influenced by the decisions of short-term holders (STH), who seem to be experiencing an improvement in their condition.
This week, we will evaluate:
- the structural fall in exchange reserves;
- the condition of the short-term holder (STH) cohort.
Exchange siphoning continues
Looking at the flow of bitcoin reserves from centralized exchange platforms, it appears that the downward momentum, since March 2020, is still ongoing.
Despite two notable deposit phases in May and September 2022 in response to a price drop, the exchanges’ BTC balances are now recording a multi-year low reaching the levels recorded in April – May 2018.
Exchanges currently hold 2.33 million BTC, or 12.17% of the current supply in circulation. This structural drop is indicative of the paradigm shift underway across the entire market’s investor cohorts.
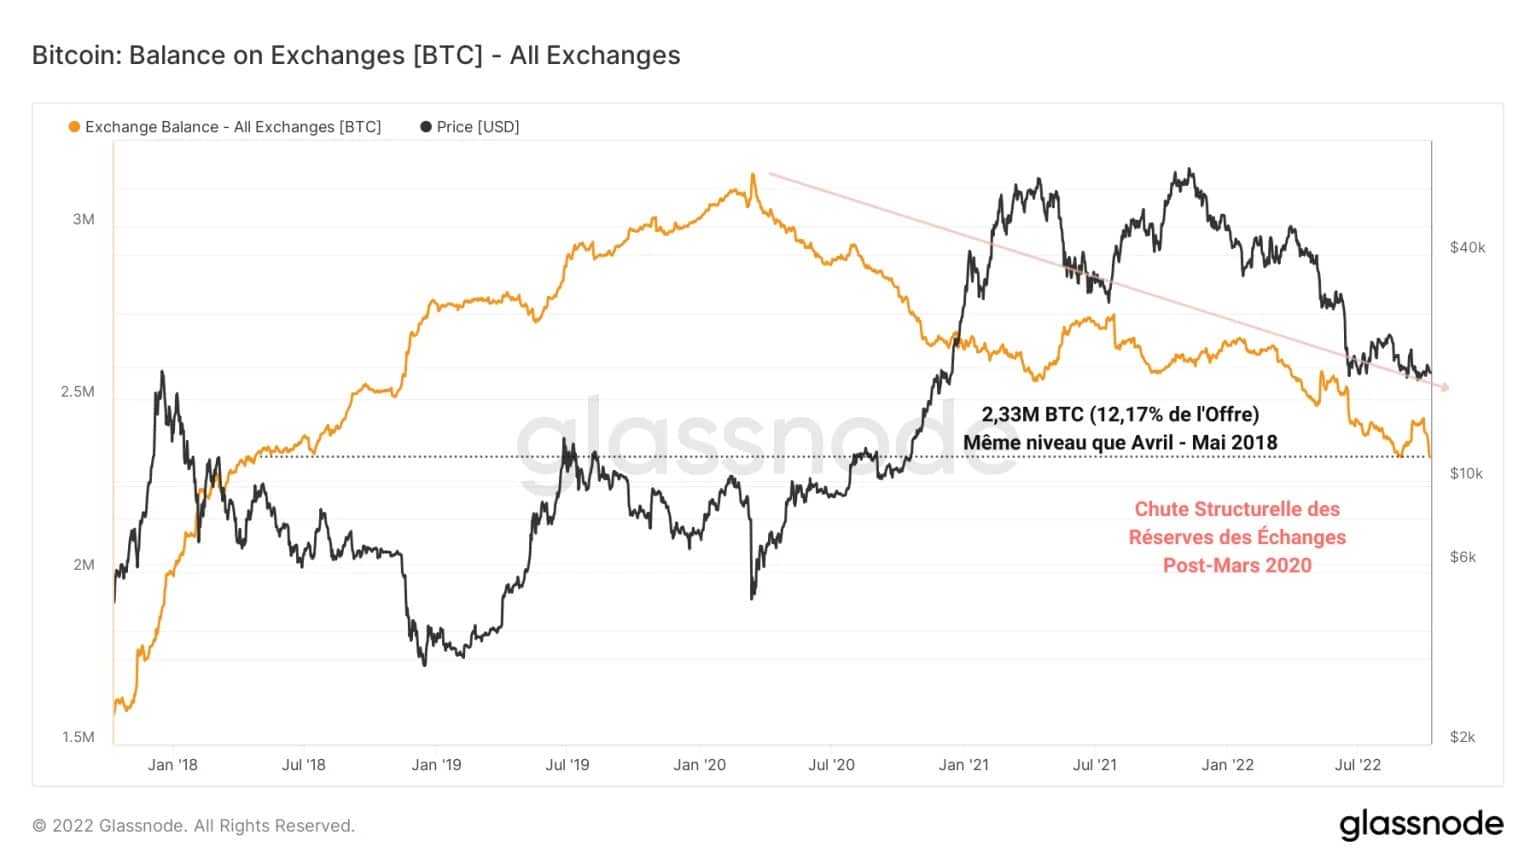
Figure 2: BTC reserves of exchanges
Participants favour holding their BTC in their own hands (non-custodial). They are moving away from exchanges in order to gain sovereignty, while showing a clear interest in Bitcoin as insurance against central bank monetary policies.
This change in dynamics is particularly visible via the measurement of the net flow of exchanges, which represents the sum of deposits and withdrawals made on these platforms, all smoothed by a 7-day moving average.
The deposit dominance phase (green), in effect from 2012 until March 2020, saw inflows to exchanges of up to 20k BTC per day over time.
After the black swan of March 2020 and the global economy entering a state of crisis due to the circulation of COVID-19, a dominance of withdrawals (in red) is noticeable and becomes the underlying trend of the net flow of exchanges.
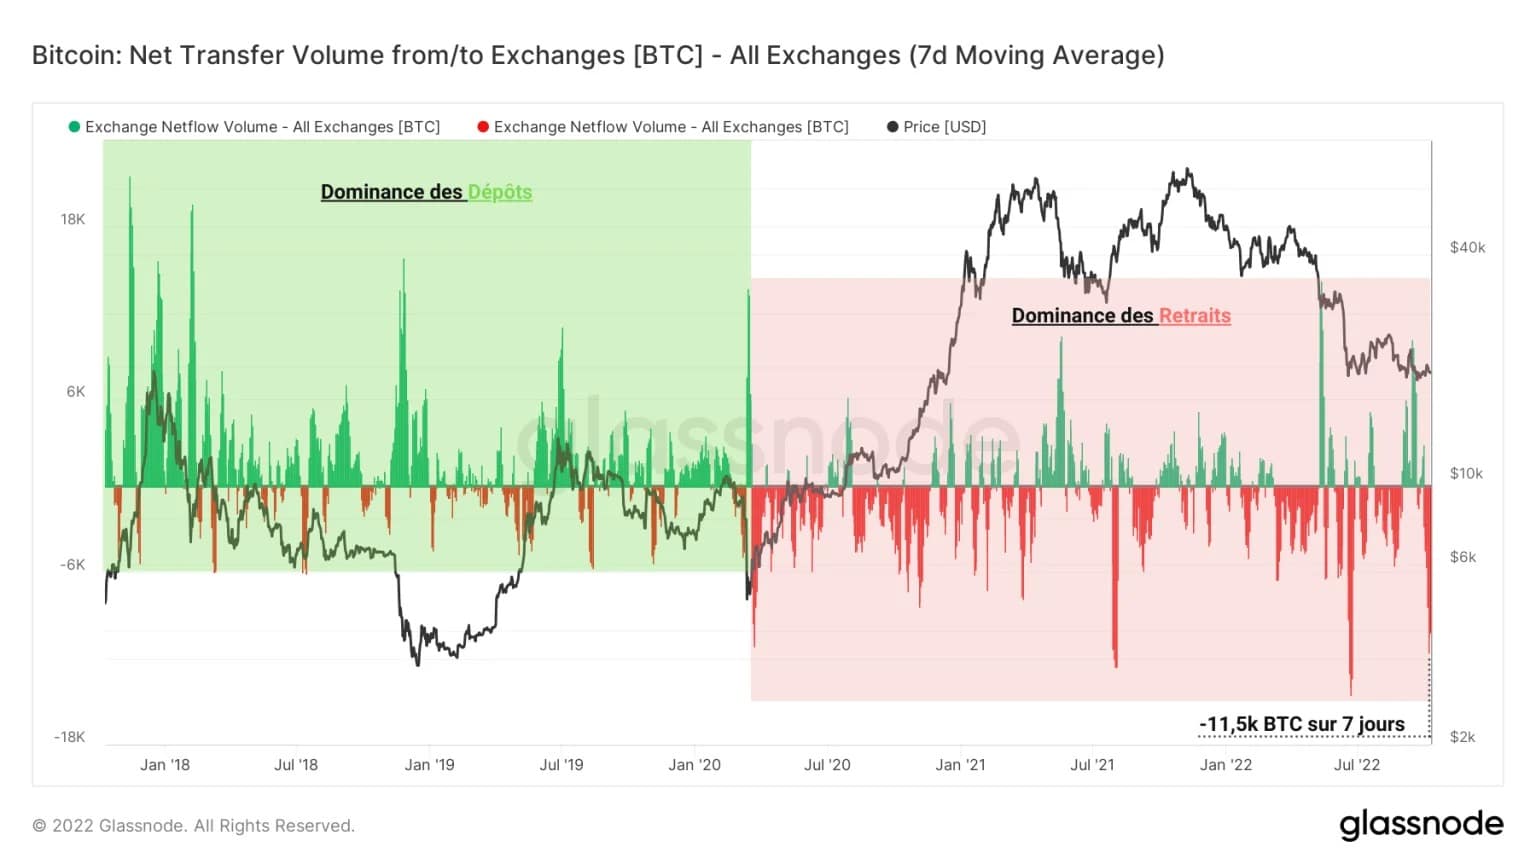
Figure 3: Net Flow of Exchanges
With outflows peaking at over 15,000 BTC per day in July 2022, when the price returned to visit the $20,000 level, this new flow pattern indicates a strong interest in self-holding.
Currently witnessing withdrawals of around 11.5k BTC per day, this metric tells us that many BTC have left the exchanges over the past week.
Improving condition of short term investors
Upon closer inspection, it appears that some of the BTC recently removed from exchanges appears to be accumulated by Short Term Holders (STH).
Entities holding their BTC for less than 155 days, they are often sensitive to price changes but also show strong opportunism. They commit and disengage very quickly, depending on market fluctuations.
Following the short-term accumulation during the bull run and the strong distribution (selling) triggered by the increase in the supply of loss-making STHs (in red), a period of strong unprofitability has hit this cohort of investors.
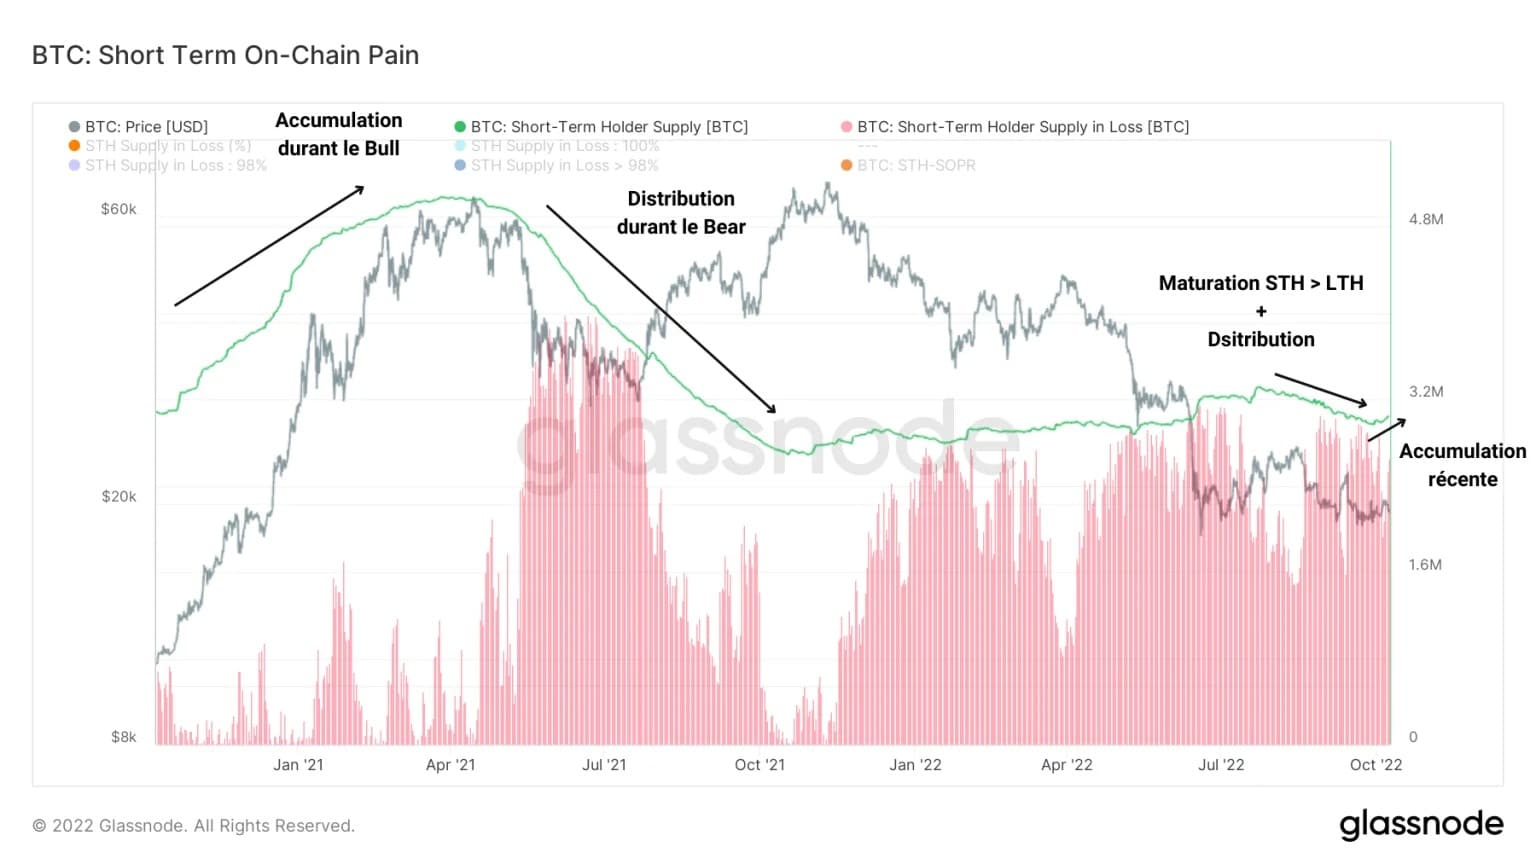
Figure 4: STH supply
After a timid build-up between October 2021 and July 2022, a distribution phase, coupled with the fact that some of the BTC held exceeded 155 days, led to the supply held by STH falling below 3 million BTC.
More recently, a further rise in this measure indicates that some of the cohort has returned to buying, which is a relatively constructive sign of short-term confidence.
If the short-term accumulation of investors offers us encouraging signs, it is largely due to the fact that the aggregate cost basis of STH (in pink) is moving ever closer to the spot price of BTC.
Indeed, currently standing at $22,181, the realised price of short-term holders has been moving downwards since December 2021, signalling that coins purchased on a short-term basis have a decreasing acquisition price, tending towards the average bitcoin (BTC) market price.
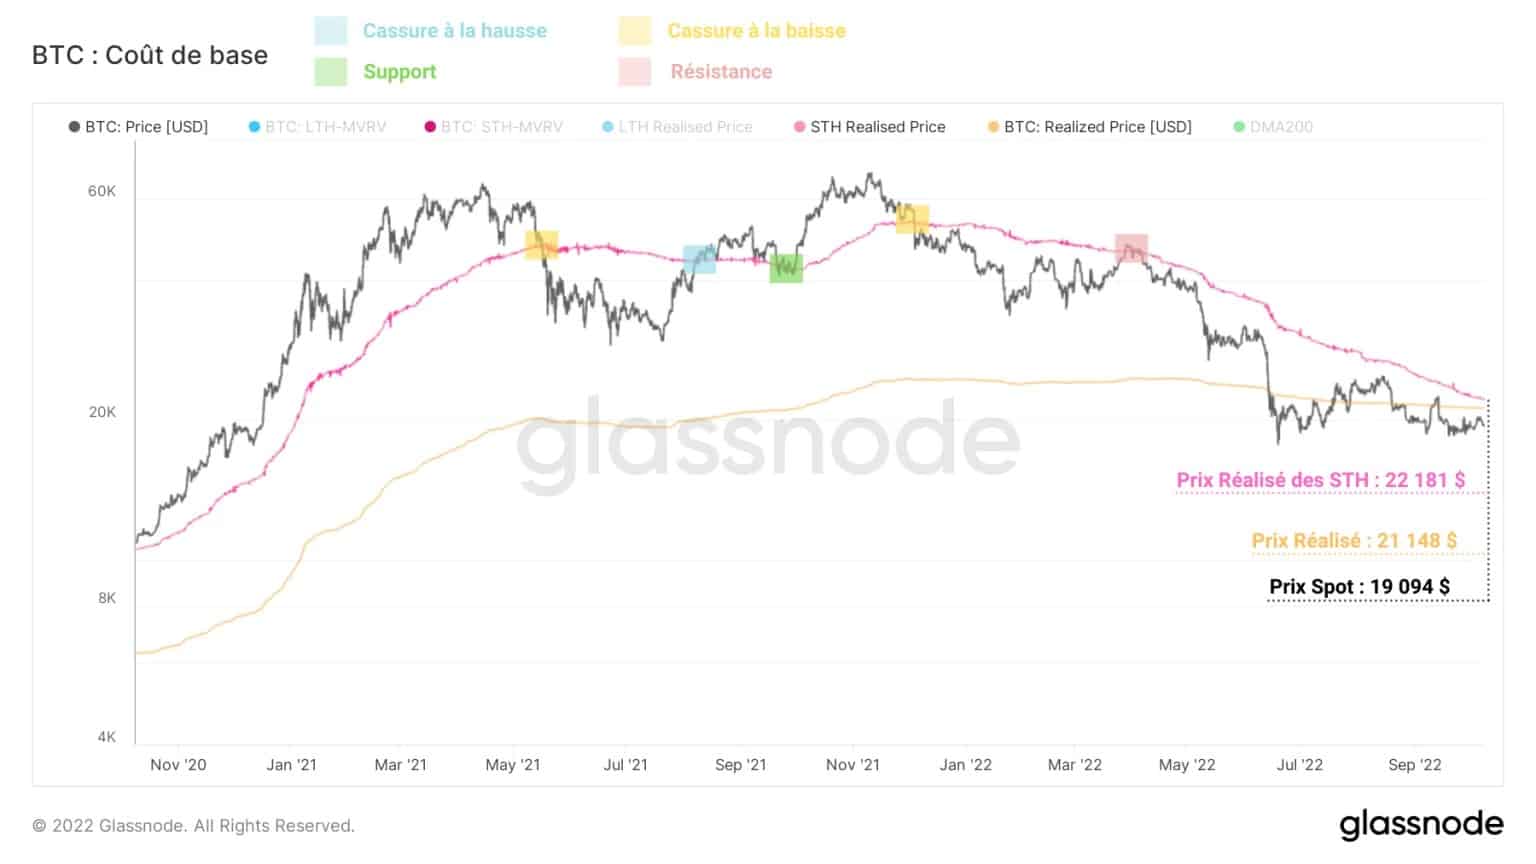
Figure 5: Realised price of STH
This clearly tells us that short-term accumulation is in full swing, and that although some of these coins have been sold at a loss throughout the down cycle, the cost basis of STH is now very close to the spot price as investors take advantage of the current range to capture the best possible entry price.
In the coming weeks, it will be crucial to observe the interaction of the realised STH price with the BTC price. The ideal scenario would be to see an upside breakout of the spot price, followed by support, signaling that STH is taking advantage of the rising price (blue) to double down (green) instead of favouring a dead cat bounce scenario (red).
This dynamic is elegantly highlighted by the STH-MVRV ratio, which is obtained by dividing the realised price of STH by the spot price of BTC.
Here, we can observe a bullish divergence of this indicator, signaling that the cost base of STH is approaching the average market price.
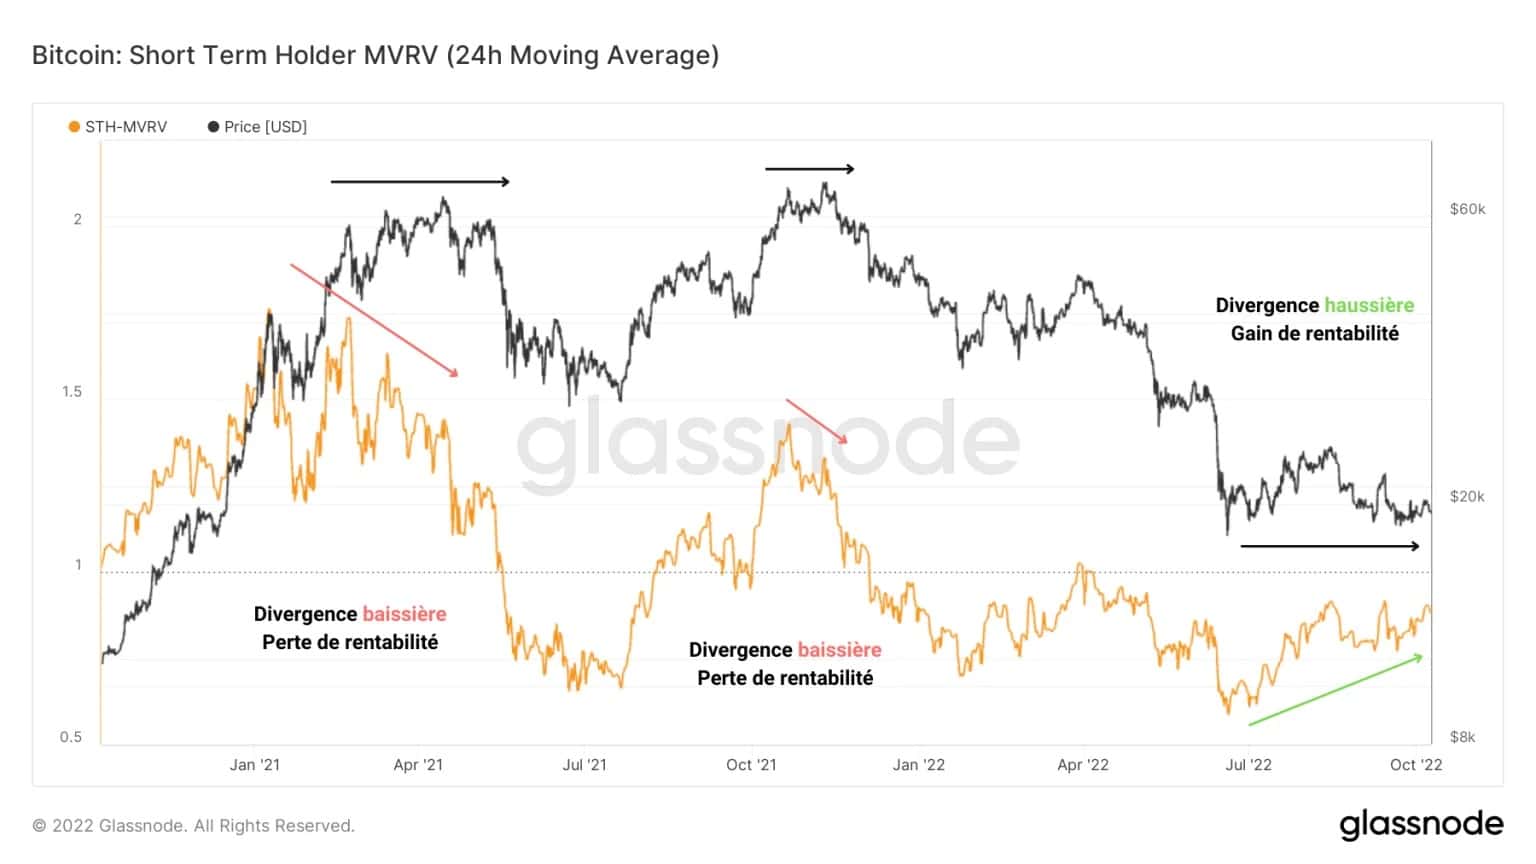
Figure 6: MVRV ratio of STH
Witnessing the improvement in the profitability of the cohort as well as the accumulation of coins in the short term, this ratio sends a very constructive signal that will be worth monitoring closely in future analyses.
Ideally, the observation of an STH-MVRV crossing the neutral zone (STH-MVRV = 1) and building on it to record new positive values would not only herald the effective return of short-term profitability, but would also confirm the willingness of STHs to take profits in the strength of a future rise.
Corroborating these findings, the profitability ratio of short-term holders’ expenses indicates that the cohort’s sales are increasingly close to their break-even point.
While this ratio is still moving in negative territory, signaling a loss taking of around -2% over the past few days, it is drawing a clear bullish divergence in the face of the stagnant BTC price.
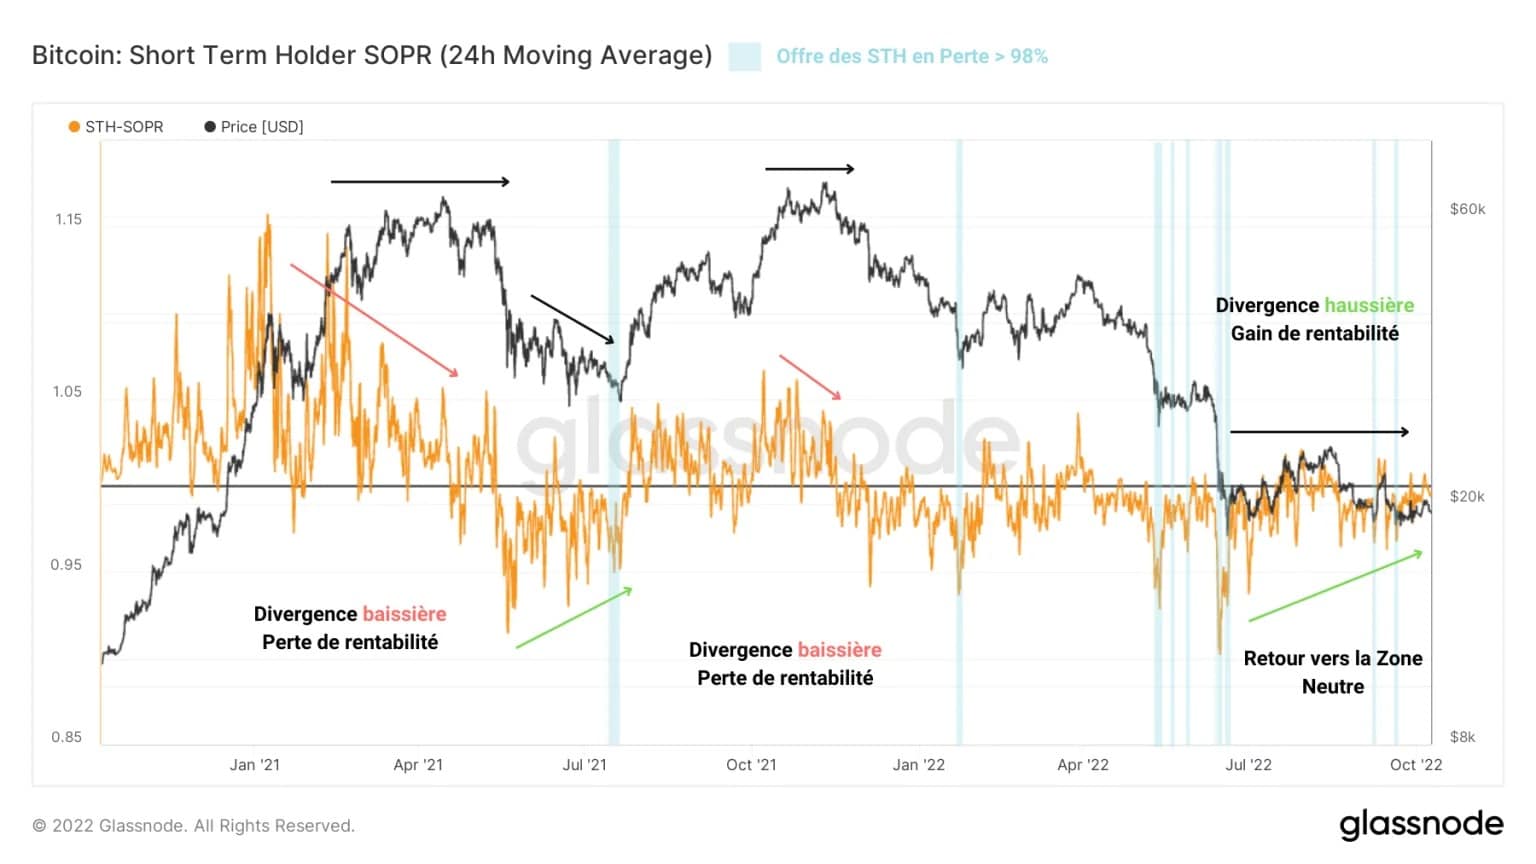
Figure 7: STH SOPR ratio
This means that, despite the gloomy market fluctuations, the latent and realised returns of BTC held for less than 155 days are improving, reducing short-term selling pressure on the spot markets. Moreover, such a bullish divergence has in the past favoured a bullish bias in the short to medium term.
However, this signal still needs to be confirmed. Ideally, the STH-SOPR should return to positive values and use the neutral zone (STH-SOPR = 1) as support to indicate a healthy and stable return to profitability for this cohort.
Summary of this analysis onchain
Finally, this week’s data indicates that, despite a lacklustre price environment, encouraging signals are coming from the Short Term Holder (STH) cohort.
Indeed, following a new wave of withdrawals from trading platforms, the supply held by this cohort has risen again, indicating the presence of a sizeable short-term accumulation.
Furthermore, measures of the profitability of short-term holders’ supply indicate that an improvement in the profitability of the cohort is underway, indicating a momentary relief from latent selling pressure from STH.
Finally, the realised STH price survey highlights that the cost basis of coins less than 155 days old is moving closer and closer to the BTC spot price, providing a constructive demand signal that will need to be closely monitored in the coming weeks.