
How to assess the fair value of an asset? Everyone has an opinion, but there are several methods that can be used to decide the question both qualitatively and quantitatively. On-chain analysis is leading the way to new valuation models for Bitcoin (BTC)
Bitcoin below $40,000 support
Bitcoin (BTC) ventures below the low point set a fortnight ago. Continuing its move below the 21MA after 67 days of correction, the bitcoin price breaks support and courts $38,000.
Tested positively on multiple occasions, this level had previously been a real obstacle for sellers who appear to have finally caused many long positions to be liquidated overnight before the end of options expiration today.
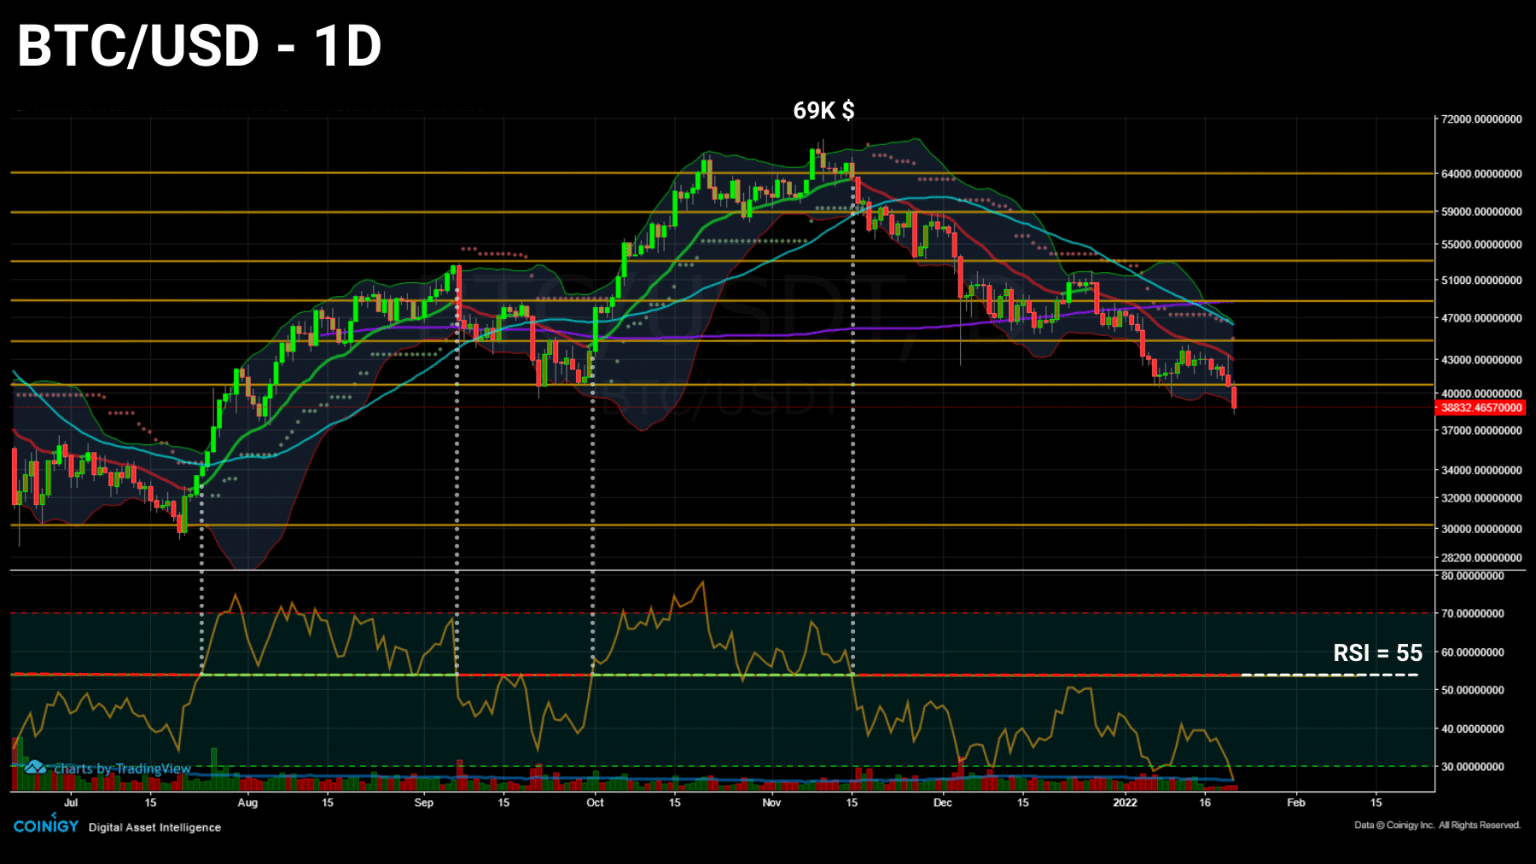
Daily bitcoin price chart
While fear may be setting in, it is prudent to keep our cool and watch the market calmly. If the BTC price is falling, we can legitimately assume that this is because the market is valuing its price lower. But what is really going on?
By evaluating two market valuation models, let’s try to answer the question: is the bitcoin price overvalued or undervalued?
Bitcoin market valuation
Let’s begin this analysis by briefly reviewing the concepts of market capitalization (mCap) and realized capitalization (rCap).
Traditionally, market capitalisation is a formula defining the total value of a company. Applied to a cryptocurrency, this value is calculated by multiplying the price of a token by the total number of tokens in circulation.
Realised capitalisation is a variant of mCap that better measures the value of distributed assets.
While the mCap implicitly assumes that all tokens are active, the fact is that many BTC are illiquid and dormant.
The rCap then measures a more genuine value of the asset and at the same time determines the overall market cost base.
It is calculated by multiplying the price of the tokens at the time of their expenditure (creation of the last UTxO) by the total number of tokens in circulation.
As illustrated below, the relationship between the mCap and the rCap provides us with simple, but very clear information about the valuation of the bitcoin market at a given point in time.
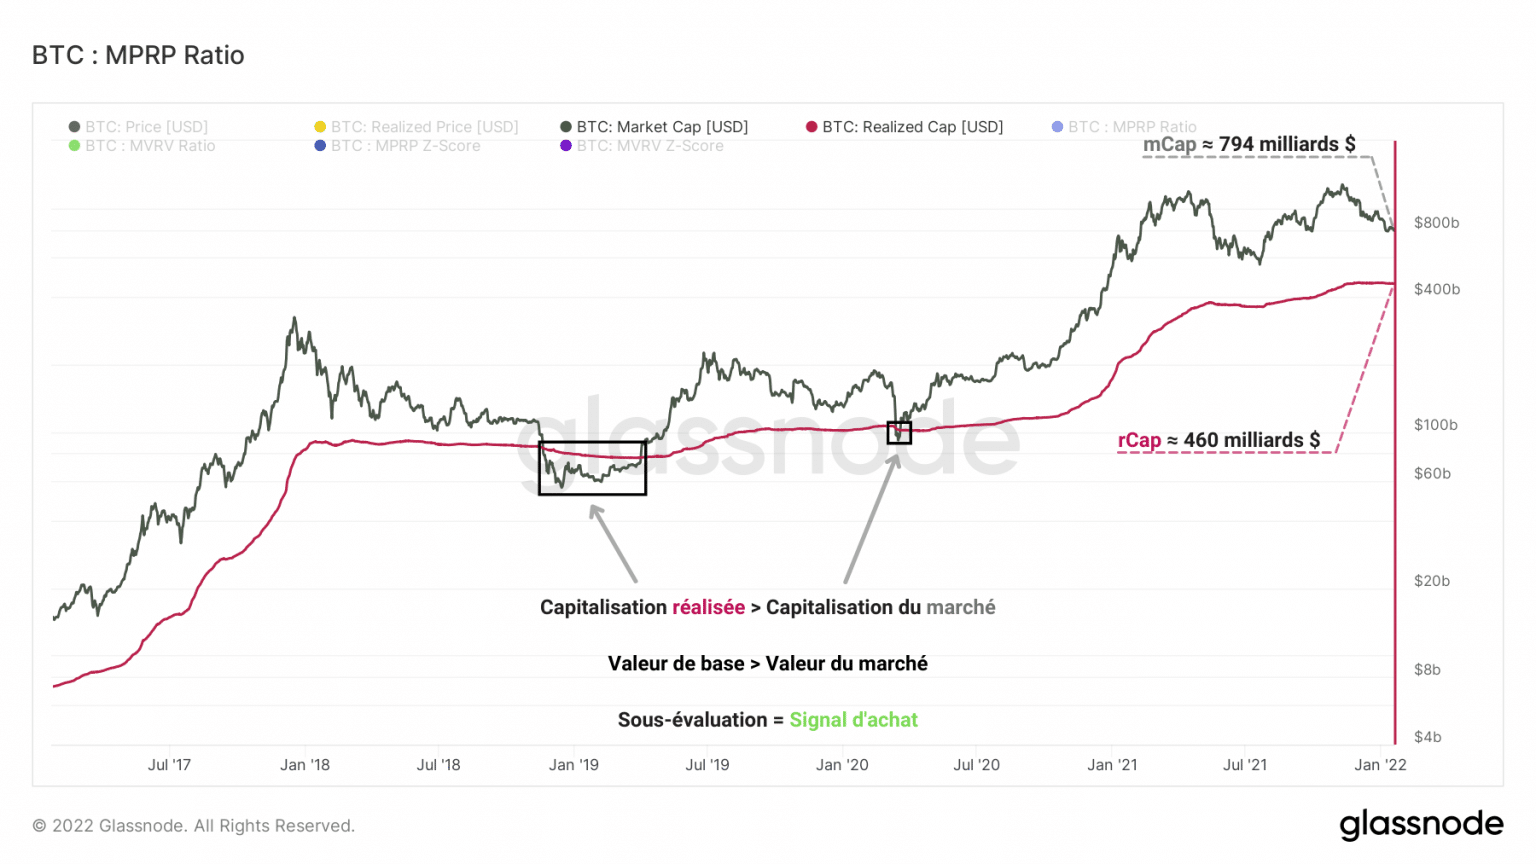
Graph of bitcoin’s market capitalization
Indeed, although the mCap is higher than the market cost base in essence (a sign of a growing market), there are rare periods when the market value is lower than the realised value.
Occurring during large capitulations, these periods are recognisable by the fact that the mCap dips below the rCap, indicating an overall undervaluation of the market, leading to a state of negative profitability and therefore an excellent buying opportunity.
It then becomes relevant to measure the gap between these two data in order to study the valuation status of the market as a whole. This is where the MVRV ratio comes into play.
This metric, obtained by dividing the mCap by the rCap, is used to determine whether the value of bitcoin is above or below its cost base, allowing the identification of generational peaks and troughs in the market.
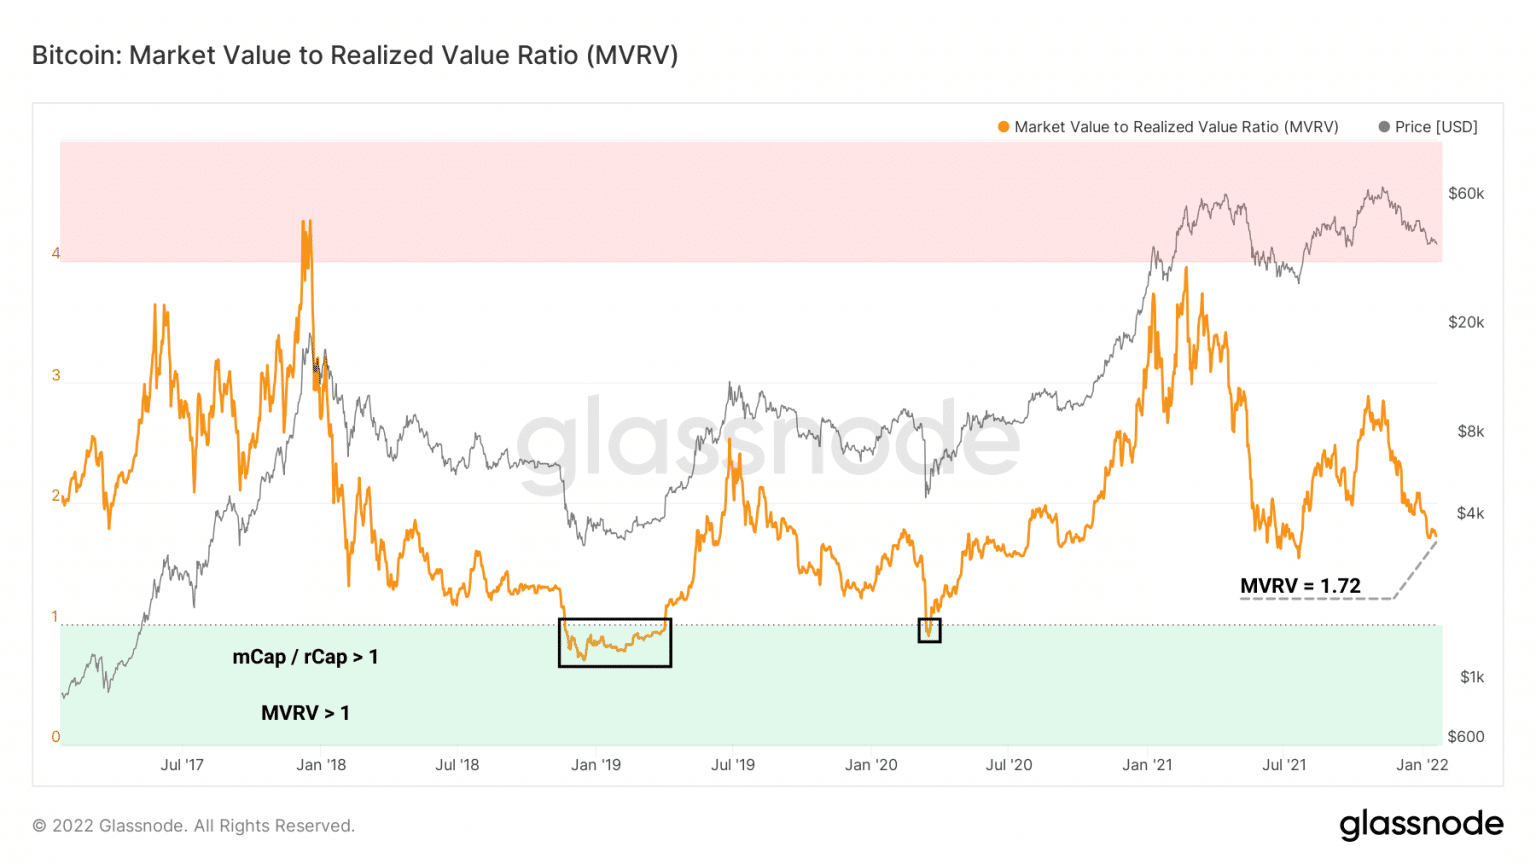
Bitcoin MVRV ratio chart
Here we find the undervaluation events of January 2019 and March 2020 at times when the ratio prints a value less than 1, a sign that the rCap exceeds the mCap.
A popular indicator for long-term investors, it signals that the market value is currently 1.72 times its cost base.
Strictly speaking, some might say that the market is overvalued, which is not a mistake in itself.
However, given its historical variations, the market currently looks less overvalued than it did at the beginning of 2021.
The LTH and STH perspective
Let’s take our study further with the help of SwellCycle’s contributions and now look at the MVRV ratios for the two cohorts we often talk about: LTHs and STHs.
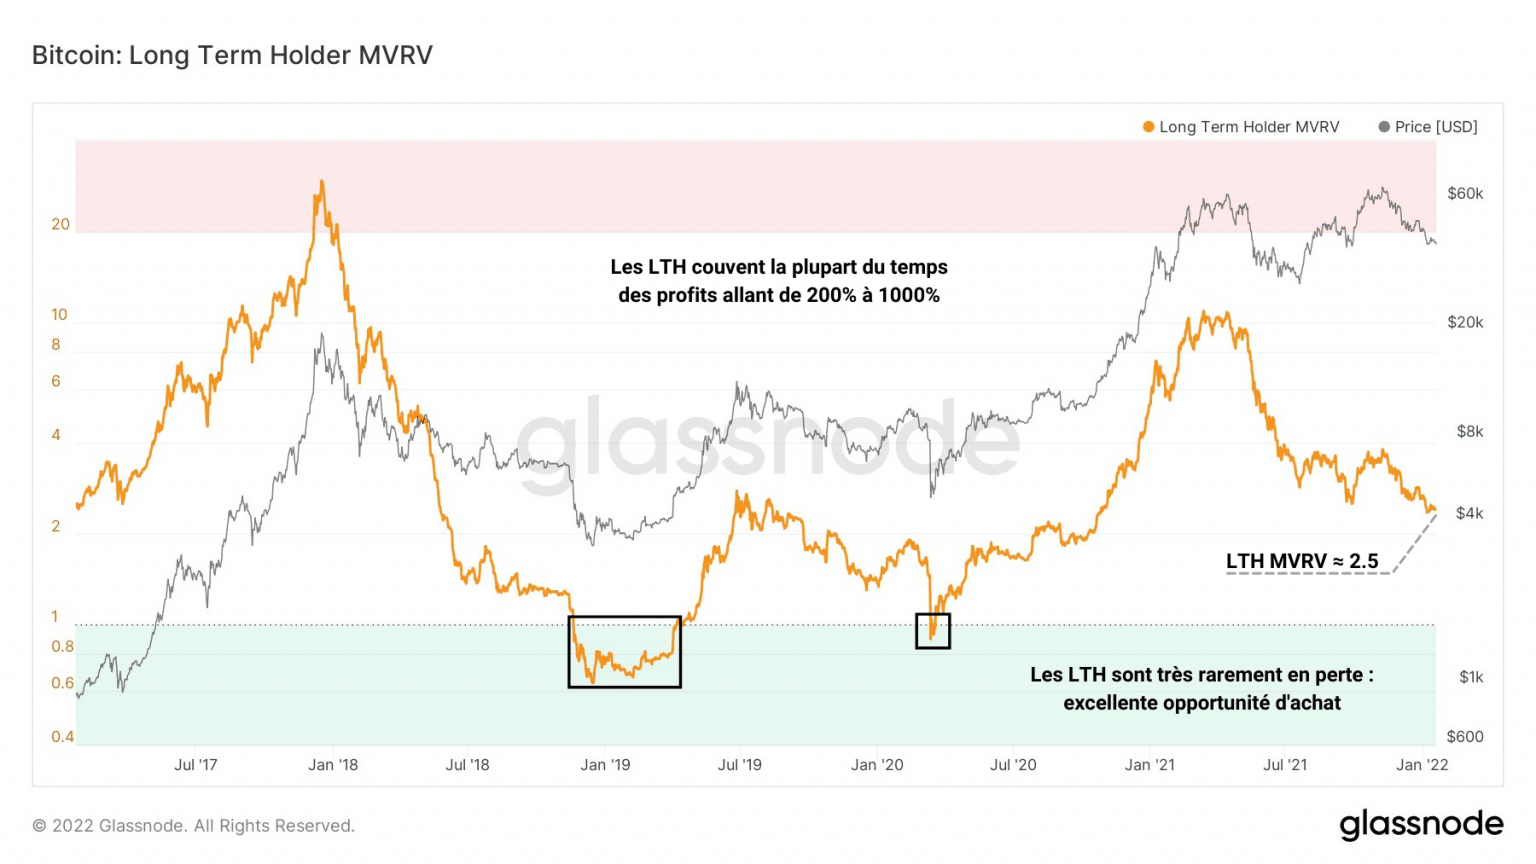
Bitcoin LTH MVRV ratio chart
With respect to LTHs, it can be seen from the high values of LTH MVRV that these entities often retain very large latent gains, ranging from 200% to over 1000%.
Currently, the LTH cost base is 2.5 times lower than the overall market cost base and is around USD 9,700.
From the perspective of these long-term investors, the market does not appear to be excessively overvalued and is close to early 2021 valuation levels.
In terms of the STH MVRV, which is indicative of the market’s valuation from the perspective of short-term investors, the picture is quite different this time and provides some valuable insights.
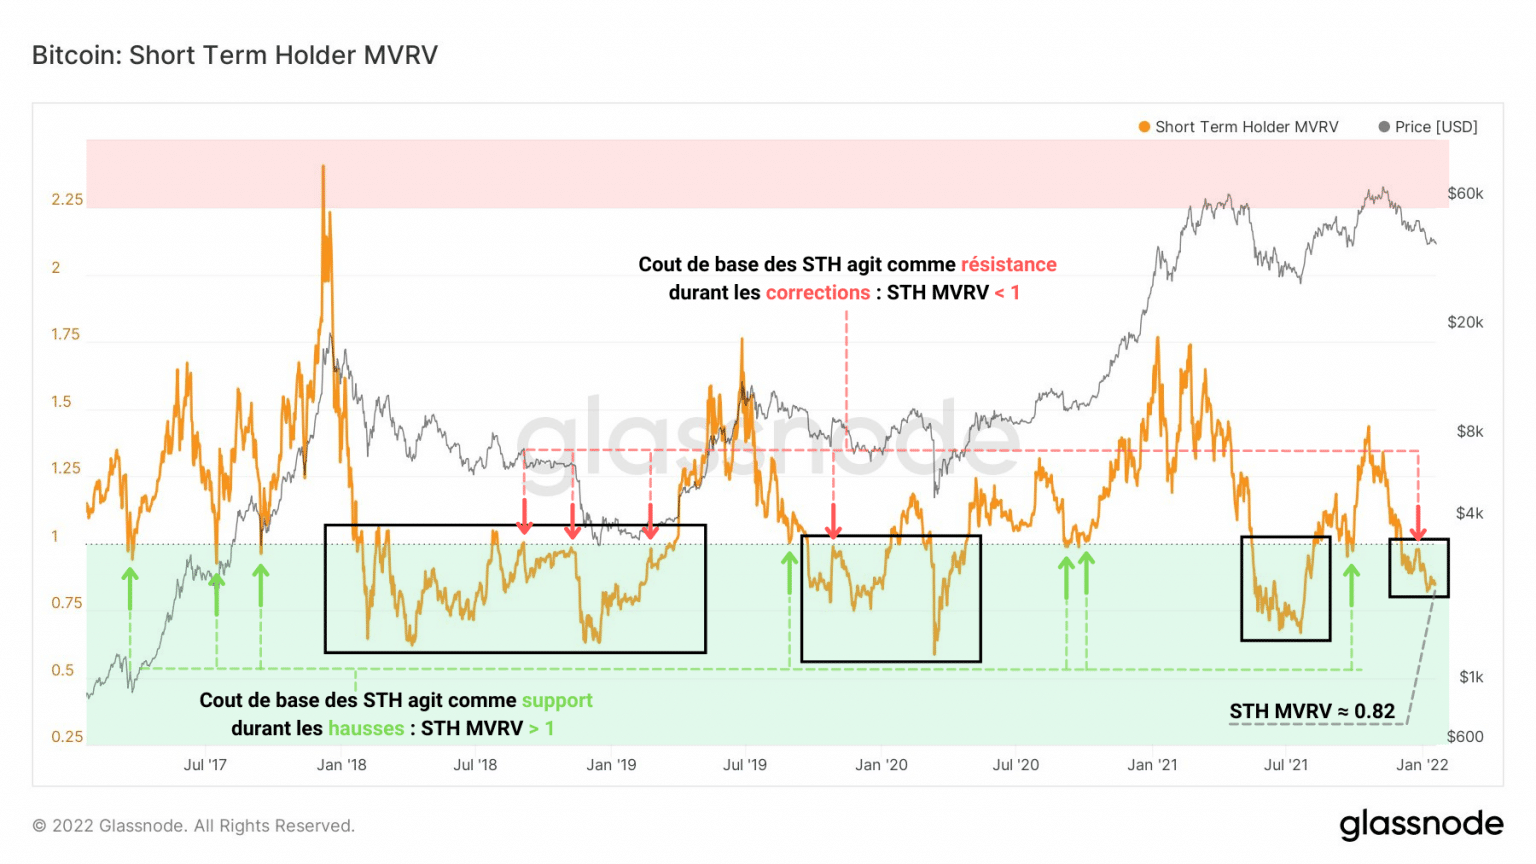
Bitcoin STH MVRV ratio chart
At first glance, it is clear that the cost base of STH is much more often above market value than that of LTH.
In other words: STHs are less often profitable. This has been the case since the loss of the 53,000 dollar support. The ratio has plunged below the neutrality zone (STH MVRV ☺ 1 ) and has forced some participants to take moderate losses.
Moreover, a meaningful behaviour is emerging behind this first observation: short-term price action is driven in part by STH and its break-even point.
During increases, STHs’ cost base serves as a support (red) while they buy new tokens when the price approaches their cost base.
During corrections, STH’s cost base serves as resistance (red) as they sell their BTC as close to their purchase price as possible in order to limit their loss by liquidating their positions.
This is what happened in the last week of December 2021: some STHs took advantage of the bitcoin price rebounding to around $50,000 to limit their losses and wait for a better buying opportunity.
From the perspective of these short-term investors, the market looks slightly undervalued. A sign that the market price is below their cost base, the STH MVRV here indicates a moderate buying opportunity that some LTHs should already be taking advantage of.
Utility value of the Bitcoin network
Finally, having looked at the market from various aspects of its market value, let’s now look at another angle of valuation, from the use of the Bitcoin network.
Introduced by Willy Woo in October 2017, the NVT ratio (NVTR) is calculated by dividing the value of the network (mCap) by the daily volume of dollars transmitted through the blockchain.
As an indicator of network value, it provides a more utilitarian lens by setting aside the financial value of the asset.
Let’s take a closer look at one variation of this indicator: the NVT signal (NVTS). A modified version of the original NVT ratio suggested by Dmitry Kalichkin, it uses a 90-day moving average of daily trading volume in the denominator instead of gross daily trading volume.
This moving average allows the ratio to function as a leading indicator of valuation and provides more identifiable signals than its parent.
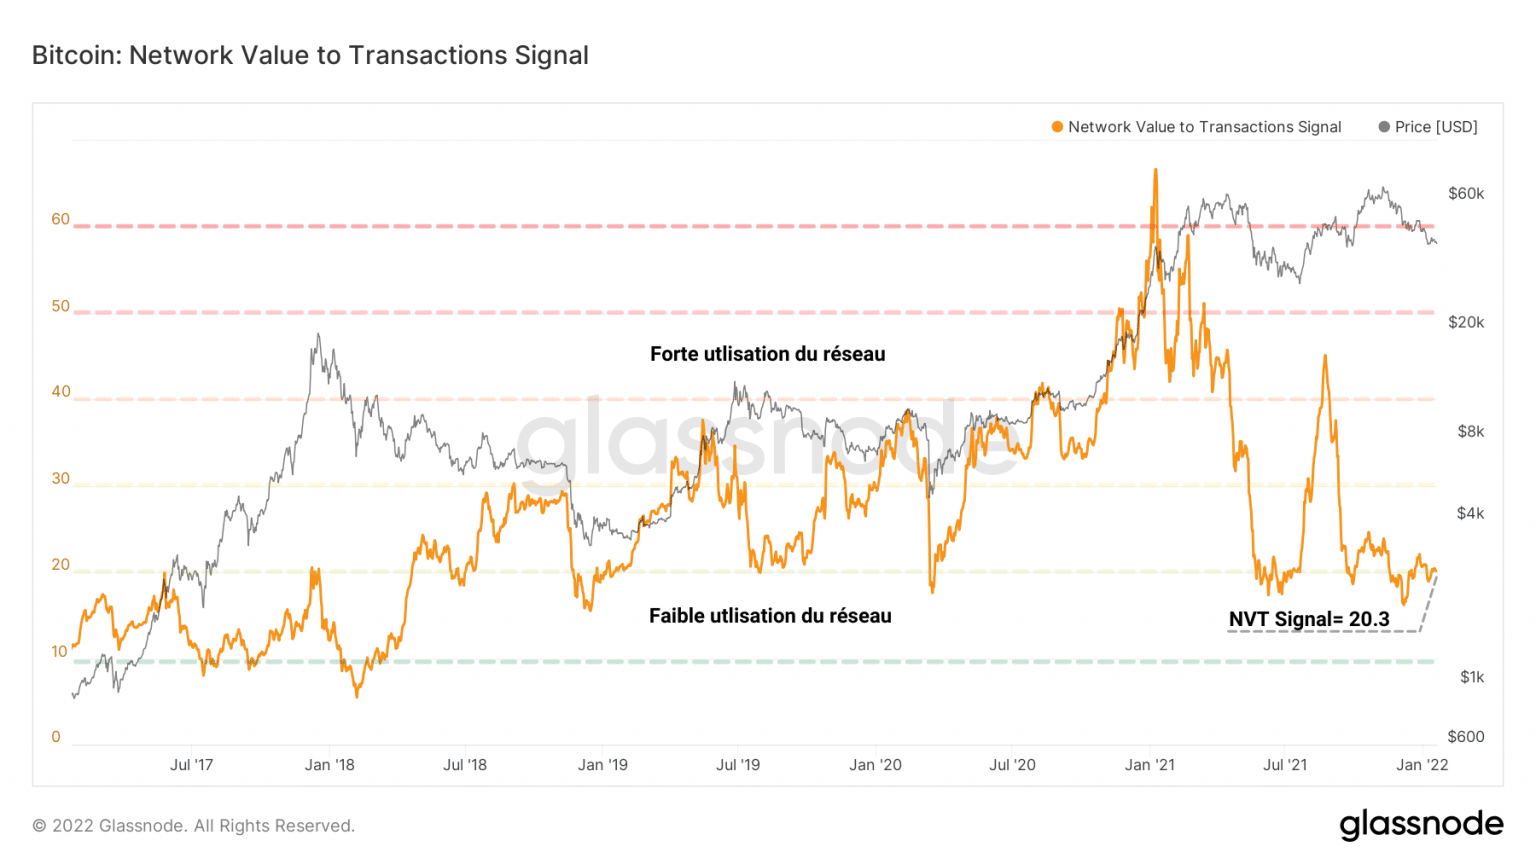
Bitcoin NVT Signal Chart
Currently at the multiple 20 level, the NVTS considers that the current use of the chain does not allow for a high value of the network.
Indeed, as explained last week, despite a growing transfer volume, the Bitcoin network chain is being used by few active entities and the number of transactions made daily is gradually decreasing.
These findings explain why the NVTS is now valuing the network at a level similar to historical capitalisations, despite the price being above the last historical low.
Synthesis
In conclusion, it appears that the market value of bitcoin is slightly overvalued compared to its base hit, although this actually reflects the strength of a growing market.
From the perspective of long-term investors, the market does not appear to be excessively overvalued, while from the perspective of short-term investors, the market is undervalued.
However, the intrinsic value of the Bitcoin network, which is linked to its use, remains rather low despite a growing transfer volume.
The result is that the price of Bitcoin presents promising accumulation opportunities given the current price action and its strong fundamental value.