
After briefly hitting the STH (short term holder) cost base, the Bitcoin (BTC) price is bouncing off the $53,000 support. What is driving this rise? Does it mark the turnaround that many have been waiting for? Check out our on-chain analysis
Bitcoin finds support
The price of bitcoin (BTC) is rebounding. Forming a floor around $53,000, it is trying to break through the weekly ceiling of $59,154.
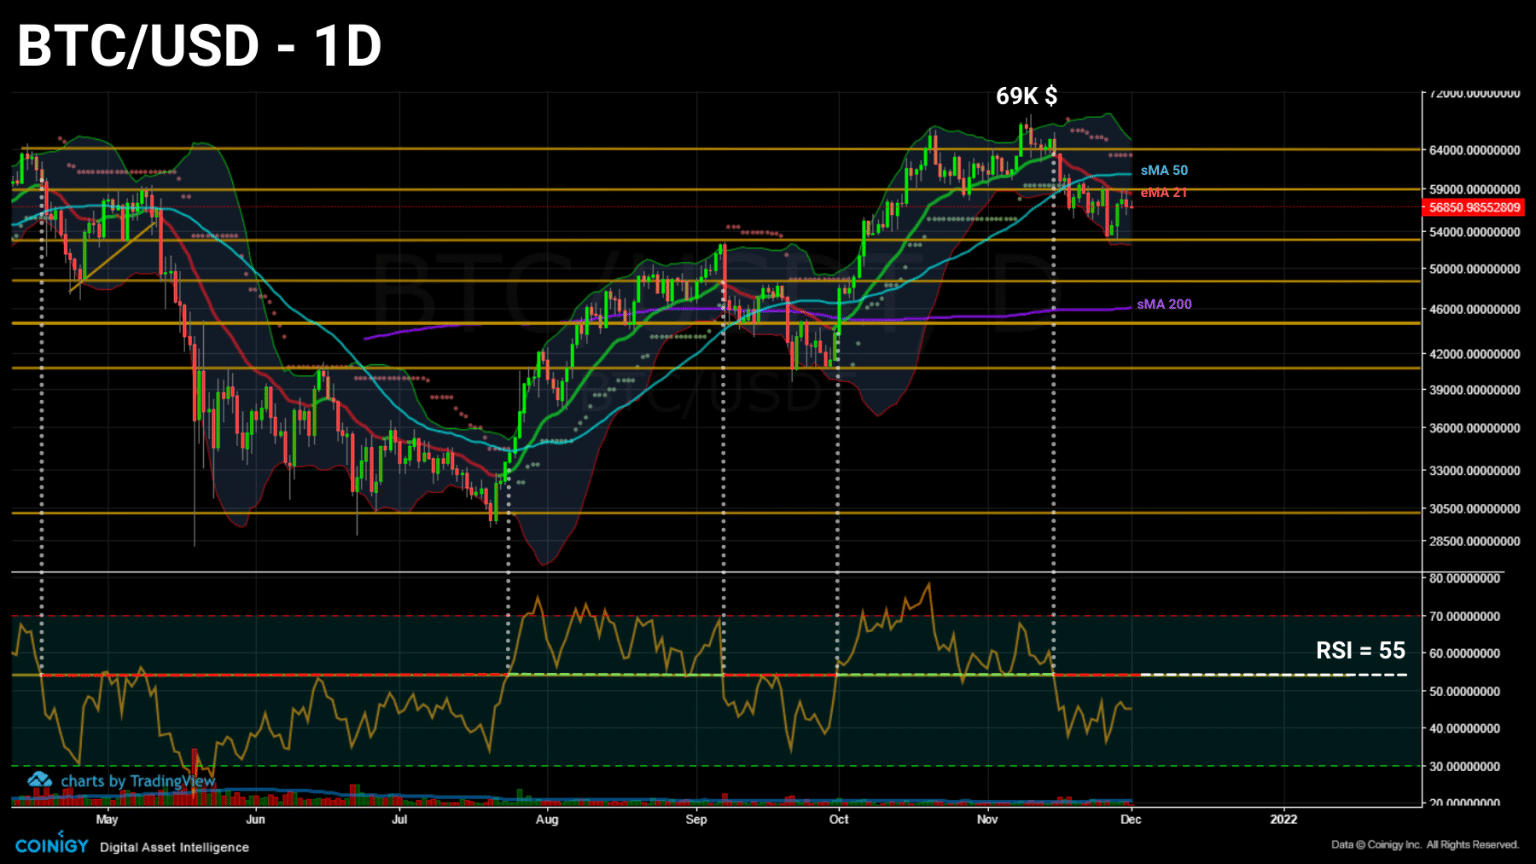
Daily chart of bitcoin (BTC) price (Source: Coinigy)
Continuing to move within the $54,000 to $64,000 volume range, Bitcoin is attempting to move higher despite several resistances in its way.
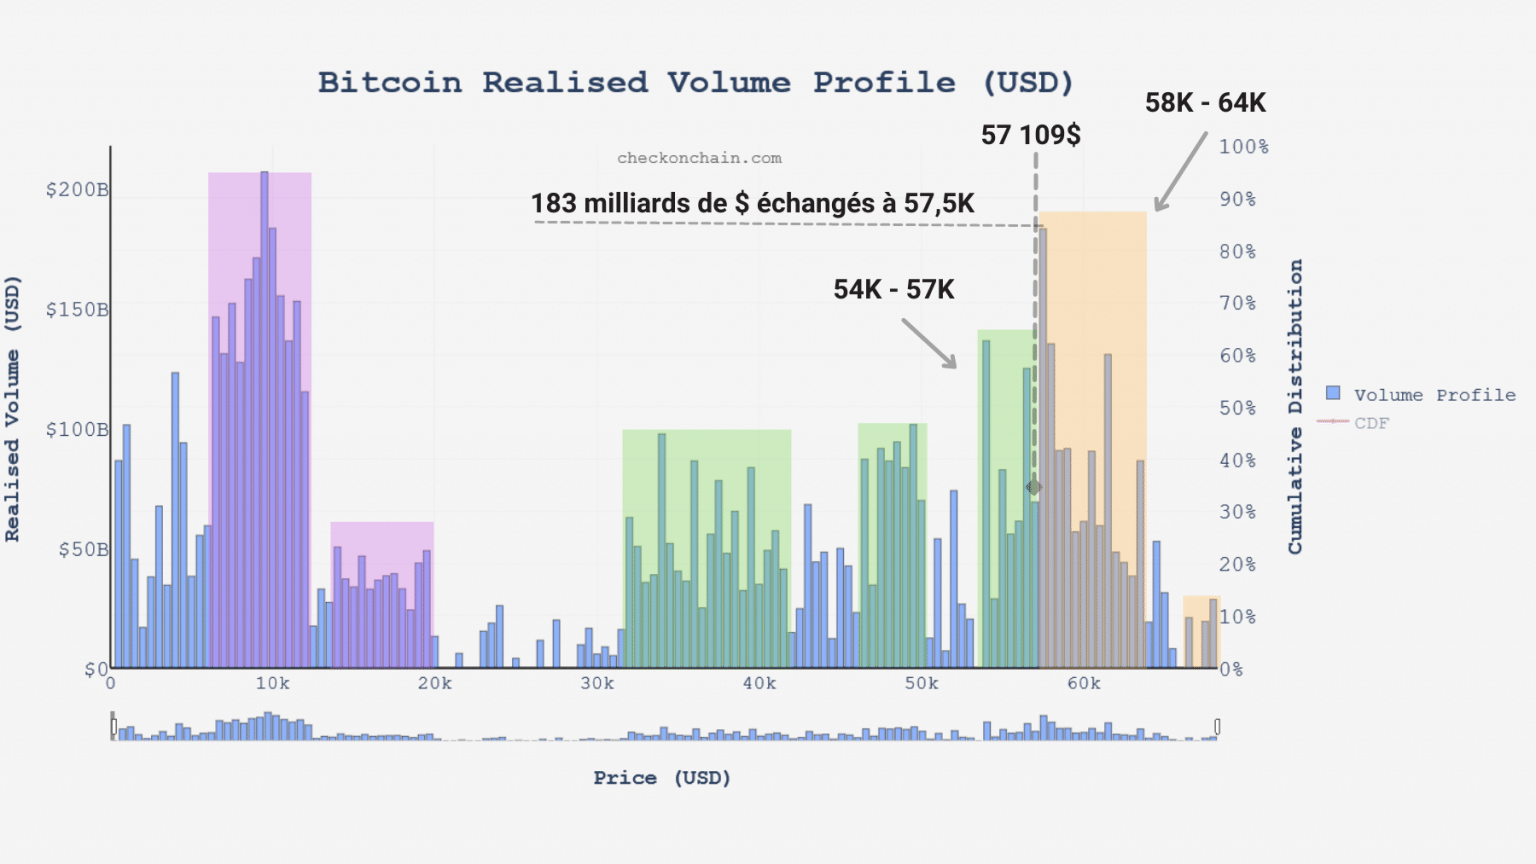
Graph of realized bitcoin (BTC) volume (Source: checkonchain.com)
This week, we’ll take an in-depth look at the profits and losses made by participants to determine if sellers still have a chance to push the bitcoin (BTC) price south as demand shows no signs of abating.
Moderate profits and losses
Let’s begin this study by pointing out a fact that, while it may seem trivial, is of paramount importance when it comes to understanding the psychology of the bitcoin market.
On November 2, the total supply of BTC in profit exceeded a threshold of 95% for the thirteenth time. This phenomenon has been a sell signal several times in the past.
Indeed, when a dominant portion of the assets is incubating latent gains, the incentive to sell becomes stronger the closer the BTC price approaches a new ATH.
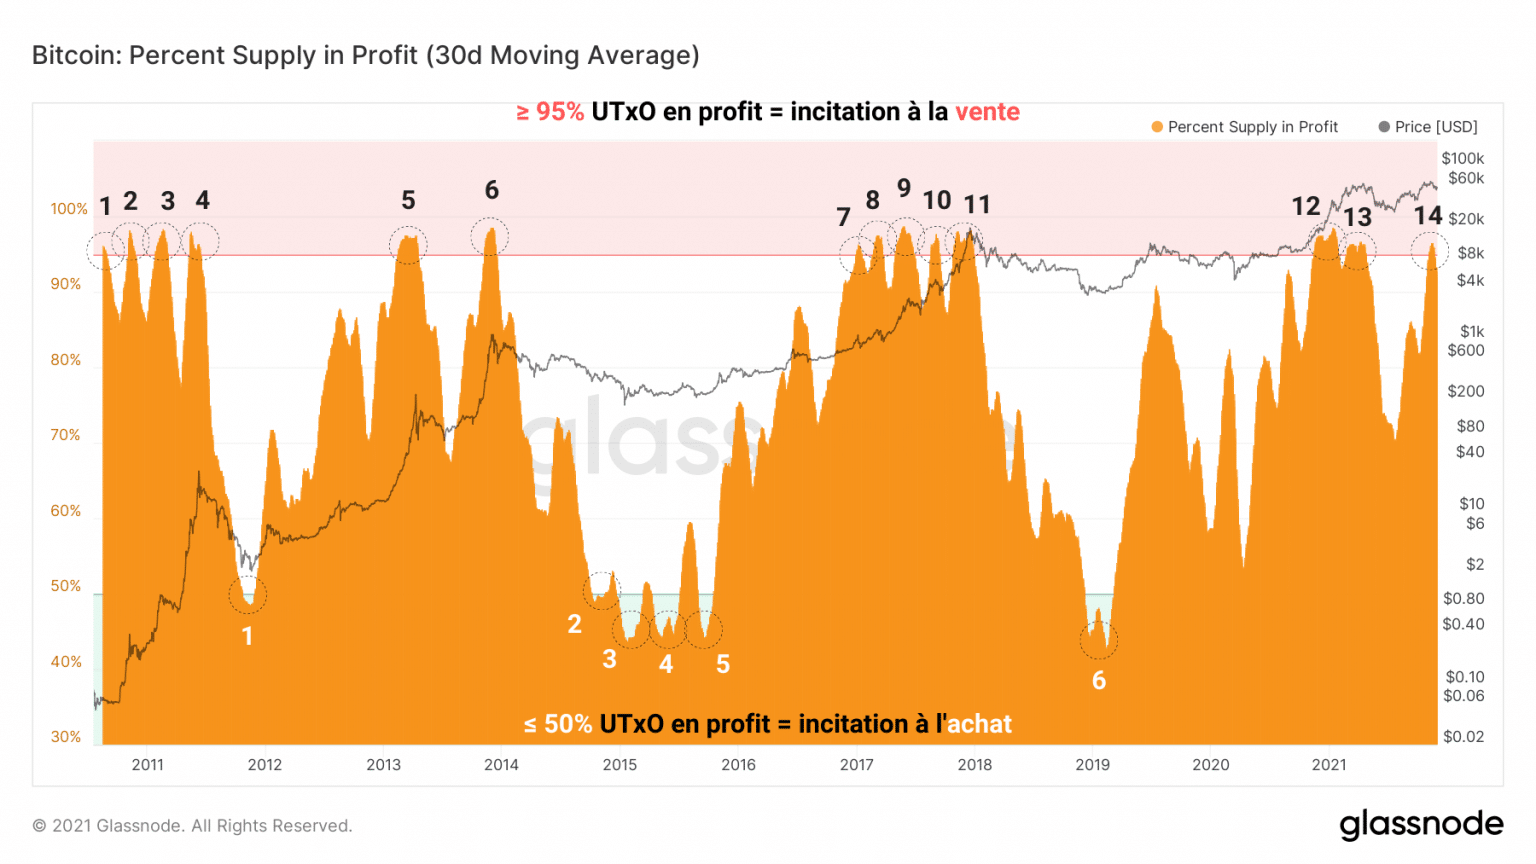
Bitcoin (BTC) Profit Supply Chart (Source: Glassnode)
Conversely, there were 6 occasions when less than half of the outstanding supply was profitable. These occurrences often mark periods of capitulation, an ideal time to accumulate chips at low prices.
Although the market does not appear to have reached the peak valuation of this bull run, the creation of a new ATH has caused some participants to take profits.
This behaviour is clearly apparent on the bitcoin profit and loss chart.
After a peak profit taking in early 2021, realised profits fell drastically during the May correction before resuming a gentle growth in mid-August.
We can then highlight two recent waves of profit taking as BTC printed new highs on November 20 and October 8.
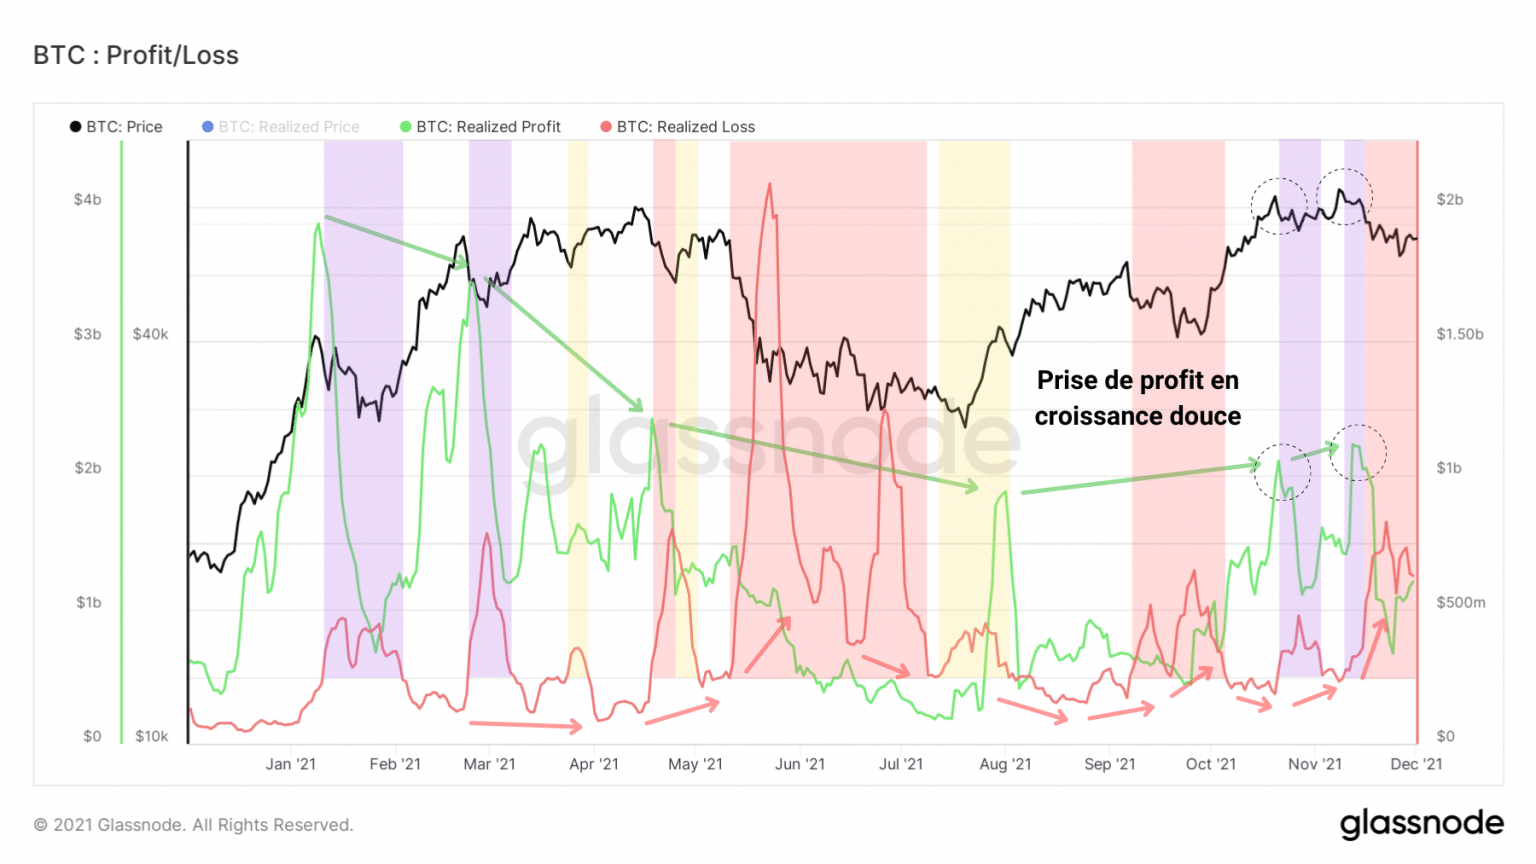
Chart of realized profits and losses of bitcoin (BTC) (Source: Glassnode)
To compensate, each of the recent ATHs has been followed by a correction causing the realization of moderate losses, roughly associated with STHs that, having bought the top, sell at the sight of a red candle.
These periods of loss taking are each associated with a decision:
- Purple: Top buyers part with their chips to limit their loss or buy back lower;
- Red: Increasing loss-taking during a correction, inducing selling pressure on the price and eventually leading to capitulation;
- Yellow: Loss making with the objective of exiting the market. Exhausted participants take advantage of a bounce to sell their chips as close to their base cost as possible.
It is then encouraging to realise that, despite these cumulative selling pressures, the aSOPR, the overall expense profitability ratio, remains above its neutral zone.
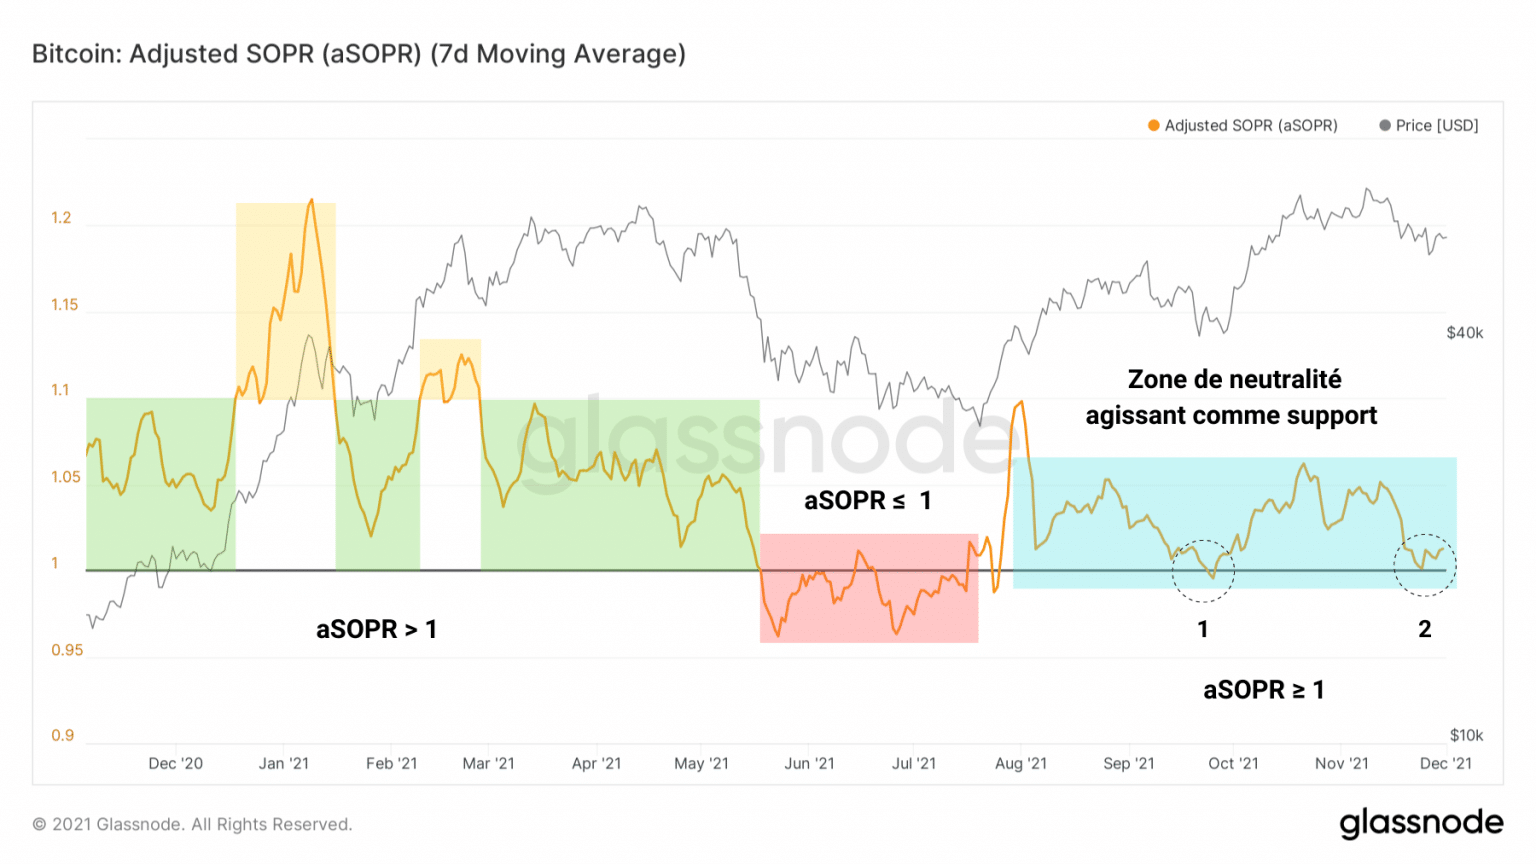
Graph of bitcoin (BTC) aSOPR (Source: Glassnode)
To put it plainly: the overall market spend was slightly profitable and only some STHs suffered enough from this correction to part with their tokens.
The rebound in aSOPR is exactly what we expected from this indicator during a base build above 1.
Look for a potential acceleration in this ratio in the future, which signaled the entry into a moderate profit-taking phase (phase B) of the market.
Sellers are getting away with it
Now let’s look at the health of the sellers. We can see without surprise that they are experiencing a relatively calm period since November 9 with liquidation amplitudes less and less large.
It was not until the recent $53,000 support that we saw a daily liquidation amount above 25 million.
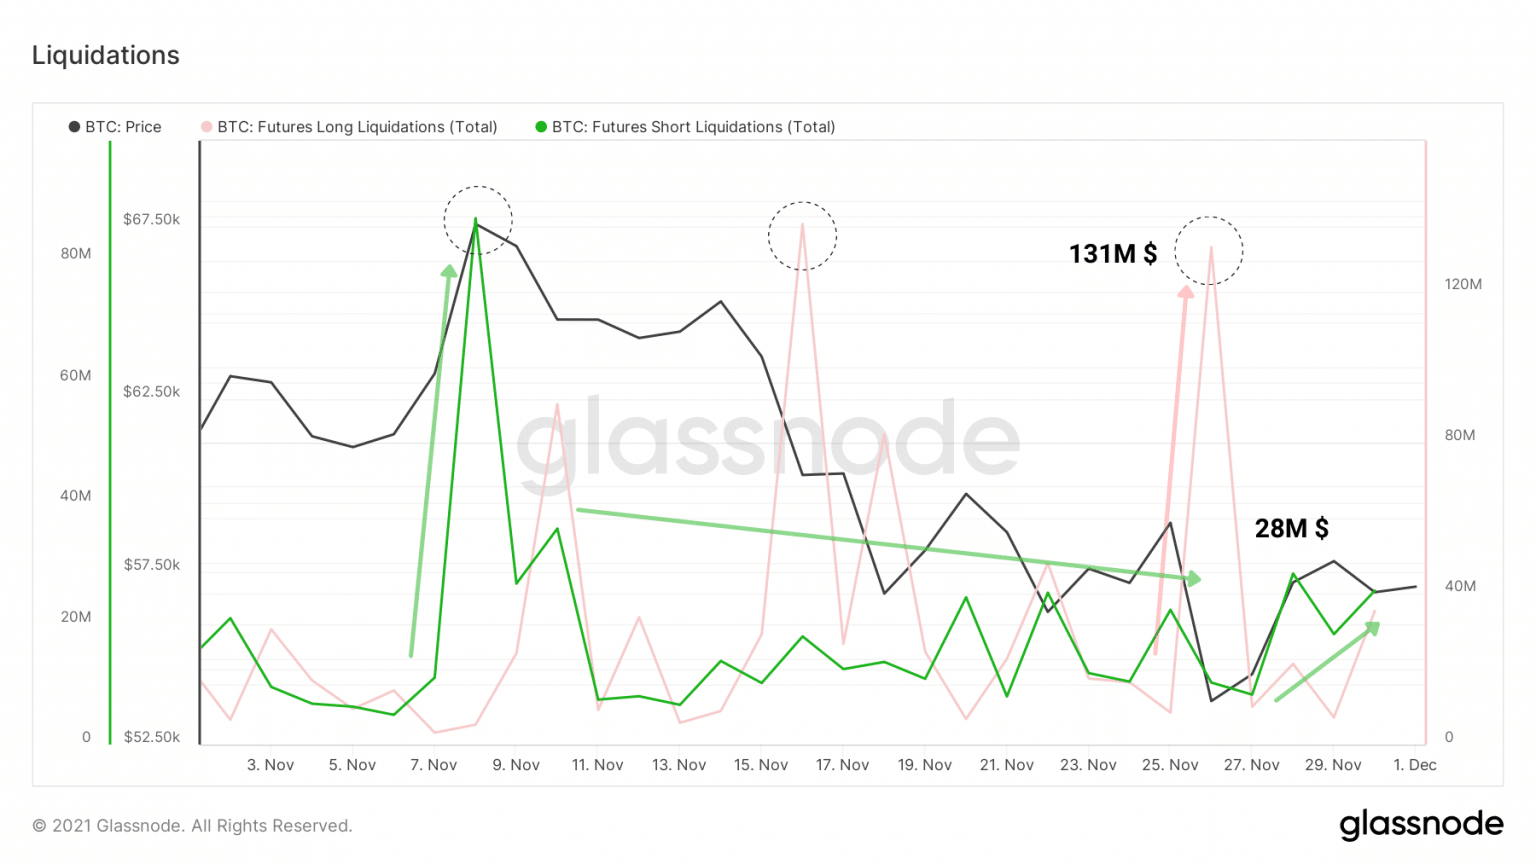
Chart of bitcoin (BTC) short liquidations (Source: Glassnode)
This figure is actually quite low, so we can assume that some sellers had already closed their positions when Bitcoin started its rebound.
Nevertheless, these forced purchases, coupled – as we will see below – with strong spot demand were the main drivers for the BTC price to return above $57,000.
TheKingFisher testifies to this and points to the fact that these short liquidations were in part driven by Coinbase.
What’s more, the seller exhaustion constant suggests that the low point of this correction is near – if not already reached.
This indicator, developed by Ark Invest, is obtained by dividing the percentage of supply in profit by the monthly average price volatility.
It detects the coincidence of two factors: low volatility and high losses, or, in other words, low-risk lows.
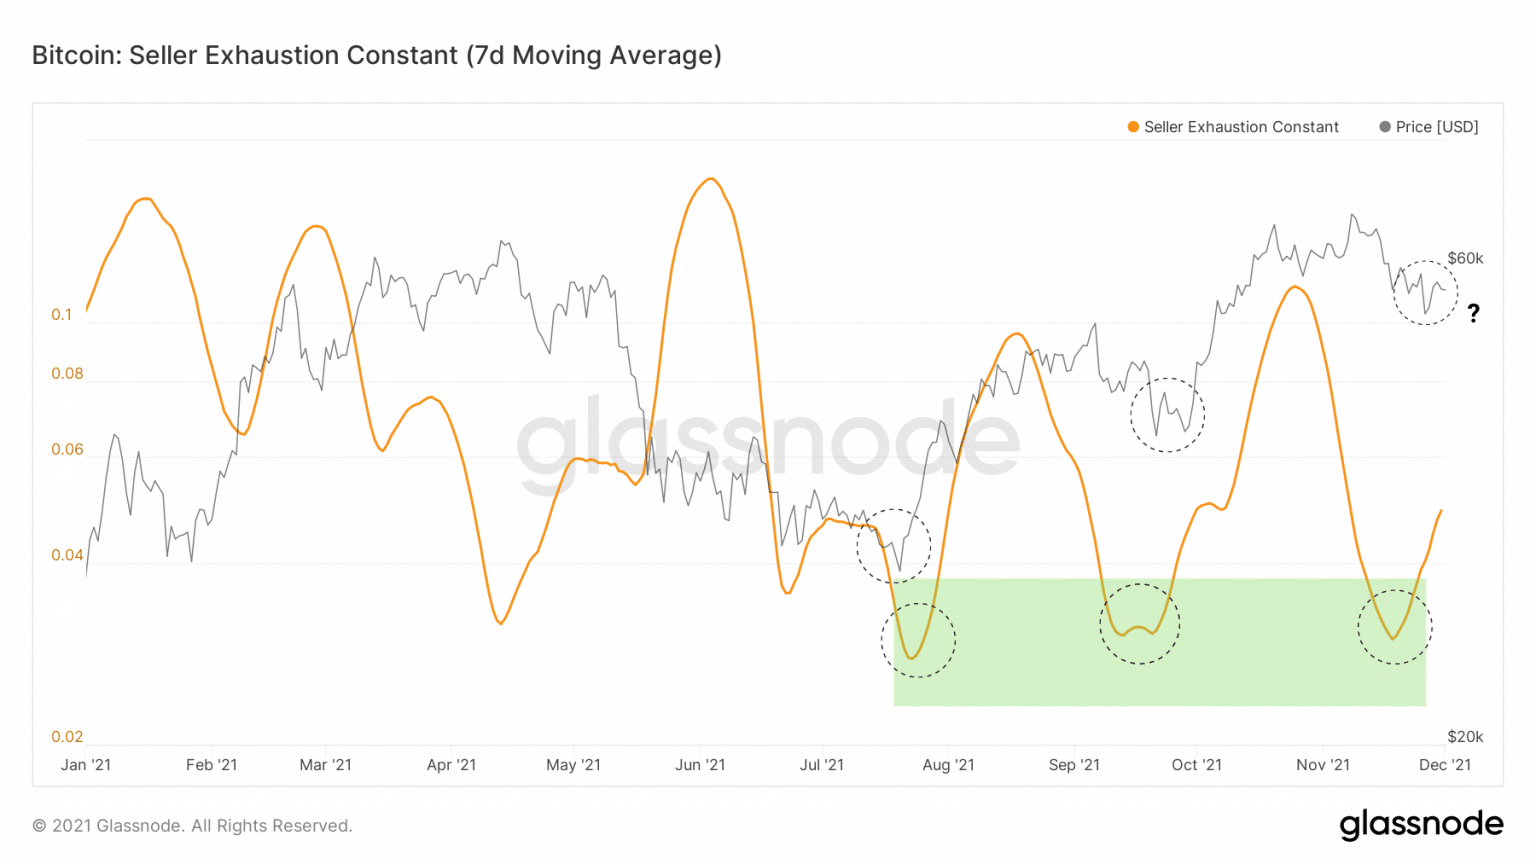
Bitcoin (BTC) seller exhaustion chart (Source: Glassnode)
Although only partially applicable in the current case (high volatility and high losses), this metric has been particularly useful in signaling short-term lows since late July.
Each time its value fell below 0.035, the constant identified, within a few days, a buying opportunity.
Combining these observations with the fact that the BTC price has just rebounded from the realised STH price, which is considered the short-term cost base of the market, it is safe to say that this correction is likely to be over or to turn into a range.
However, this assertion from on-chain data analysis is an argument that needs to be corroborated by technical evidence.
Thus, before confirming this thesis, it would be appropriate to observe:
- further short liquidations over the next few days;
- the reintegration of the eMA 21 which has served as resistance to this rebound;
- a stabilisation of the BTC price above $60,000.
Sustained spot demand
Now let’s take a step back to remind ourselves that the market has been undergoing an unprecedented change in structure since March 2020.
As demonstrated in a previous analysis, the trading vaults, the markets’ reservoirs of liquidity, have been falling steadily since March 2020.
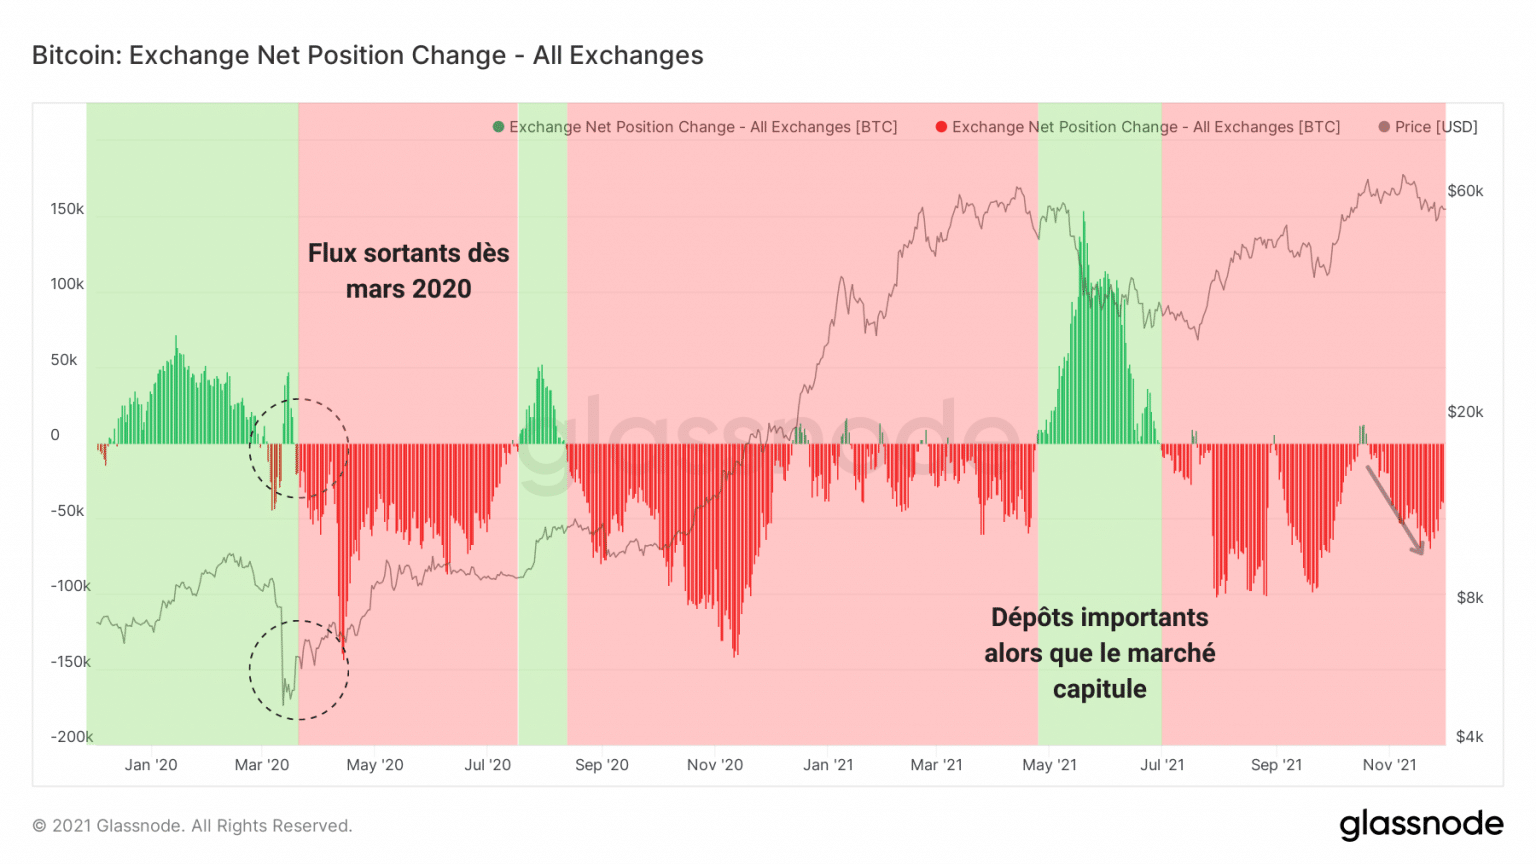
Chart of the change in the net position of exchanges (Source: Glassnode)
Although a slight deposit phase has been taking place on the exchanges since Saturday, the overall liquid supply dynamics unequivocally indicate the presence of sustained spot demand, a sign of a paradigm shift by participants, stemming from HODLing behaviour.
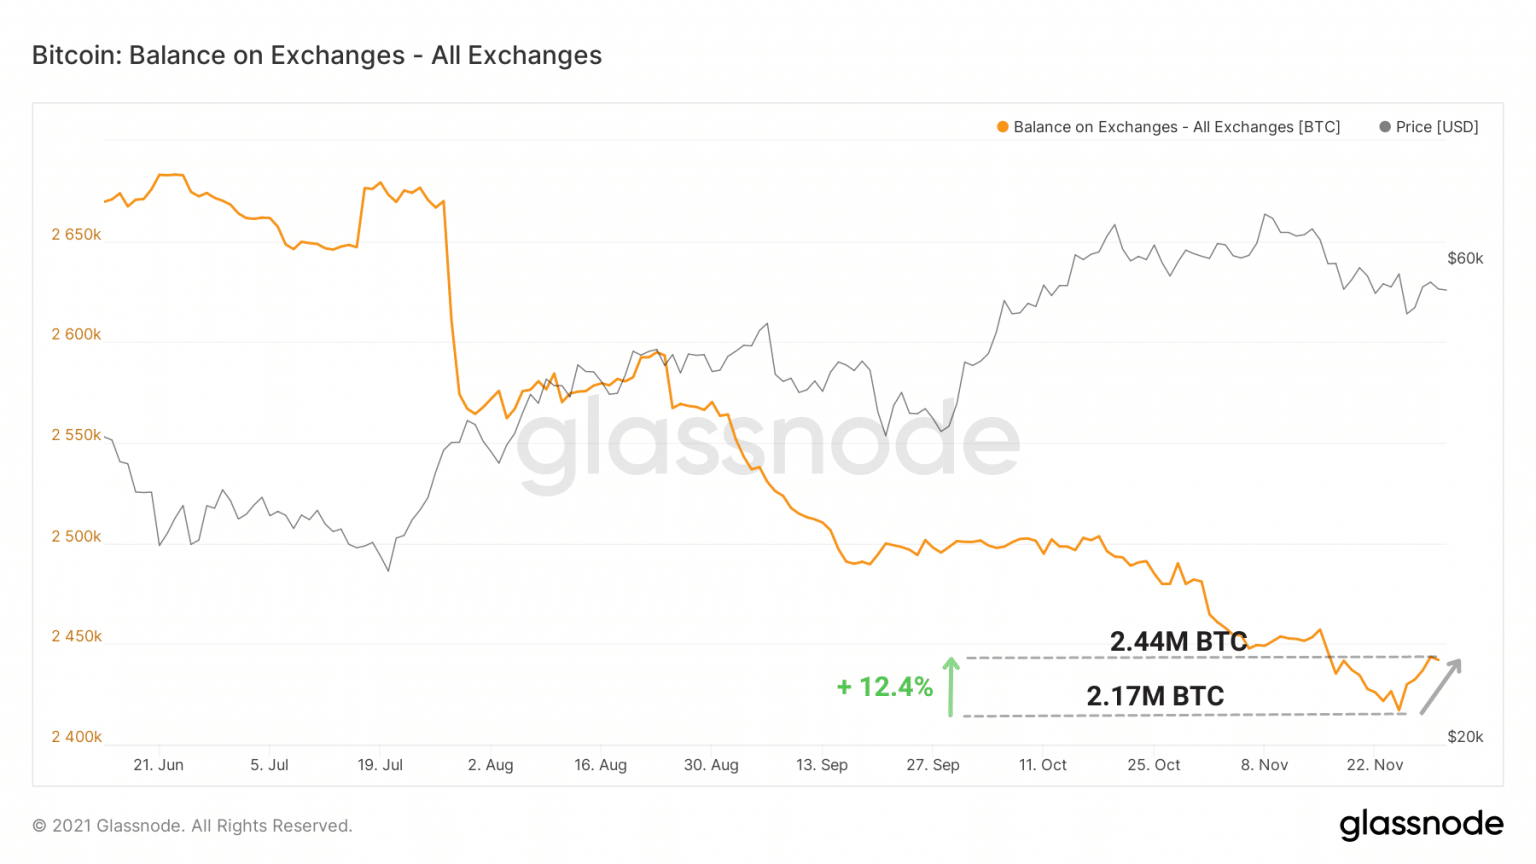
Graph of Bitcoin (BTC) exchange reserves (Source: Glassnode)
As tedtalksmacro points out, citing MaterialScientist data, a huge buy order above $53,000 acted as a wall against potential stop loss chasing red wicks.
This confirms that there is still strong spot demand from investors and even institutional investors with the recent purchases of MicroStrategy and El Salvador.
Thus, despite the volatile price valuation in the markets, a basic trend is emerging that this correction cannot stop.
As Bitcoin becomes less and less liquid and crystallises as it matures in the cold storage of long-term investors, its fundamentals are developing as the network and the market grow.
Synthesis
Finally, it seems that the bitcoin (BTC) price has found a strong support zone at the $53,000 level that could be tested again in the coming days to confirm a low point.
Based on our observations, we can say that:
- The profits made by LTHs around the ATH have pushed some STHs to make losses during the recent decline;
- Sellers are holding strength although the correction low is likely to be confirmed;
- Strong spot demand, accompanied by HODLers holding on to BTC tokens is allowing the price to maintain momentum.