: Are we still in a bear market?")
As the market continues to seek liquidity in derivatives markets, some claim that we are still in a bear market. In order to question this allegation, we propose a definition of the terms “bull market” and “bear market” taking into account various parameters of technical and on-chain analysis.
Bitcoin, where does it stand now?
The price of BTC continues to oscillate on the low side of the $25,000 level and continues to seek liquidity on derivatives markets, forcing the closing of many long and short positions.
While the bullish rally of 2023 seems to be repeating the momentum of 2019, some are claiming that we are still in a bear market. In fact, they claim that this is “the longest bear market on record”, with a duration of more than 500 days.
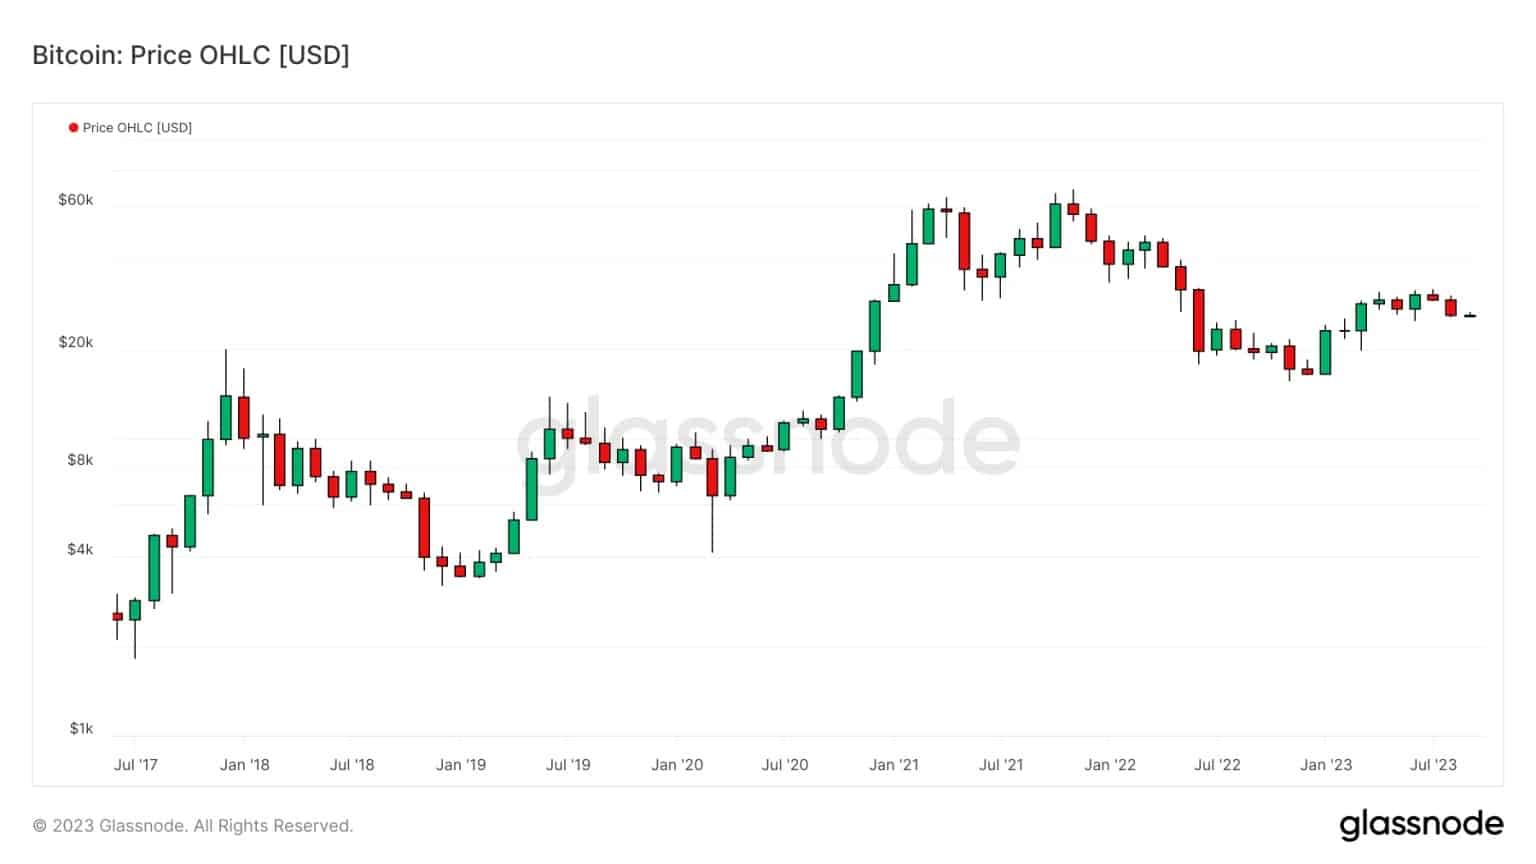
Figure 1: Daily BTC price
In order to question this allegation and determine the current market situation, we will today propose a definition of the terms “bull market” and “bear market” taking into account various parameters of technical and on-chain analysis.
The technical definition
One definition of bull and bear markets commonly used by technical analysts is as follows:
- Bull market: period during which the spot price remains above the 200-day moving average (in blue).
- Bear market: period during which the spot price remains below the 200-day moving average (in red).
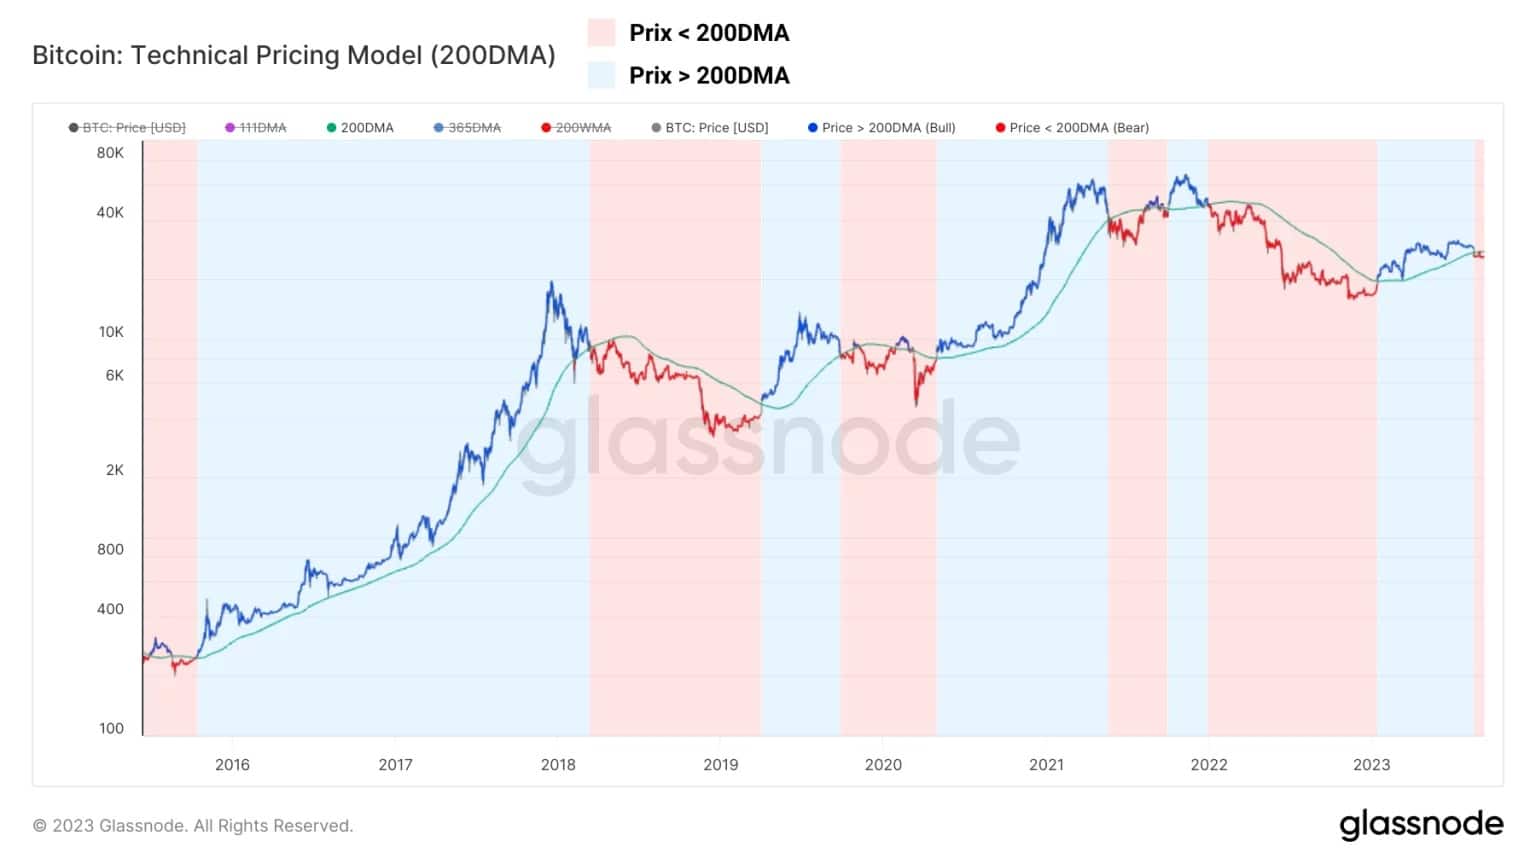
Figure 2: BTC daily price and 200-day moving average
Using this framework, we can reproduce a classic technical model and come to the conclusion that the BTC price entered a bear market (in red) when the $29,000 level was broken.
The BTC price would then have to break above the 200-day moving average, currently around $29,000, to signal the start of a new bull market.
On-chain activity
Taking into account on-chain data to define bull and bear market periods allows us to base our reasoning on the behaviour of participants, to obtain a more nuanced view and more precise indications.
By analysing on-chain activity, for example, we can define a simple framework:
- Bull market: a period of strong and sustained growth in address activity (orange). This period is characterised by a high level of interest and commitment on the part of channel users, who make visible demands on the network.
- Bear market: period during which address activity registers a continuous fall and low values. This period is characterised by low interest and commitment from channel users who make little use of the network.
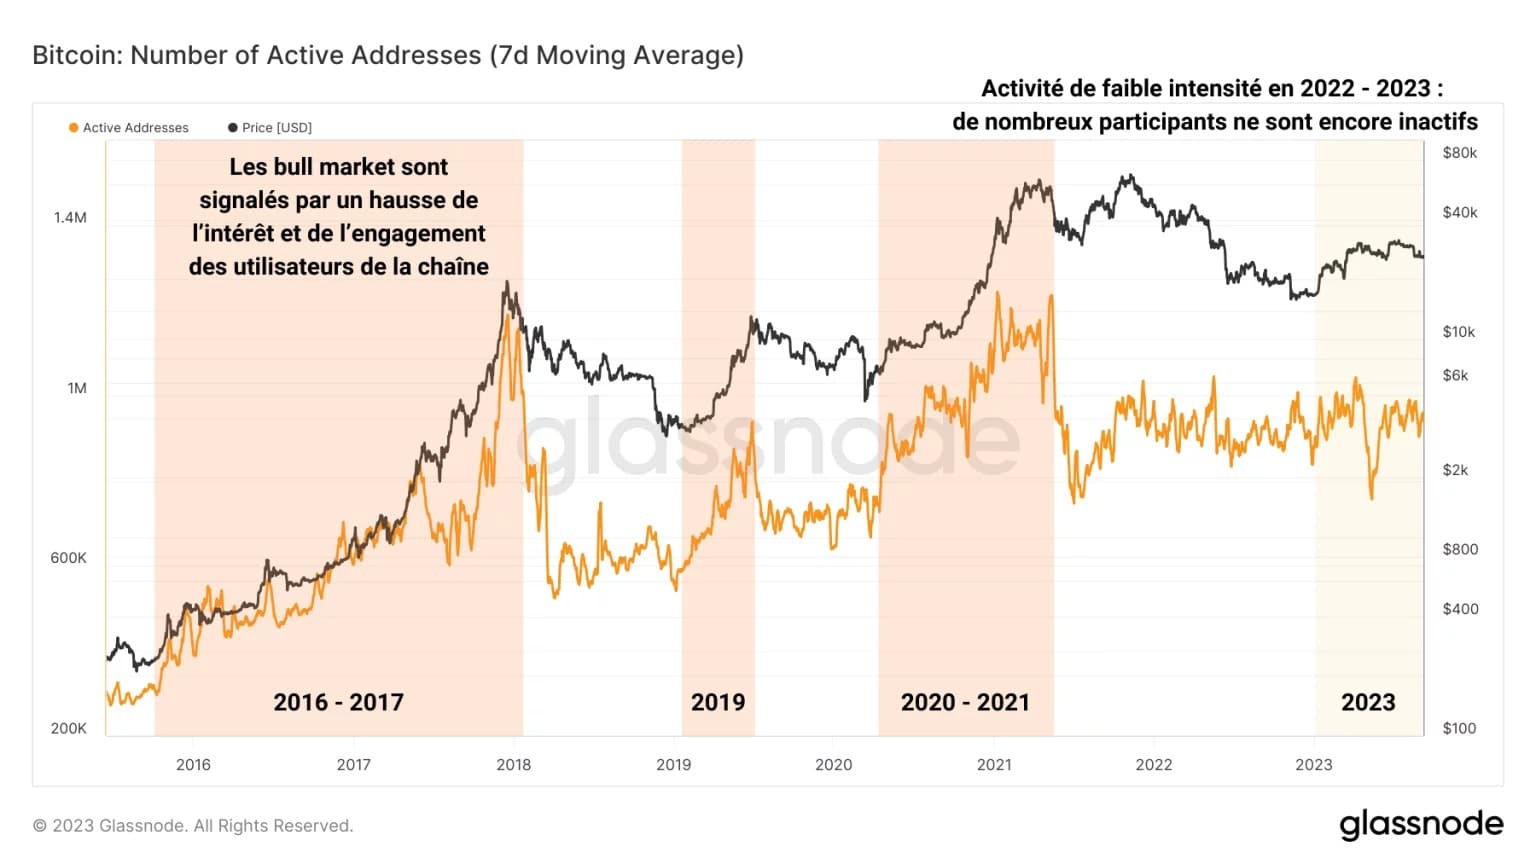
Figure 3: Active Bitcoin addresses
Using this framework, we can say that, from the point of view of on-chain activity, the current period resembles a bear market context, with low intensity activity, and relatively low values compared to previous bullish cycles.
Saving/spending behaviour
Another dimension of on-chain analysis that can help answer our central question is the study of saving and spending behaviour by tracking the percentage of supply in circulation that is more than one year old.
Historically, prolonged falls in the percentage of supply in circulation with an age of more than one year indicate that significant spending and rejuvenation behaviour is at work. Conversely, prolonged increases in this metric indicate that saving and HODLing behaviour is taking place.
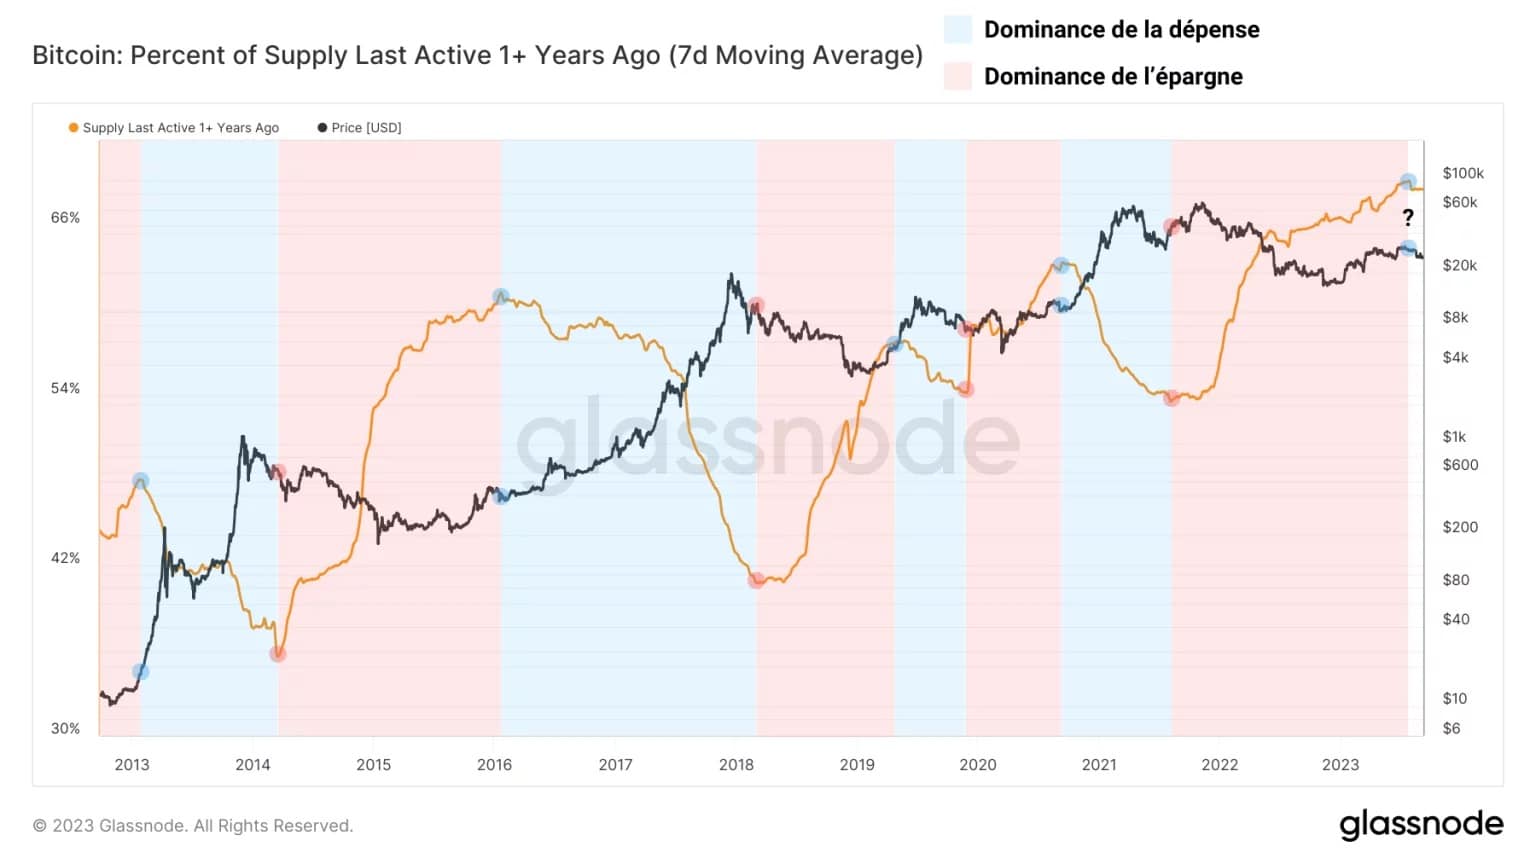
Figure 4: Percentage of supply in circulation older than one year
Here, we can define the following framework:
- Bull market: period of rejuvenation when spending dominates. Old BTC are put back into circulation and often sold to new entrants, generating a substantial profit.
- Bear market: period of low rejuvenation. Savings dominate while BTC mature in portfolios. HODLers accumulate as prices fall, increasing buying pressure.
Using this framework, it currently appears that the dominance of savings is about to end, potentially giving way to massive spending behaviour over the next few years.
Market profitability
Using the statistical analysis method introduced in our last analysis of the MVRV ratio (see glossary), we can measure changes in the profitability of the BTC market in order to put the current context into historical perspective.
The chart below highlights the periods of high profit or high loss that punctuate market dynamics. It can be analysed using the following framework:
- Bull market: period of growth in market profitability ranging from extreme bearish deviation (large latent loss) to extreme bullish deviation (large latent profit).
- Bear market: period of falling market profitability from the historical average (average profit) to the extreme bearish deviation (large unrealised loss).
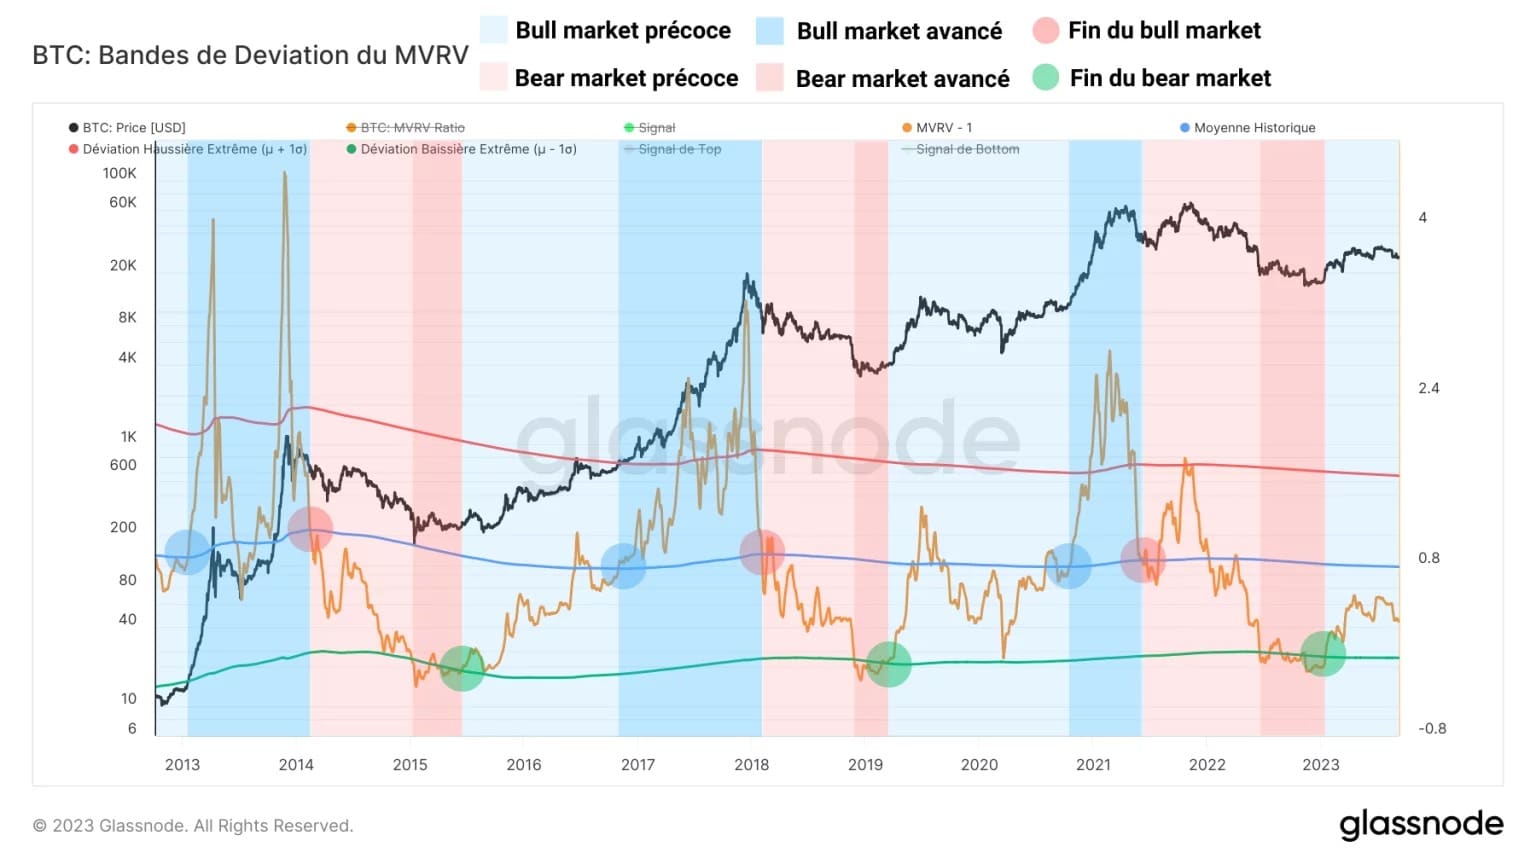
Figure 5: MVRV ratio deviation bands
Here too, on-chain data indicate that the market is in an early bull market, following the exit from a state of latent loss recorded between July and December 2022.
Note, however, that the market’s current profitability is still below its historical average, suggesting that we are in the early months of a bull market that could take several years to fully unfold.
Summary of this on-chain analysis of Bitcoin
The study of the different definitional models of “bull market” and “bear market” suggests that the term “bear market” is not particularly appropriate for the current state of the market.
Putting together the different definitions of these terms, two definitions based on the on-chain data presented in this analysis could be:
- Bull market: a period of strong growth in address activity and transaction fees, accompanied by sustained spending and rejuvenation behaviour, in which market profitability and profit taking increase over a sustained period.
- Bear market: period of low address activity and reduced fees, accompanied by saving and HODLing behaviour, in which market profitability and profit taking fall, giving way to considerable loss taking.
Given the various parameters mentioned above, it seems that the BTC market is currently in a period of gradually increasing profitability and profit-taking.
On-chain activity remains insufficient, however, and the spending and rejuvenation characteristic of advanced bull markets is also absent for the time being.
Finally, we can say that the market is in a state of early bull market, serving as a transition between the end of the bear market of 2021 – 2022 and the future advanced bull market that will emerge once all the conditions presented in this analysis have been met.