
BTC has converted the $24,000 resistance into support and reached $28,000. Can we say that the bear market is over? To answer this question, today we conduct a broad spectrum study of the BTC market. On-chain analysis of the situation
Bitcoin pushes towards $28,000
The past few weeks have been emotional for BTC market participants. Between the failure of three cryptocurrency-friendly banks, the fall of US stocks and the push of the Bitcoin (BTC) price towards $28,000, the industry news has been very eventful.
While BTC has converted the $24,000 resistance into support and reached the price targets mentioned in the Week 7 on-chain analysis, the question now is whether the uptrend has taken hold in a sustainable manner: is the bear market over?
To answer this question, we will look at the market today from several angles, including:
- latent and realized returns of participants;
- the on-chain activity of the Bitcoin network;
- accumulation/distribution behavior.
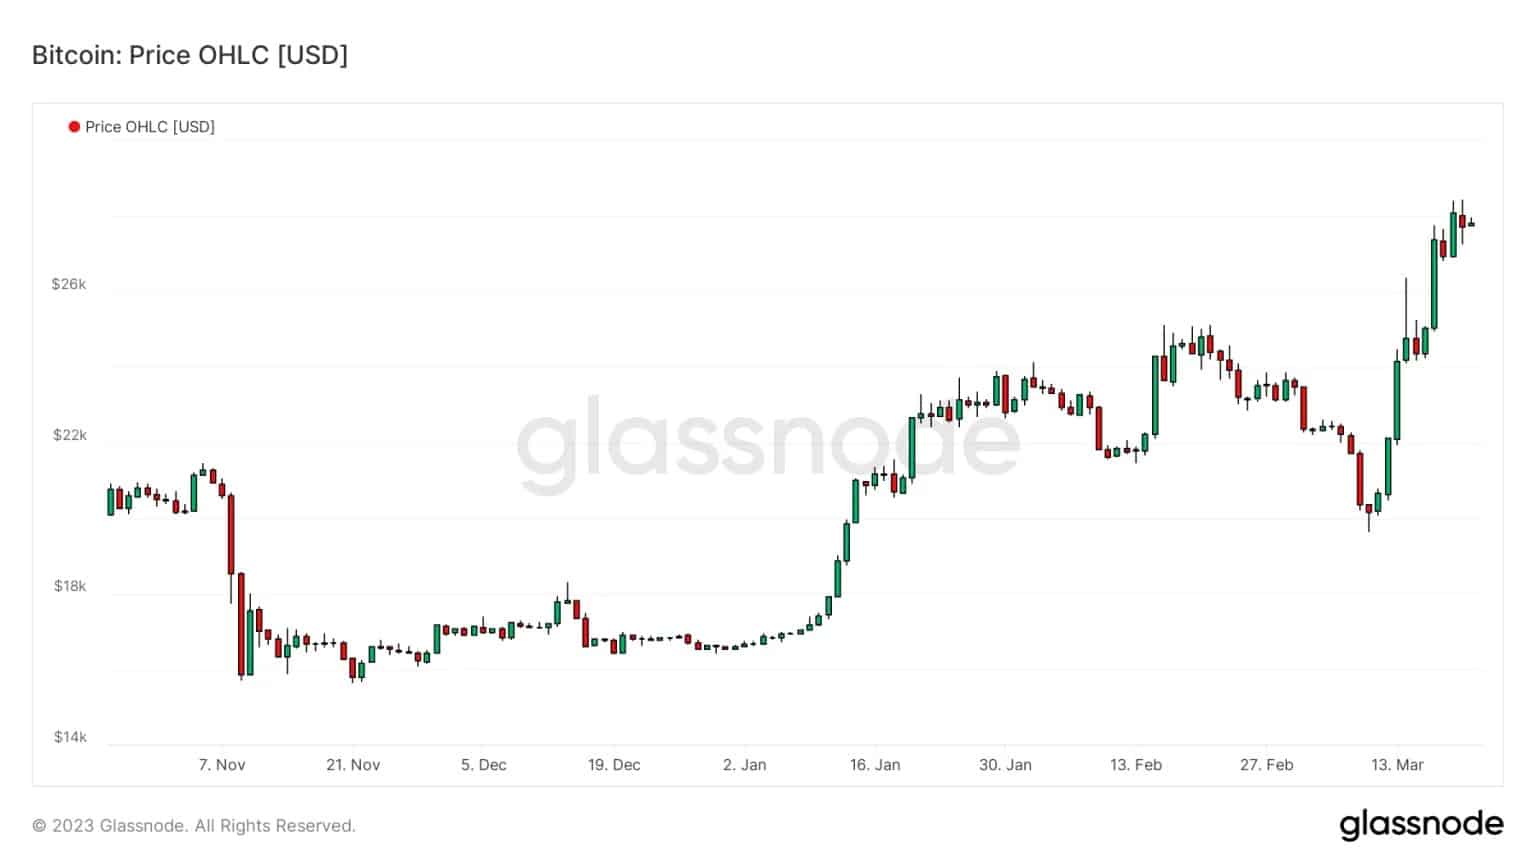
Figure 1: Daily BTC price
BTC market profits return
Latent profitability, held in the BTC profit/loss supply, is a great way to estimate where we are today. Each end of a down cycle is marked by a sharp improvement in market profitability and signaled by a rapid increase in the amount of BTC in profit.
At the moment, the current cycle is perfectly replicating this dynamic, visible in blue below. The month of January recorded the largest increase in the percentage of supply in profit since the end of 2021.
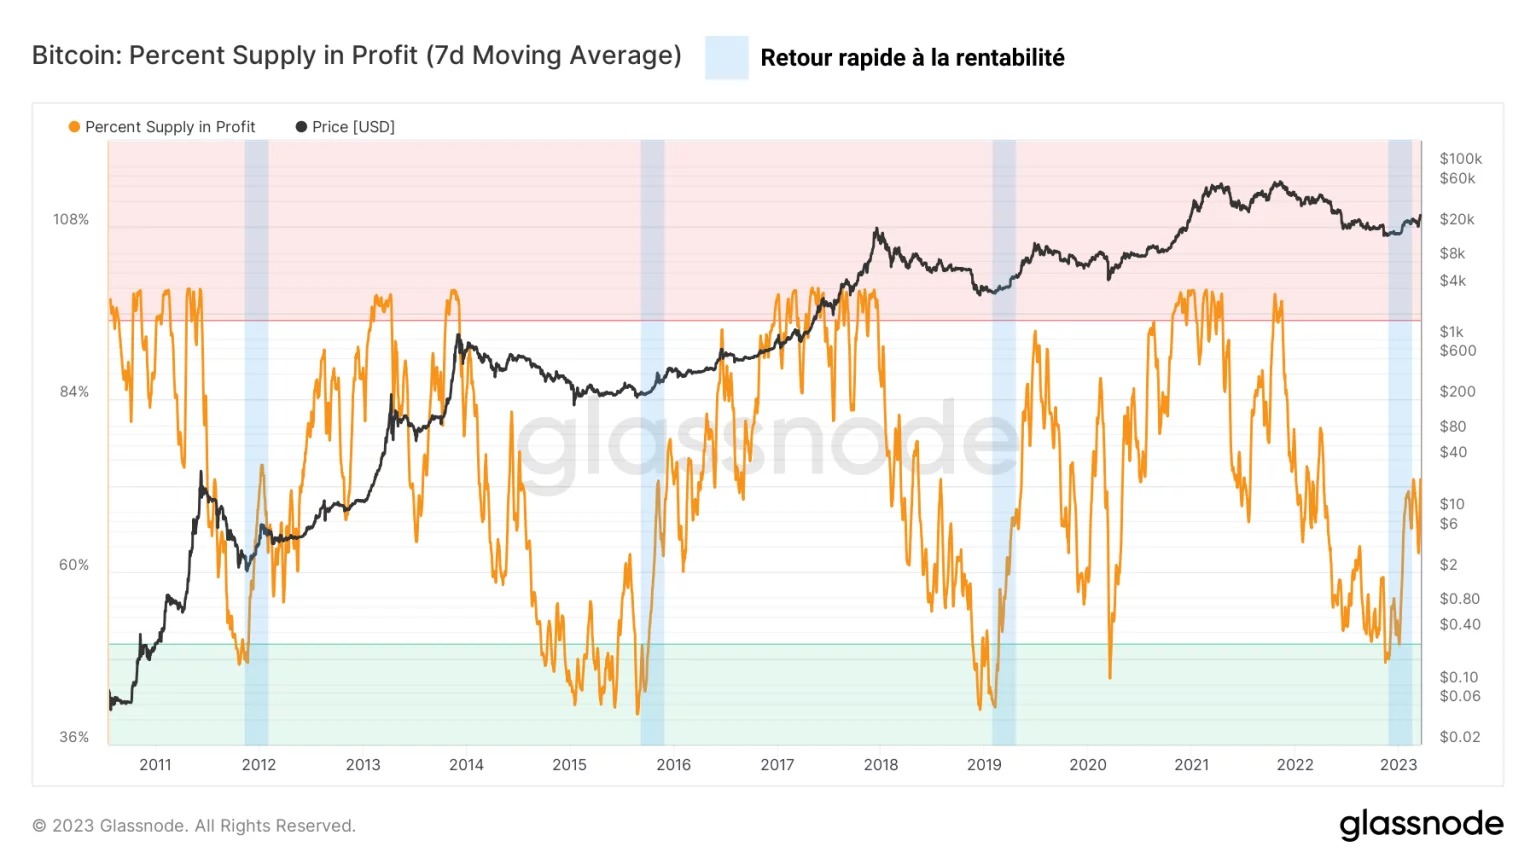
Figure 2: Percentage of BTC supply in profit
This strong return in supply profitability occurs at the end of every bear market and historically favors a long-term bullish bias.
An improvement in the profitability of BTC in circulation is an incentive to take profits. Therefore, the dominance of profit-taking/loss can be used to identify periods when the bias is bullish/bearish in the BTC market.
In order to verify that this does not only apply to BTC and that it is indeed the whole market that is trending upwards, I have recently designed the following chart:
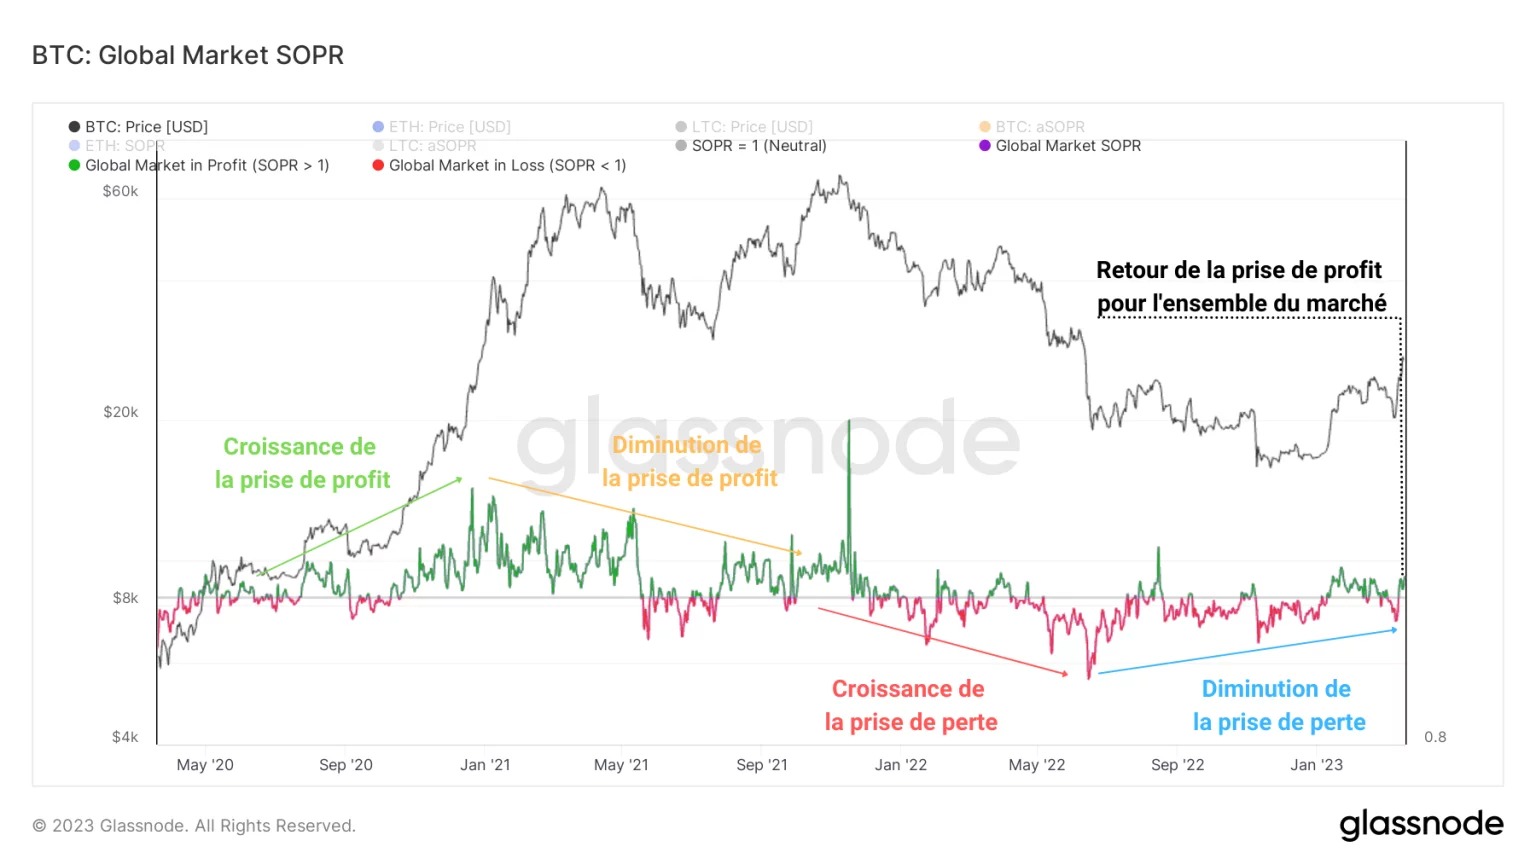
Figure 3: Global SOPR Ratio
Measuring the average of the profitability ratios (SOPR) of BTC, ETH and LTC, the oscillator below helps to illustrate the economic cycles of the sector and to determine if profit/loss taking dominates at any given time.
After a period of declining profit/loss taking following the collapse of the Terra ecosystem (LUNA) – and the resulting bankruptcies of Celsius and 3AC – in June 2022, the cryptocurrency market is currently finalizing its transition to a profit-taking regime.
This type of market structure favors the installation of a long-term bullish bias and bodes well for realized profitability growth in the coming months.
On-chain activity in the Bitcoin network
Another angle of study that brings confluence to our observations is the noticeable upturn in on-chain activity on the Bitcoin network.
Indeed, there has been a palpable sign of interest since the beginning of 2023, as the number of active entities has increased by nearly 90,000 active participants per day.
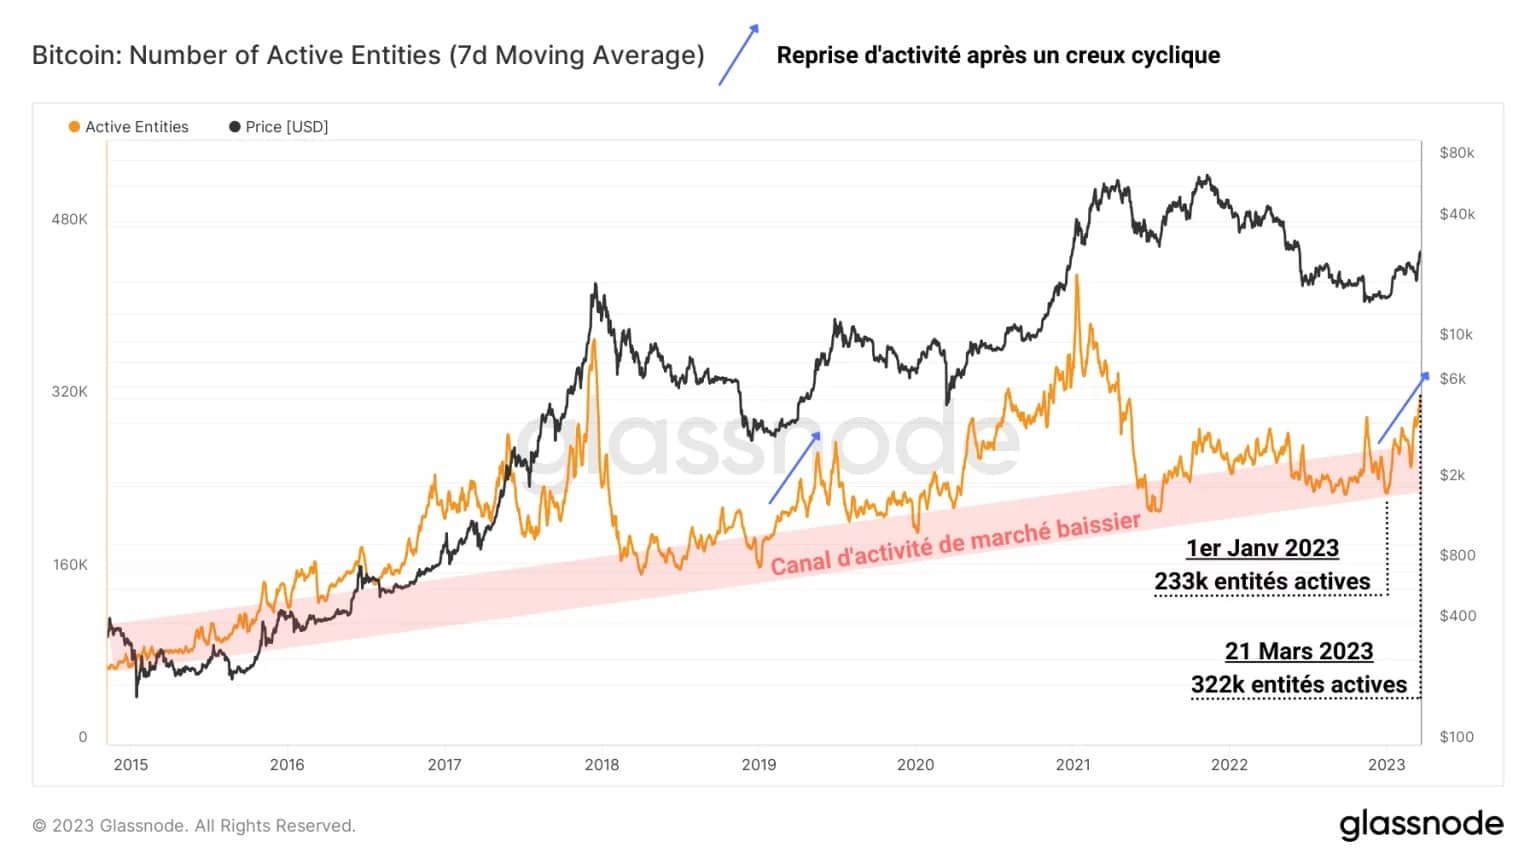
Figure 4: Active Entities
This increase in activity is not unlike that of 2019, when BTC holders showed considerable demand for block space after the bear market bottom of 2017 – 2018.
Moreover, the metric has recently been exiting the bear market activity channel (in red), indicating the market’s shift to a more sustained usage regime.
Accumulation behavior is returning
The accumulation behavior of participants seems to confirm this bullish momentum. As mentioned in the Week 9 analysis, accumulation is starting to show up following the distribution of the past few weeks.
While this trend is still in its infancy, it is part of a loop that includes the last three cycles of the BTC market.
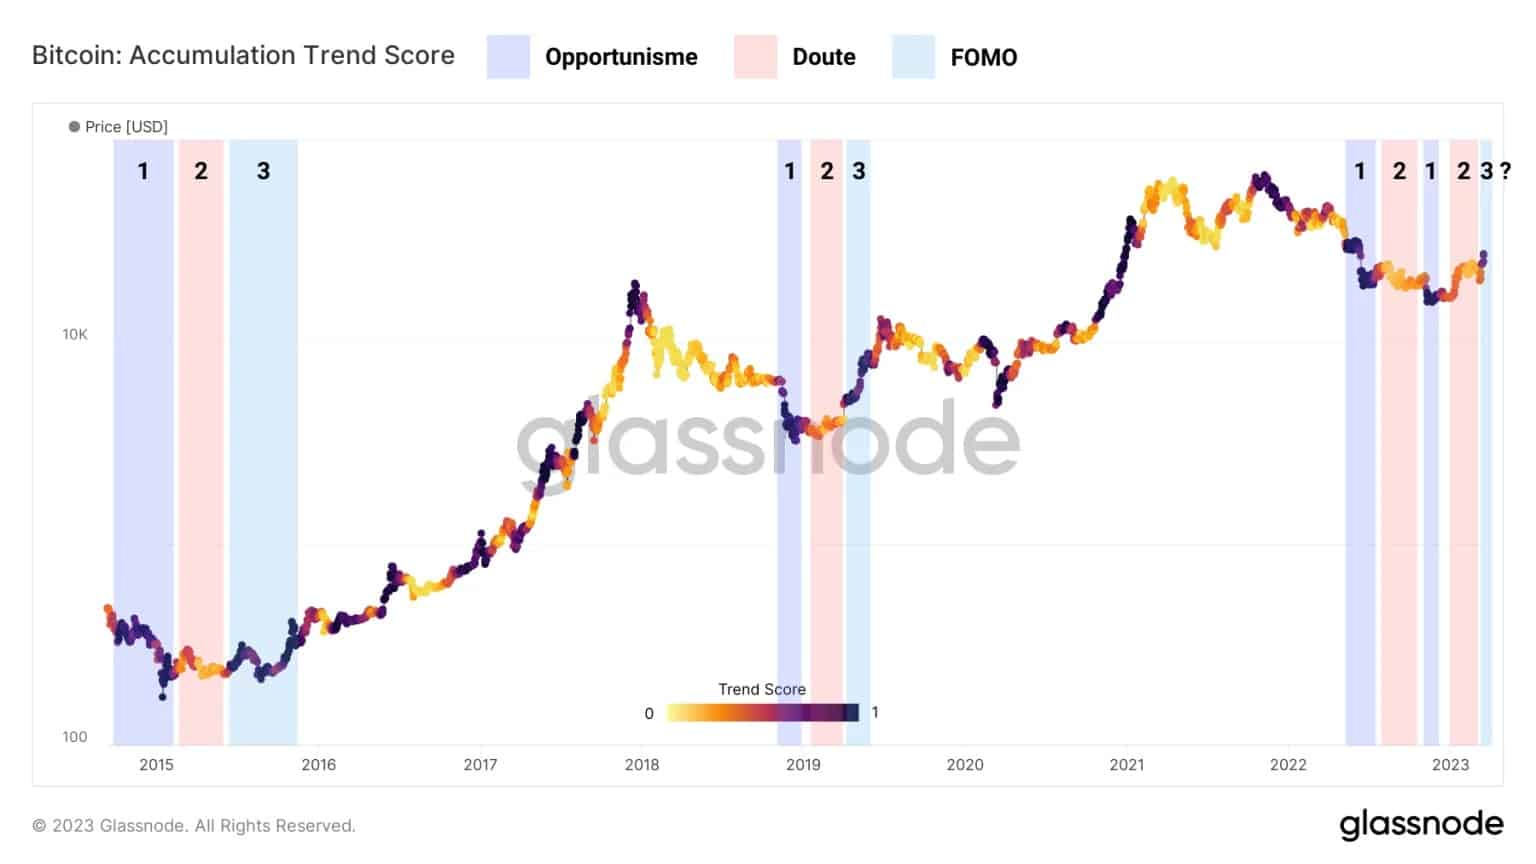
Figure 5: Accumulation Trend Score
With a score close to 0.8, the indicator below currently measures a strong accumulation trend by participants holding their BTC outside of exchanges.
BTC’s push towards $28,000 seems to have caused a palpable FOMO movement, a sign of investor interest.
Finally, this observation is confirmed by the behavioral study of the various groups of entities that make up the market. Indeed, while entities holding more than 10,000 BTC resume their distribution, the small hands (holding less than 100 BTC) stop selling and tend towards neutrality.
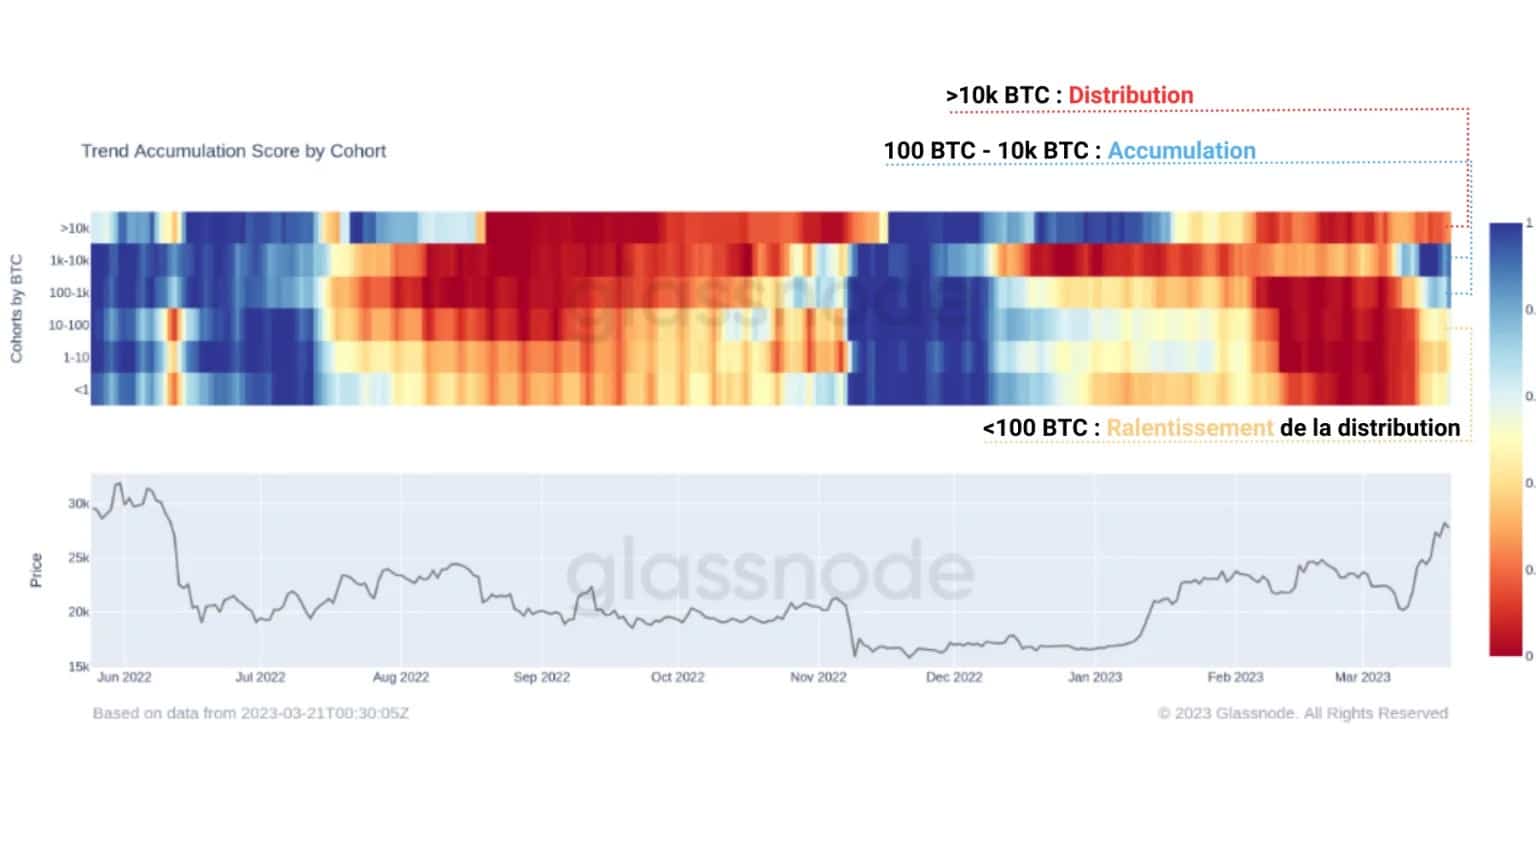
Figure 6: Accumulation trend score, by portfolio cohort
This dynamic is contrasted by a strong accumulation of whales (1,000 BTC – 10,000 BTC), followed recently by entities holding between 100 and 1,000 BTC. We can mitigate this observation by pointing out the lack of homogeneity of these behaviors.
Discrepancies are clearly visible and indicate that not all participants share similar biases, which can lead to a period of indefinite range before a consensus emerges.
Summary of this on-chain analysis of BTC
Finally, this week’s data suggests that the bear market of 2021 – 2022 appears to have ended in early 2023. The sharp improvement in latent and realized returns, as well as the visible resurgence of on-chain activity, indicate that interest and bullish bias are back in the BTC market.
In addition, recent accumulation behavior signals that some participants are anticipating a potential price increase in the coming months.
However, this does not mean that the price of BTC will go straight up. Despite the upward market structure and optimistic bias, it is best to remain cautious.
Transitions from bear market to bull market can be chaotic, with long ranges and periods of extreme volatility. That said, if you’ve held your ground so far, the hardest part is behind you.