
The financial markets have started the year 2023 on a high note with a surprisingly positive performance in the most offensive sectors of the stock market. As for the crypto market, it offered itself a small rebound, in a reduced volume however. The risk now is that all these moves will be taken back by a disappointment on the US inflation figures.
Bitcoin, the key issue in US inflation numbers
Equity markets are enjoying a surprisingly bullish performance so far this year, with the major European stock indices in particular almost back in touch with their all-time highs. In parallel with this rally in the most cyclical sectors, bond yields have stabilised and the US dollar is now down more than 10% on the floating exchange market since last October.
In the pre-FTX world, all of these cross-asset class stock market movements would have caused a sharp rise in the price of the crypto market; but the latter is still largely held back by the crisis of confidence in the major crypto intermediaries, as well as its fall of over 70% since its all-time high in November 2021.
The rise in risky assets this early in 2023 has been forged on investors’ belief that the disinflation process is well underway. The inflation rate in the United States has fallen from 9% to 7.1% in the space of three months and the consensus for this Thursday 12 January is 6.5%. This is where there is a market risk, because the consensus is very optimistic. The risk for the equity market and the bitcoin price is to be caught off guard by inflation that would slow down much less than expected.
This ongoing disinflation is fuelling the hope that the US Federal Reserve (FED) will limit itself to a 5% rate for its Terminal rate, and then make its famous “pivot” during the first quarter of 2023. But a rebound in the price regime would upset this fundamental narrative and represent a major market risk for high-beta assets in the stock market.
The answer, when the US CPI is released this Thursday 12 January at 2:30pm.
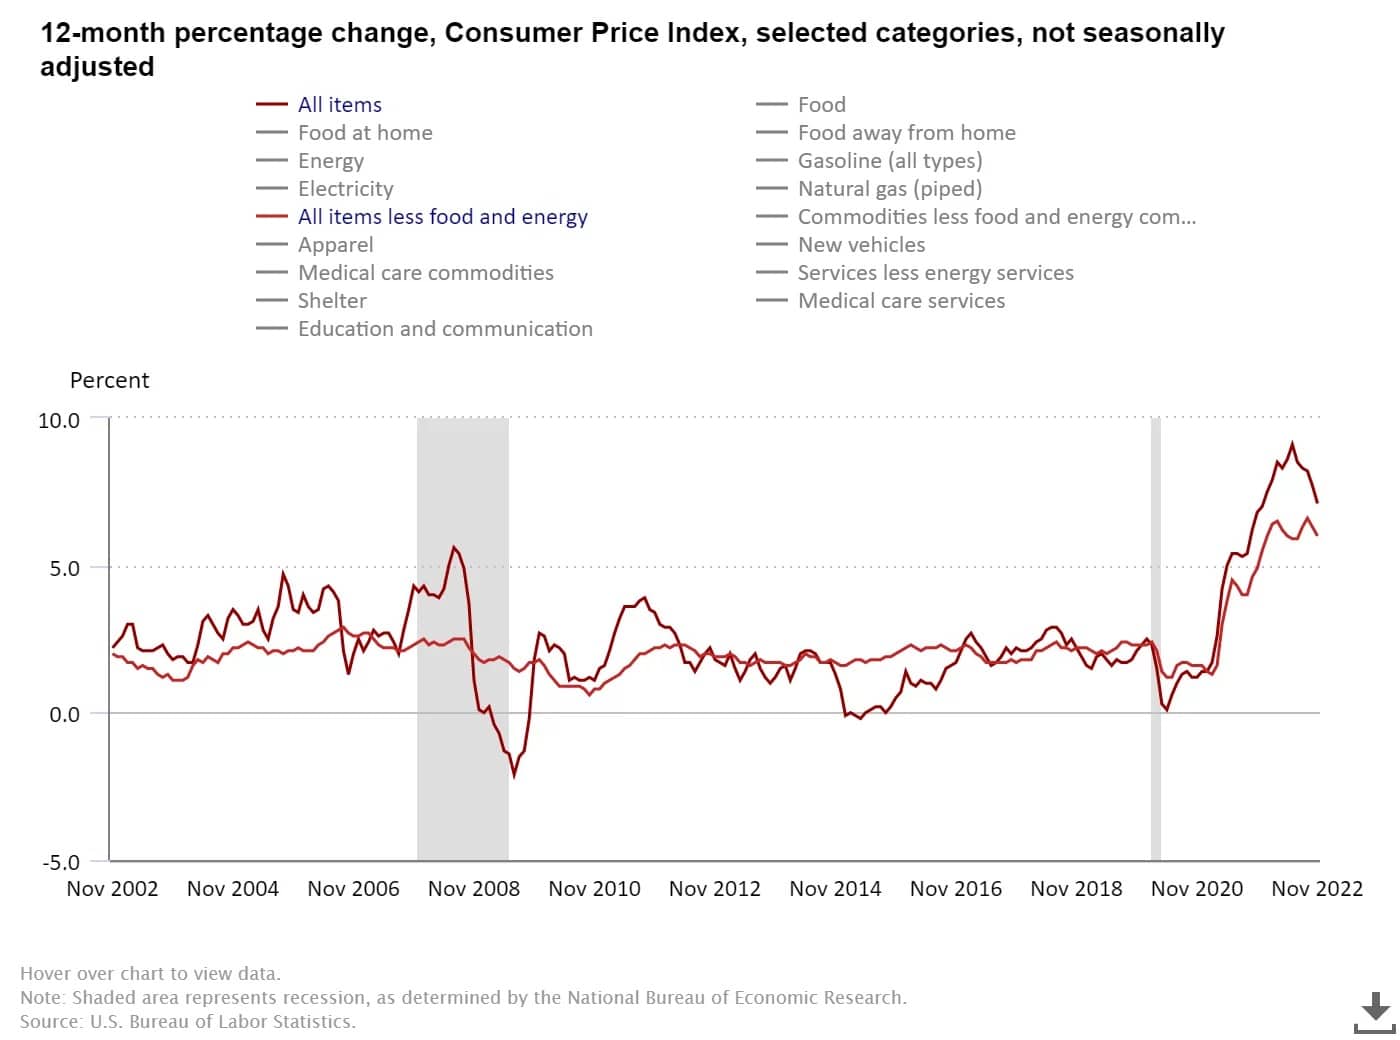
Chart showing the evolution of the components of the annual inflation rate in the US
In terms of technical analysis of the bitcoin price, here is a reminder of the dominant chart factors of the moment:
An uptrend line that joins all the most prominent lows of the weekly time frame for the past 5 years;
- The price of $16,000 which represents 50% retracement of all the upside since the low of the health crisis;
- The $12,000 price that the doxa is looking forward to (beware of the consensus, sometimes it is taken the wrong way);
- The $20,000 resistance level that must be breached to regain bullishness.
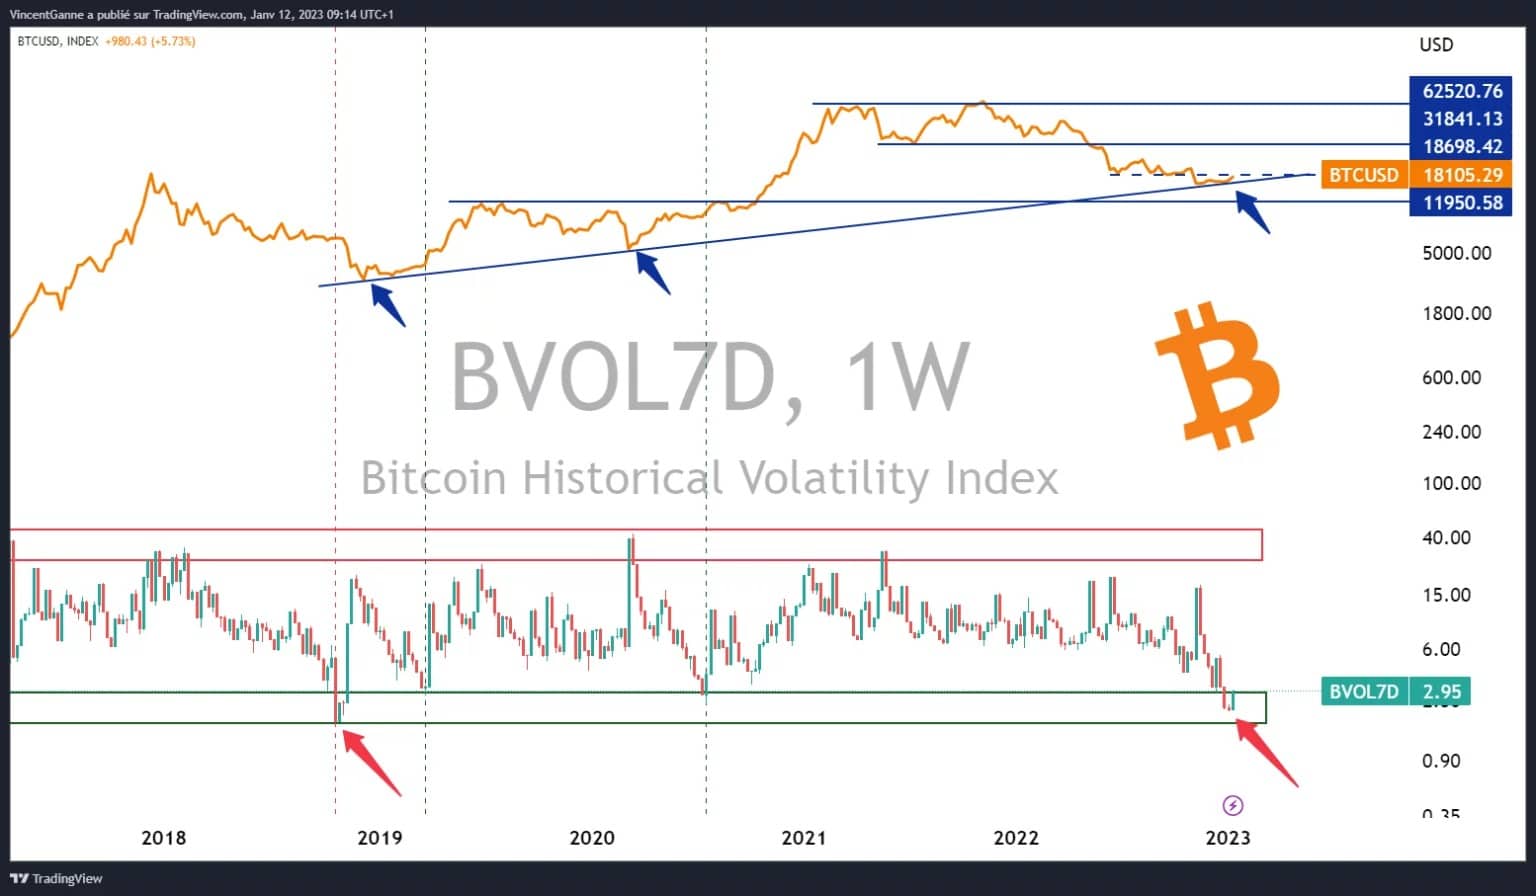
Chart that exposes the weekly closing price of bitcoin, juxtaposed with its realized 7-day volatility
The US dollar trend will correlate with Bitcoin in early 2023
Finally, to conclude this new contribution to the Cryptoast columns, I draw your attention to the level of support that the US dollar has returned to in Forex. The best case scenario for the crypto market would be for the US dollar to break this support, at least not offer a strong bullish bounce, due to the inverse correlation with the crypto market.
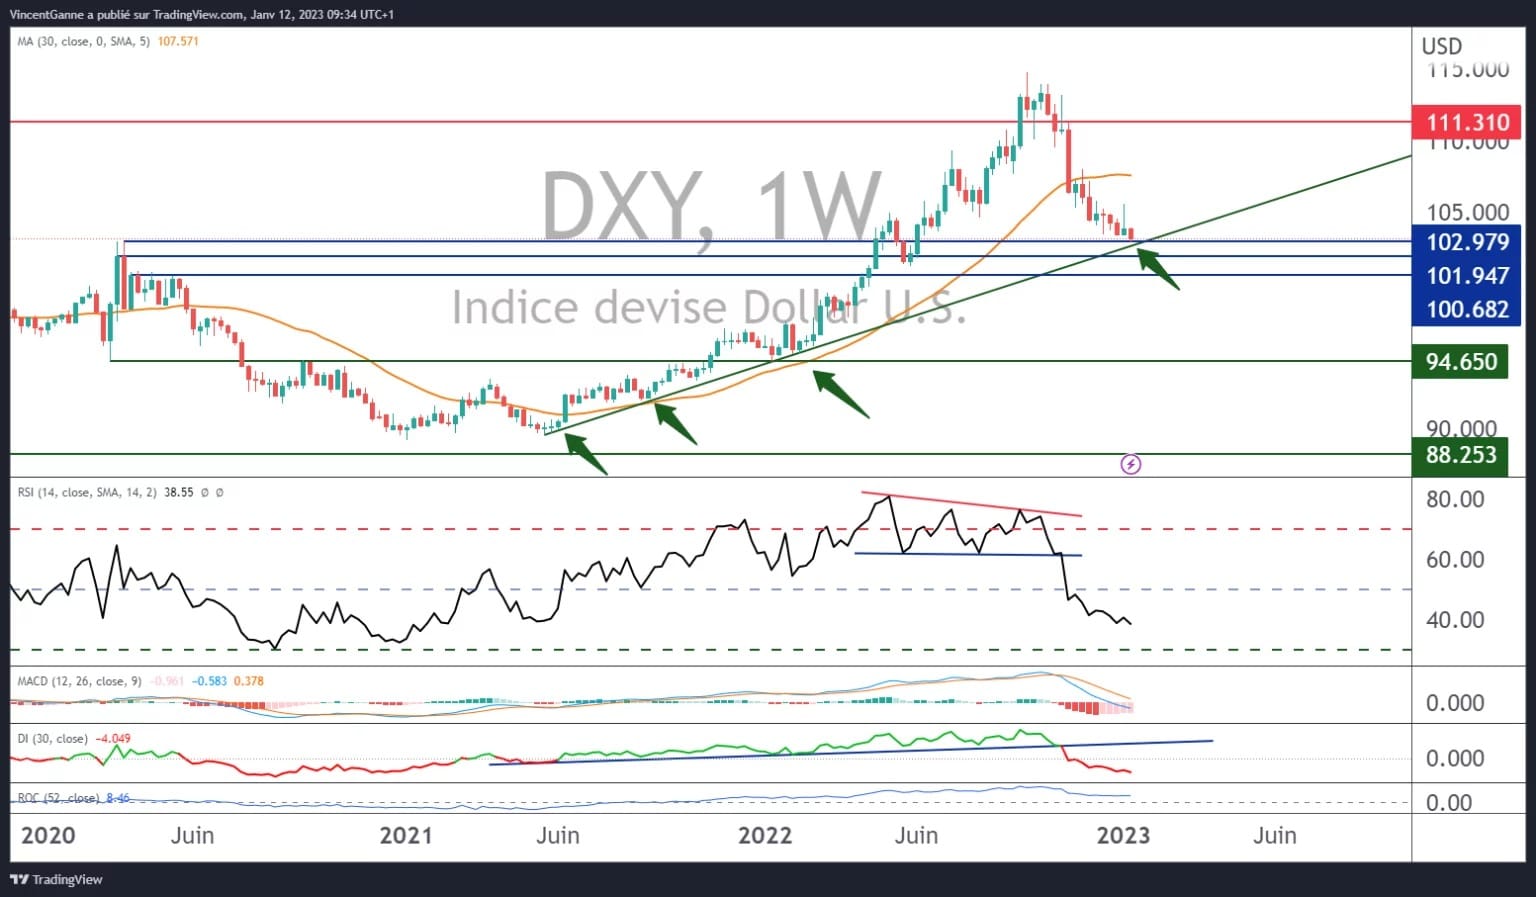
Chart showing the weekly Japanese candlestick pattern of the US dollar (DXY) against a basket of major Forex currencies