
The equity and crypto markets remain well oriented in the stock market despite the relative resilience of inflation and a still present uncertainty about the macroeconomic regime of the next 12 months. The bitcoin price is outperforming the US equity market and will now tackle major resistance at $25300.
Bitcoin price rebounds with general liquidity level in financial system
It was a dangerous week on a fundamental level for risky assets in the stock market with the monthly update of the US inflation rate. While it continued to slow to 6.4%, some of its components such as service prices and real estate rents remain in a strong upward trend.
In terms of monetary policy expectations from the US Federal Reserve (FED), the market is now looking at a Terminal rate of 5.50% and a pivot (i.e. the definitive end of the upward trend in interest rates) for the last quarter of 2023. On the other hand, in view of the economic indicators published this week, it seems that the probability of a recession has decreased slightly, which is a fundamental support factor for risky assets in the stock market.
The sources of fundamental influence on the crypto market price are therefore varied and there is one that correlates very strongly with the BTC price. This is the evolution of the general level of liquidity on the market, a data very much linked to the monetary policy perspectives of the major Central Banks, especially the FED.
The US equity market (represented in the chart below by the S&P 500 index) made its high point in December 2021. As for the bitcoin price, the all-time high was in early November 2021. It was exactly at this time that the general level of net liquidity in the US financial system began to reverse downwards. The FED had then entered a monetary tightening sequence to tackle the vertical rise in inflation head on.
The first chart below shows a juxtaposition of the S&P 500 index curve, with the bitcoin curve and the US liquidity curve. The latter is calculated from the FED’s balance sheet, minus its cash account and reverse repo operations.
In the short term, you can also see that the ongoing rebound in the price of BTC accompanies the rebound in the net liquidity curve within the US financial system.
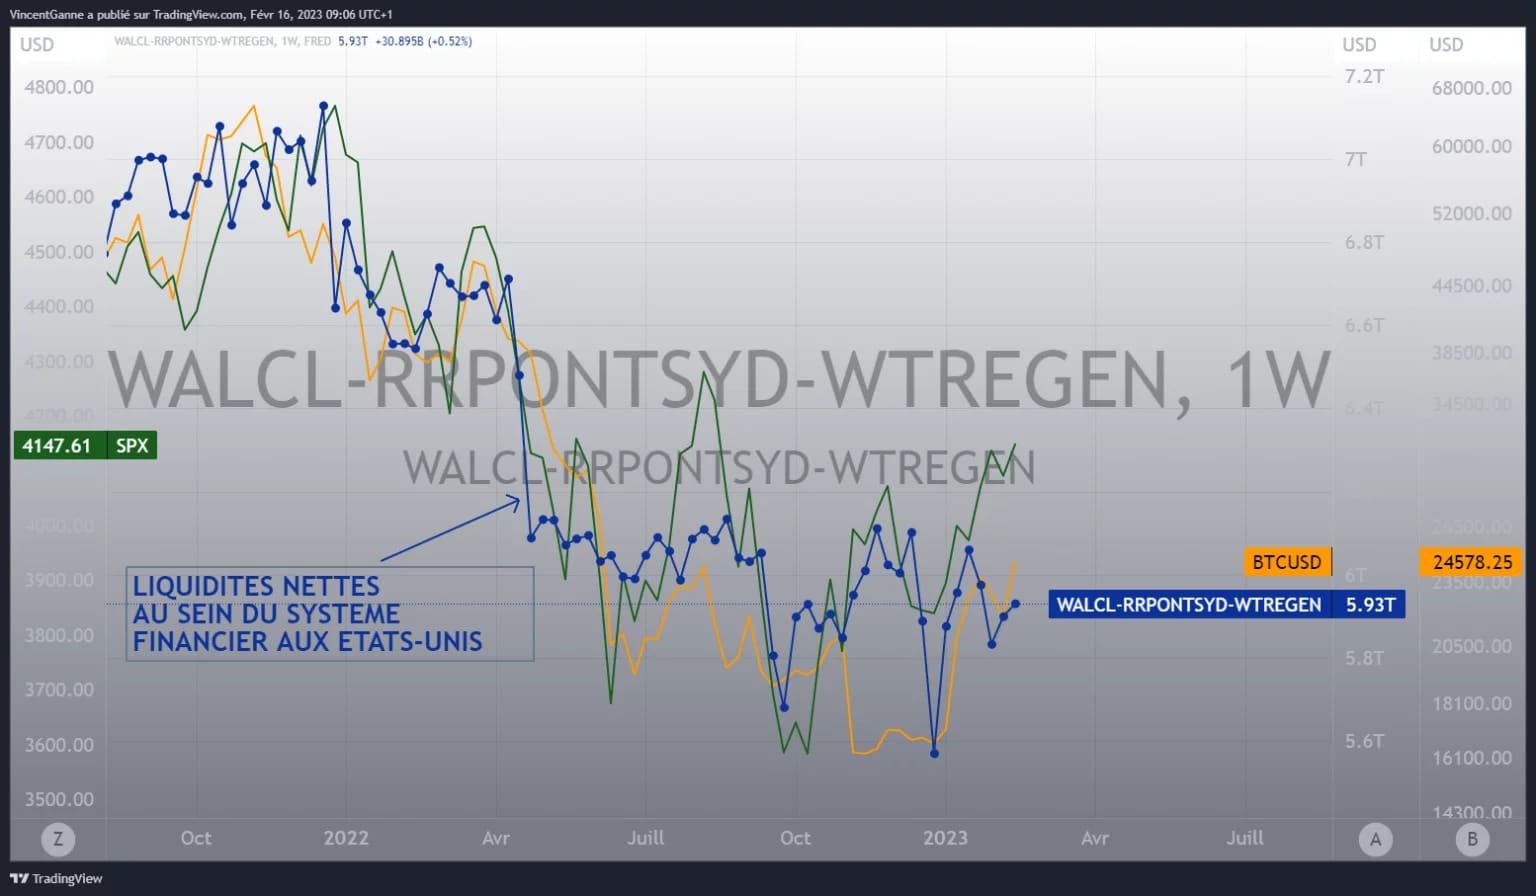
Chart that juxtaposes 3 pieces of information: bitcoin price, market liquidity and the US S&P 500 stock index
Bitcoin to tackle major technical resistance at $25300
Let’s now return to the technical analysis of the bitcoin price, which is recording a performance of more than 49% since the beginning of the year, surpassing the 42% bullish recovery for the Ether (ETH) against the dollar. In my previous article in the Cryptoast columns, I highlighted the golden cross moving average pattern, the market still seems to be well anchored in this recovery phase. So what are the next chart steps?
The short term uptrend remains intact as long as the market is above support at $22,400, the next major chart hurdle is at $25,300. If this resistance is breached, then the market will accelerate upwards towards the then open bearish gap between $28,000 and $30,000. Finally, the threshold for invalidating the rise that has been in place since the beginning of the year is still at $20,000.
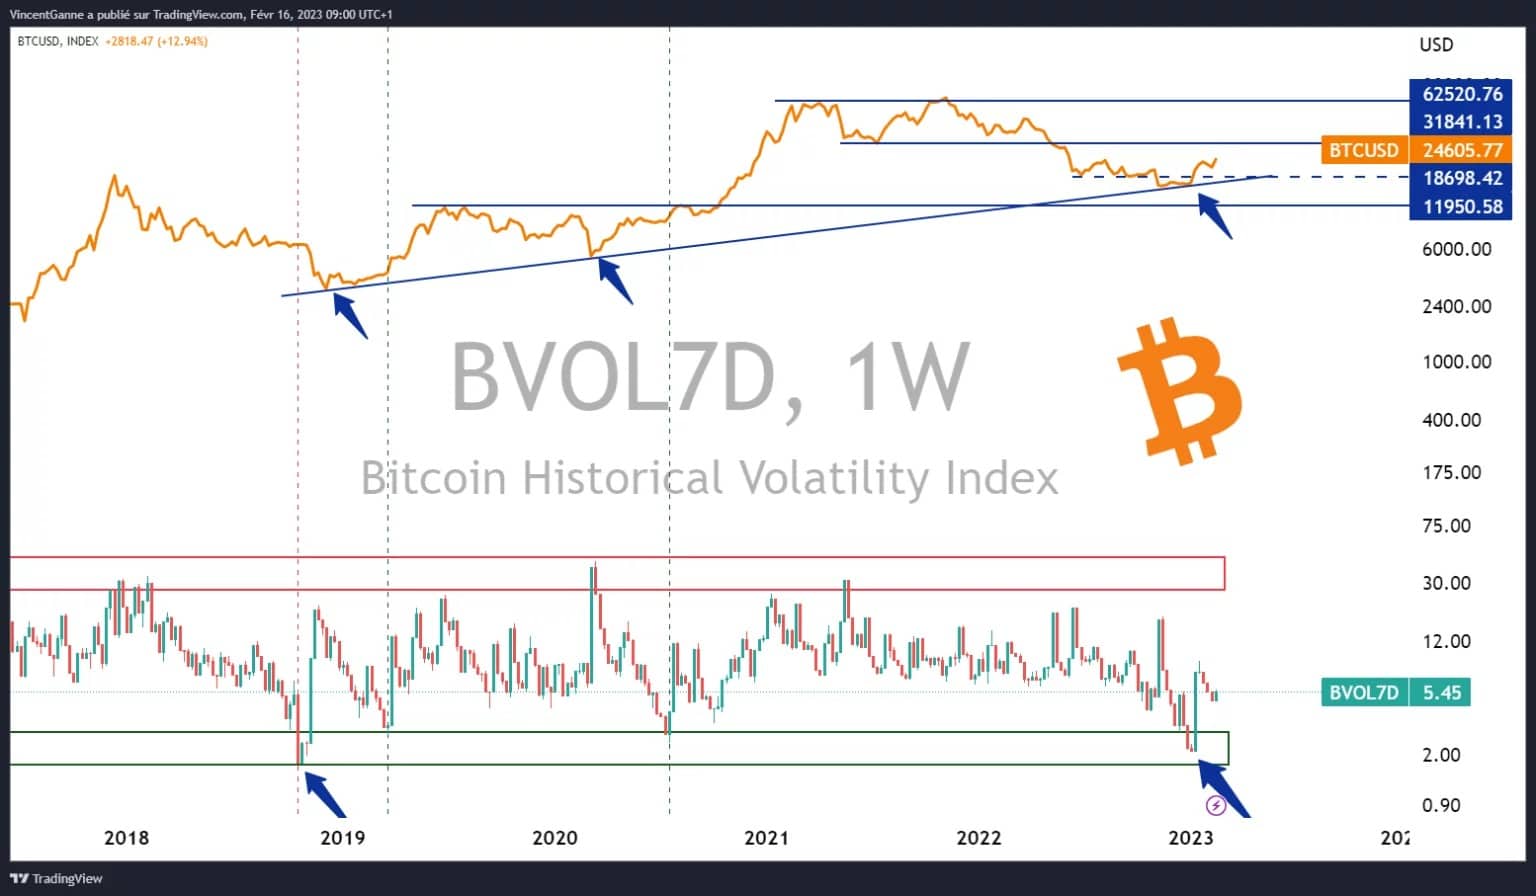
Chart showing the closing price of BTC on a weekly basis, with the 7 day volatility measure