
Between the end of the bear market and the beginning of the bull run, there is a transition period. While most of the lights have turned green in the short term and the end of the bear market has been confirmed, one question remains: is the market reversal complete? On-chain analysis of the situation
Bitcoin falls below $30,000
Following the recent surge in Bitcoin’s (BTC) price above $28,000, the first quarter of 2023 closed with one of its best performances ever.
While the majority of the lights have turned green in the short term and the end of the bear market has been confirmed by the data from the week 12 analysis, one question remains: is the market reversal complete?
Indeed, there is a transitional period of variable duration between the end of the bear and the beginning of the bull. It is during this period that the various parameters of the BTC economy gradually move towards a bullish bias.
In addition, the $30,000 level seems to serve as a bullish/bearish pivot since the year 2020 and still acts as resistance to the BTC price, momentarily halting its ascent.
Today we will look at BTC cycles to highlight the different transitional dynamics at play and determine if they are all complete or if we still have a ways to go before a new bull run occurs.
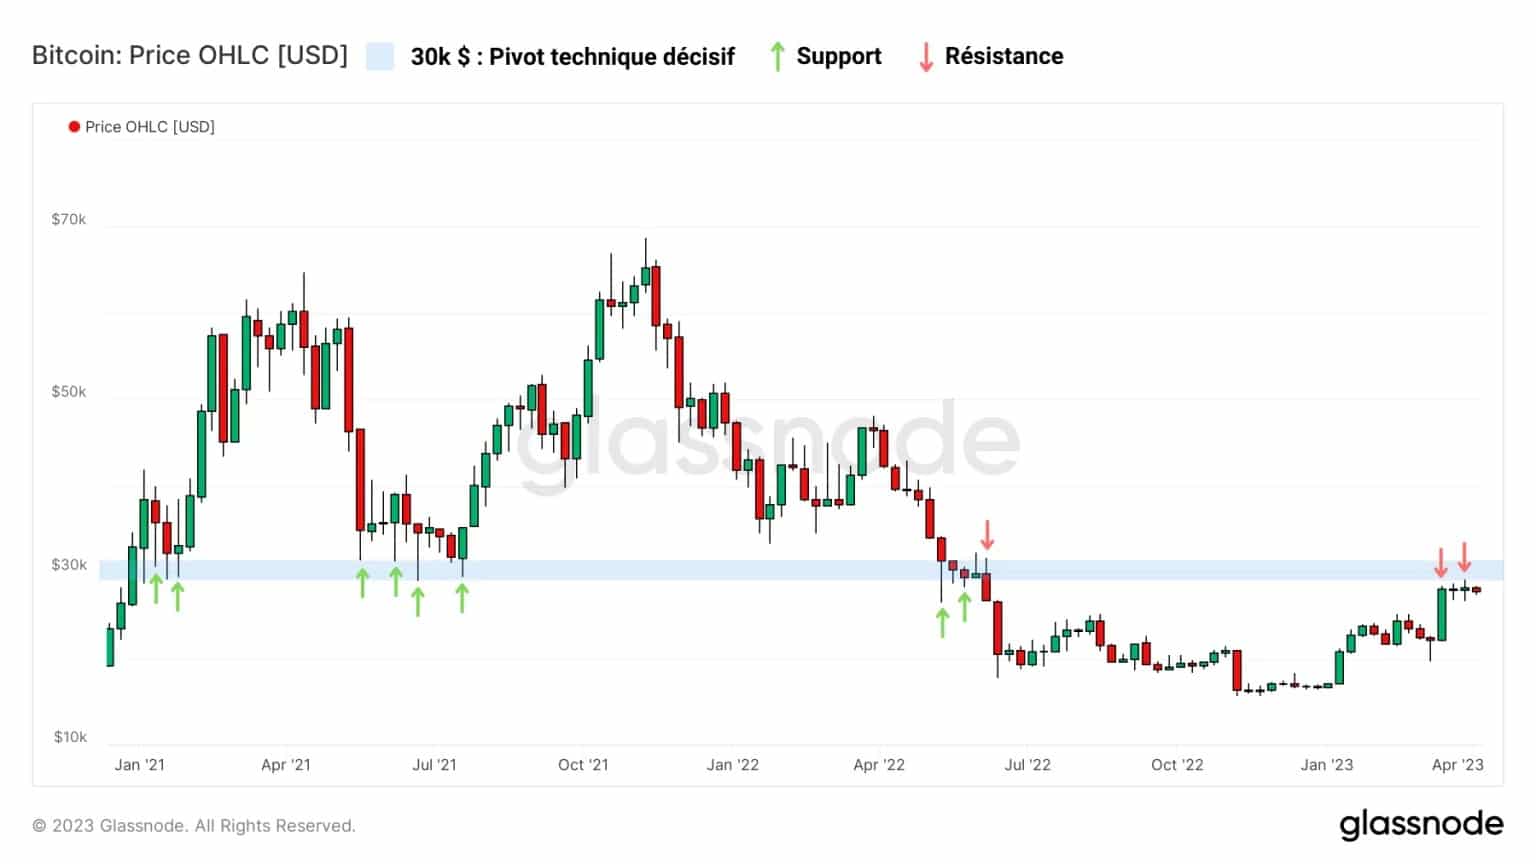
Figure 1: Daily BTC price
The momentum of profitability
To see the momentum of the market’s profitability, we can compare the 30-day and 365-day moving averages to the MVRV ratio. This allows us to compare short and long term trends.
The relationship between the monthly average (orange) and the annual average (blue) of the MVRV ratio provides a simple but very effective framework for observing BTC cycles as a whole.
Thus, we can highlight periods of positive momentum (monthly average ☻ annual average) and periods of negative momentum (monthly average ☺ annual average).
Since the end of February, we can observe the arrival of a new positive momentum on the MVRV which indicates that short-term profitability is exceeding long-term profitability after a long period of financial pain.
This recent recovery in MVRV momentum potentially precedes a structural rise in the price of BTC, as in previous cycle reversals.
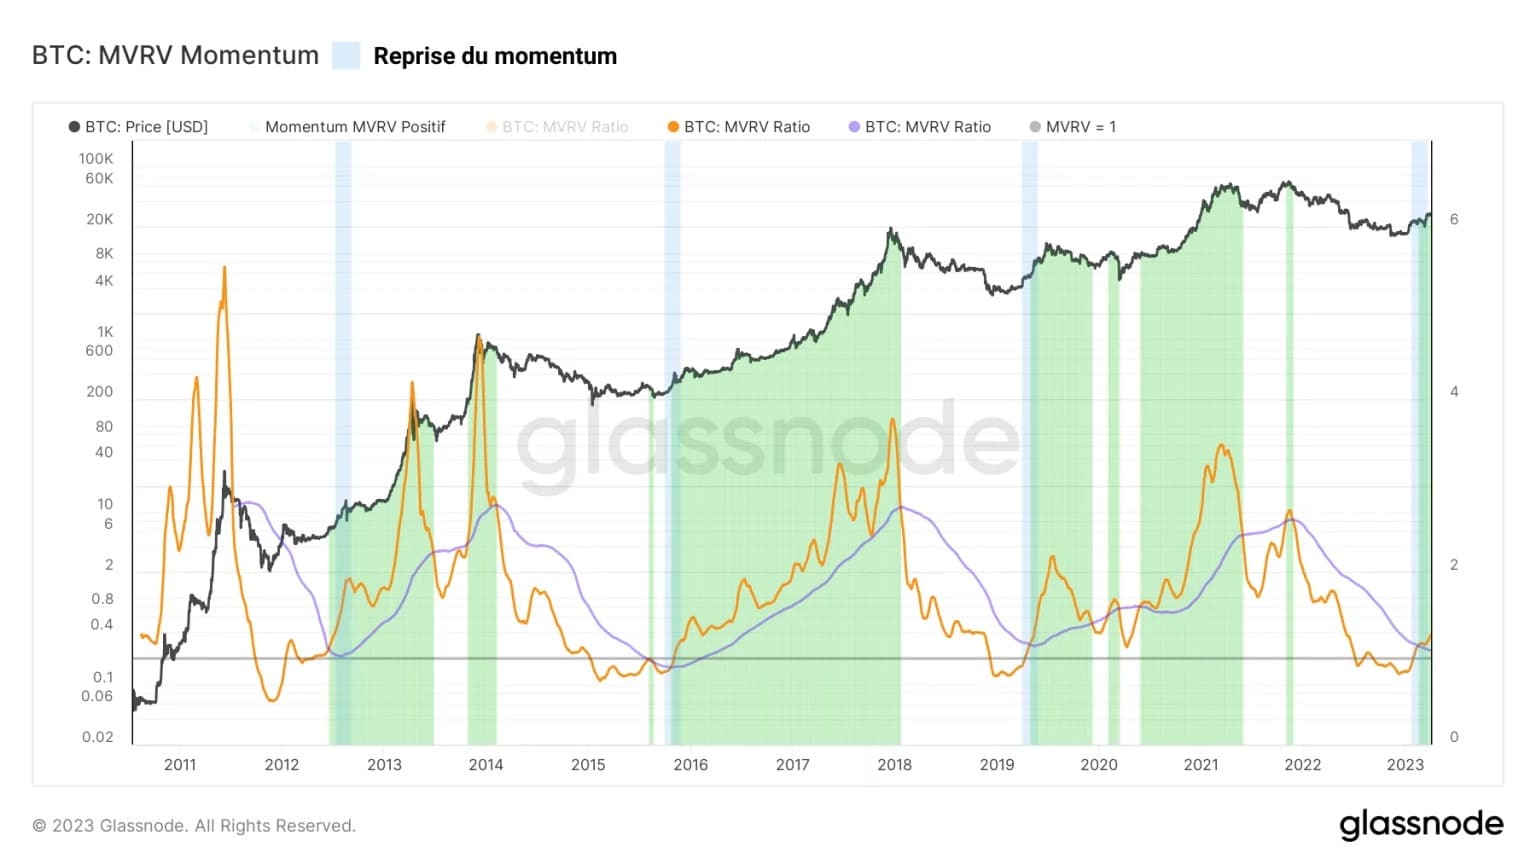
Figure 2: MVRV Ratio
Using data from the ChainExposed website, we can further explore this finding by separating the MVRV into different age bands around the site-specific seniority threshold (about 140 days).
Thus, the bands of MVRV below 140 days represent its short-term components and the bands of MVRV above 140 days represent its long-term components.
Here we can clearly see the short-term returns of the market returning to positive values during February, which historically corresponds to the transition phases following the end of bear markets (in blue).
Currently, almost all of the coins that were purchased 140 days ago are incubating a latent profit, which has not happened since November 2021.
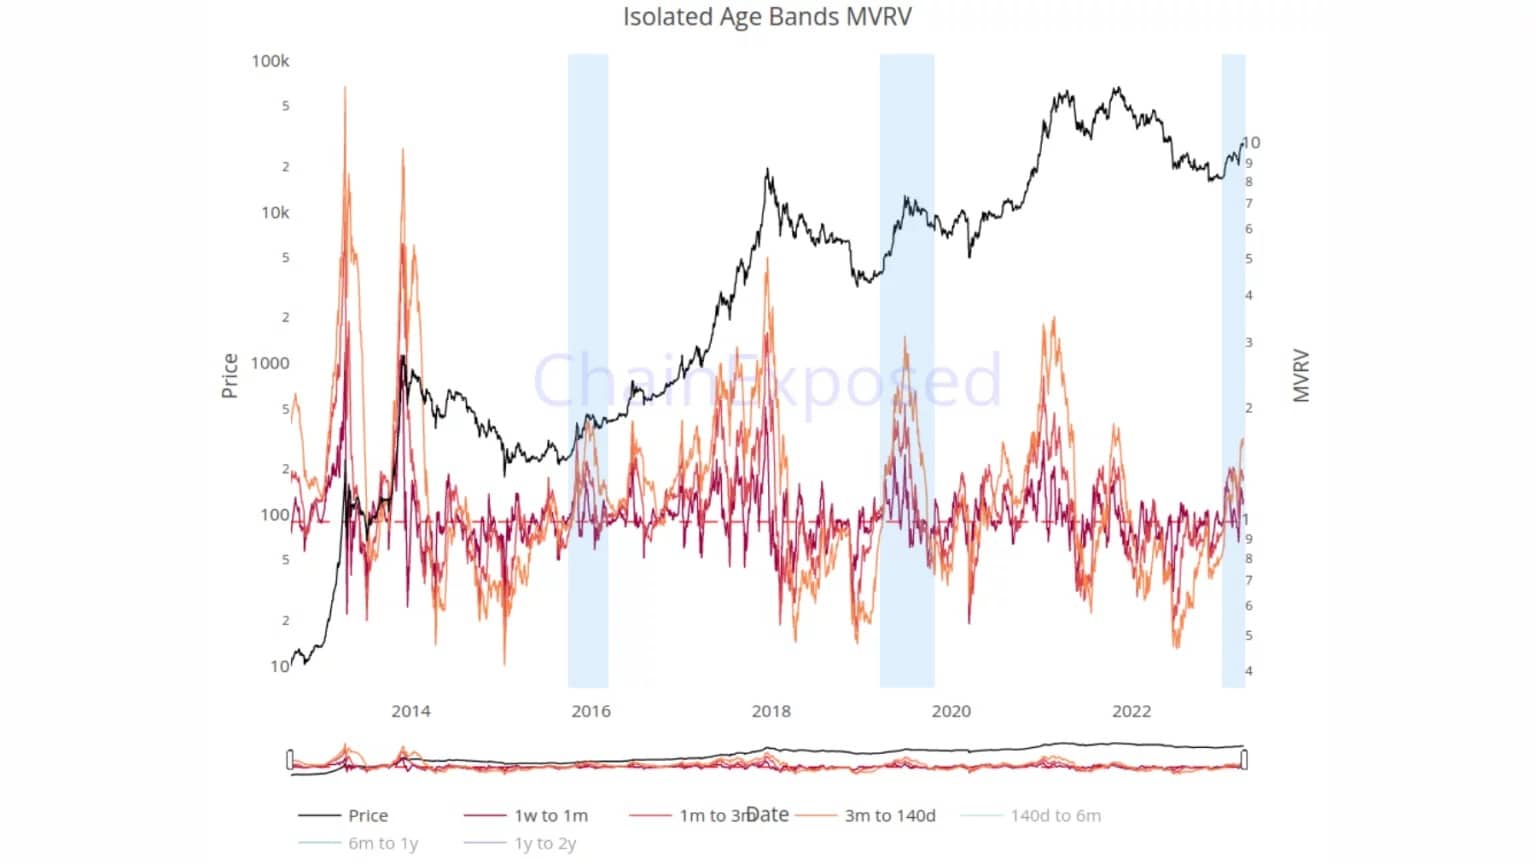
Figure 3: MVRV ratio (< 140 jours)
However, focusing on the long-term MVRV components, it appears that their transition above 1 is far from complete.
Indeed, only BTC aged 140 days to six months carry a latent profit, estimated at about +48%.
BTC aged six months to one year are close to the breakeven point, indicating that their average cost basis is around $30,000.
This coincides with the first strong accumulation phase of the 2021 – 2023 bear cycle, which occurred in May and June 2022, following the implosion of LUNA/UST and the concomitant market decline.
Finally, one to two year old BTCs are still incubating a significant latent loss of nearly – 40%. These coins, accumulated near the highs of 2021 have been firmly held until now and have very little chance of being sold at a loss.
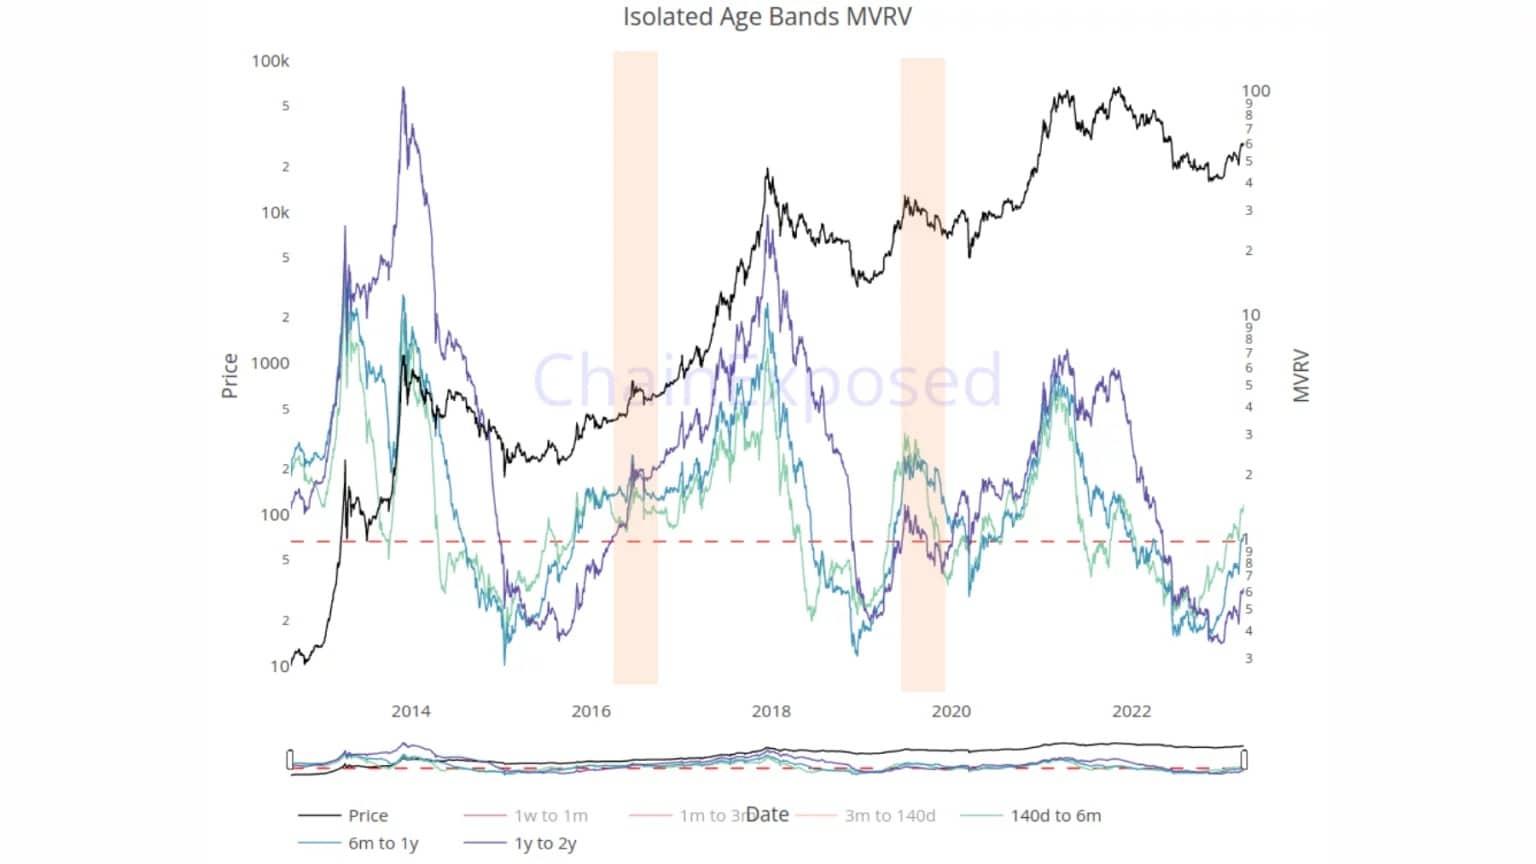
Figure 4: MVRV ratio (bands ☻ 140 days)
The profit/loss momentum
Once the various aspects of the market’s latent profitability have been studied via the MVRV ratio, it is time to look at realized profitability, measured by the SOPR ratio.
Applying the same method as the MVRV, it appears that the monthly average of the aSOPR has exceeded the annual average since the beginning of February.
A little over a week later, aSOPR finally rose above 1, directing the market to take profit as the BTC price rose to $24,000.
Here again, positive momentum is back, suggesting a bullish bias and a propensity for participants to double down when the BTC price returns to visit their cost basis.
This behavior, if verified by bounces off the neutral zone (aSOPR = 1), would indicate a sense of confidence in the uptrend and favor the advent of a new bull run.
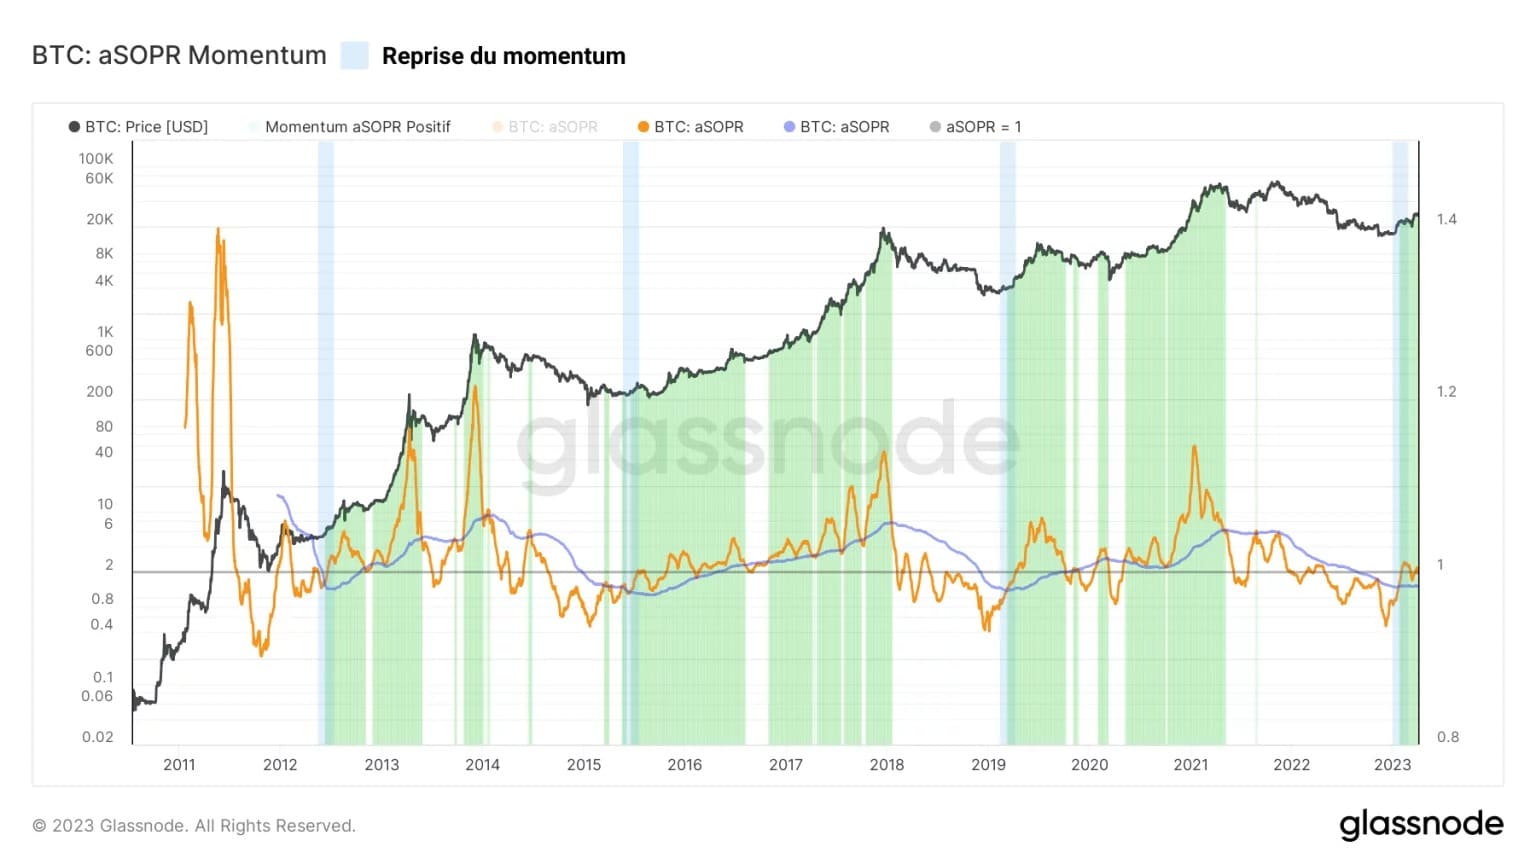
Figure 5: aSOPR ratio
Once again, we can compare short term (STH) and long term (LTH) spending behaviors to get an overview of our situation. The STH-LTH SOPR ratio is an oscillator that compares the realized profit multiple (SOPR) of the LTH and STH cohorts.
This measure can be interpreted as:
- Negative values (in red) indicate that the average realized profit for STH is lower than for LTH. This is typical of bull markets, where long-term investors realize high profits;
- Positive values (in blue) indicate that the average realized profit of STH is higher than that of LTH. This is a typical situation at the end of bear markets, where LTHs have their heads under water, while STHs are fighting for the best entry point.
We are currently right on the border between these two environments, which suggests that the transition to an early bull market is almost complete.
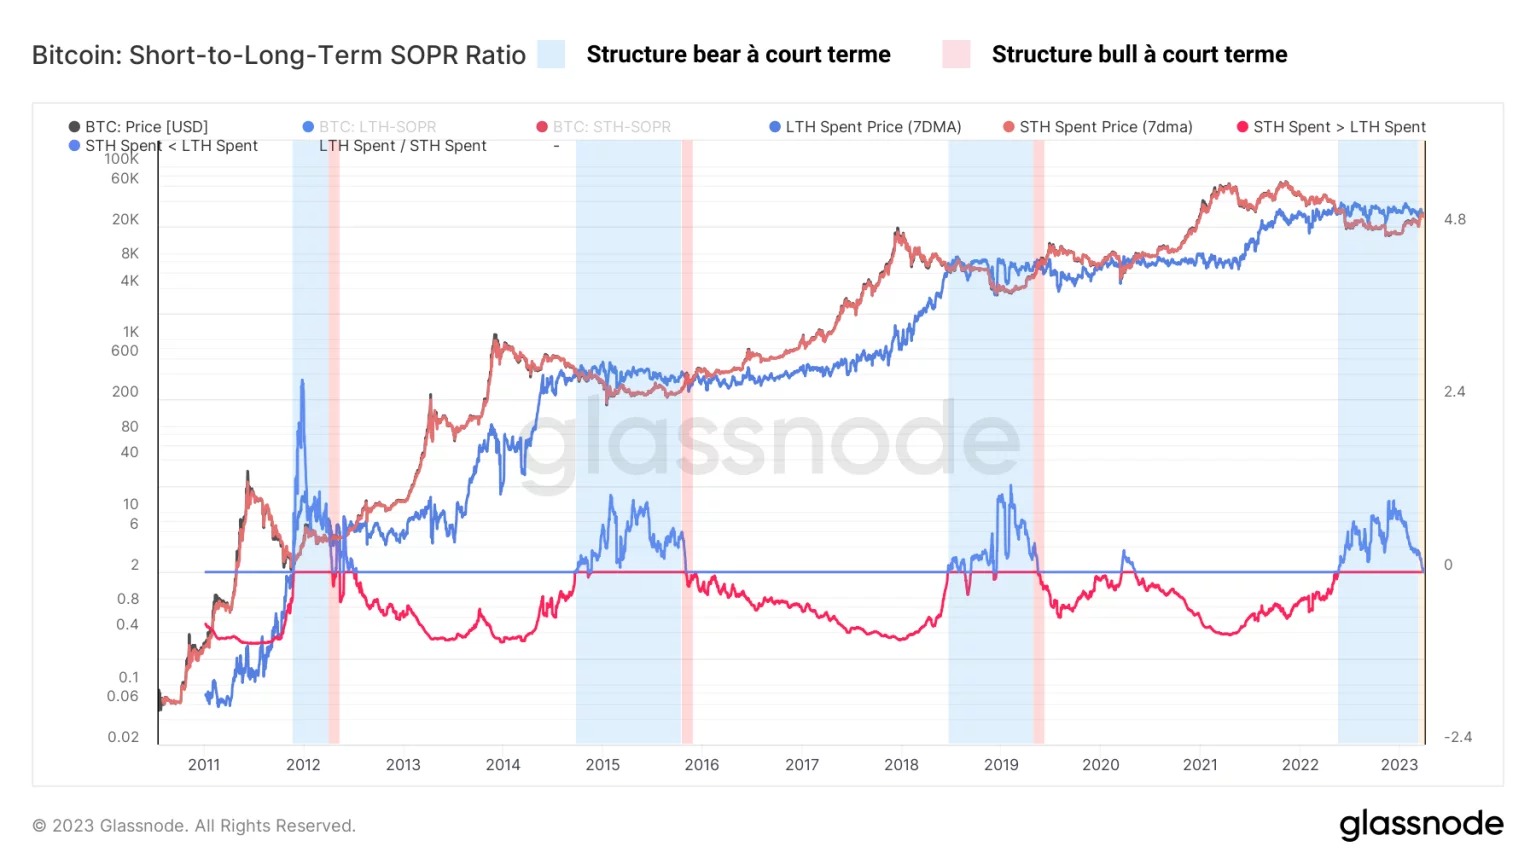
Figure 6: SOPR STH-LTH ratio
Summary of this on-chain analysis of BTC
Thus, this week’s data shows that, even though it is already well underway, the transition phase between the end of the bear market and the beginning of a future bull market is not quite complete.
The short-term components of the MVRV ratio all indicate a return of the bullish bias on the lower time scales. This is sufficient to establish a bull market structure, but not to sustain it over time.
As for the longer-term components, while they show a clear bullish bias, not all have completed a full reversal. This suggests that the current transition phase needs more time to unfold optimally.
Finally, we should not forget that the halving, historically linked to Bitcoin’s economic dynamics and the launch of bull markets, is not expected until March 2024. There is no point in running, the market is turning around, slowly but surely. Tick tock next block.