Distributional behavior has intensified, with the Bitcoin (BTC) price reaching the key $20,000 level before making a powerful rebound towards $26,000. The recent price decline has not left market participants indifferent, especially long-term holders, who have realised heavy losses. On-chain analysis of the situation
Bitcoin rebounds to $20,000
The distributional behavior described two weeks ago has intensified, with the price of Bitcoin (BTC) reaching the key $20,000 level before making a powerful rebound towards $26,000.
The recent price decline has not left market participants indifferent, especially long-term holders. The latter have clearly suffered from the market’s fall, making huge losses on occasion.
This week, we continue the behavioural analysis from our previous edition with the latest data from the BTC market.
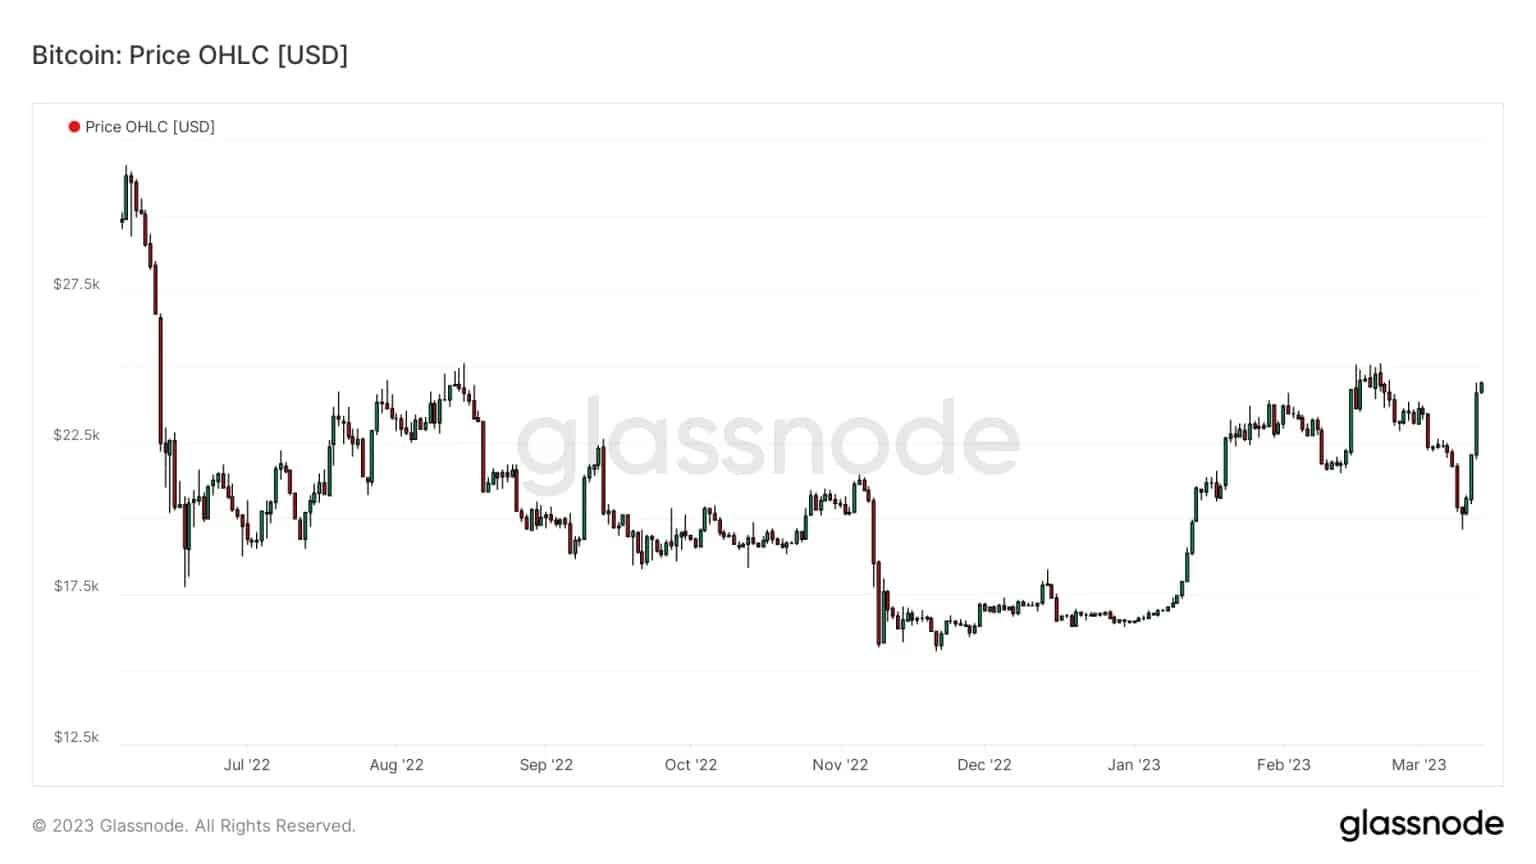
Figure 1: BTC daily price
Basic costs act as support
Looking at the relationship between the spot price and the cost base of the various groups of participants over the past year, something becomes clear. The average short holder cost basis (STH-RP) has tended to act as resistance to the spot price throughout the 2022 bear market.
However, since it broke free in early 2023, this on-chain level appears to be serving as support for the spot price, as shown by the recent price action.
This signals a key change in behaviour: short-term holders, rather than selling close to their cost base to limit risk, tend to accumulate close to it and ‘double down’. Such behaviour indicates that the bullish bias is still largely favoured and that the downturn has had little impact on this cohort.
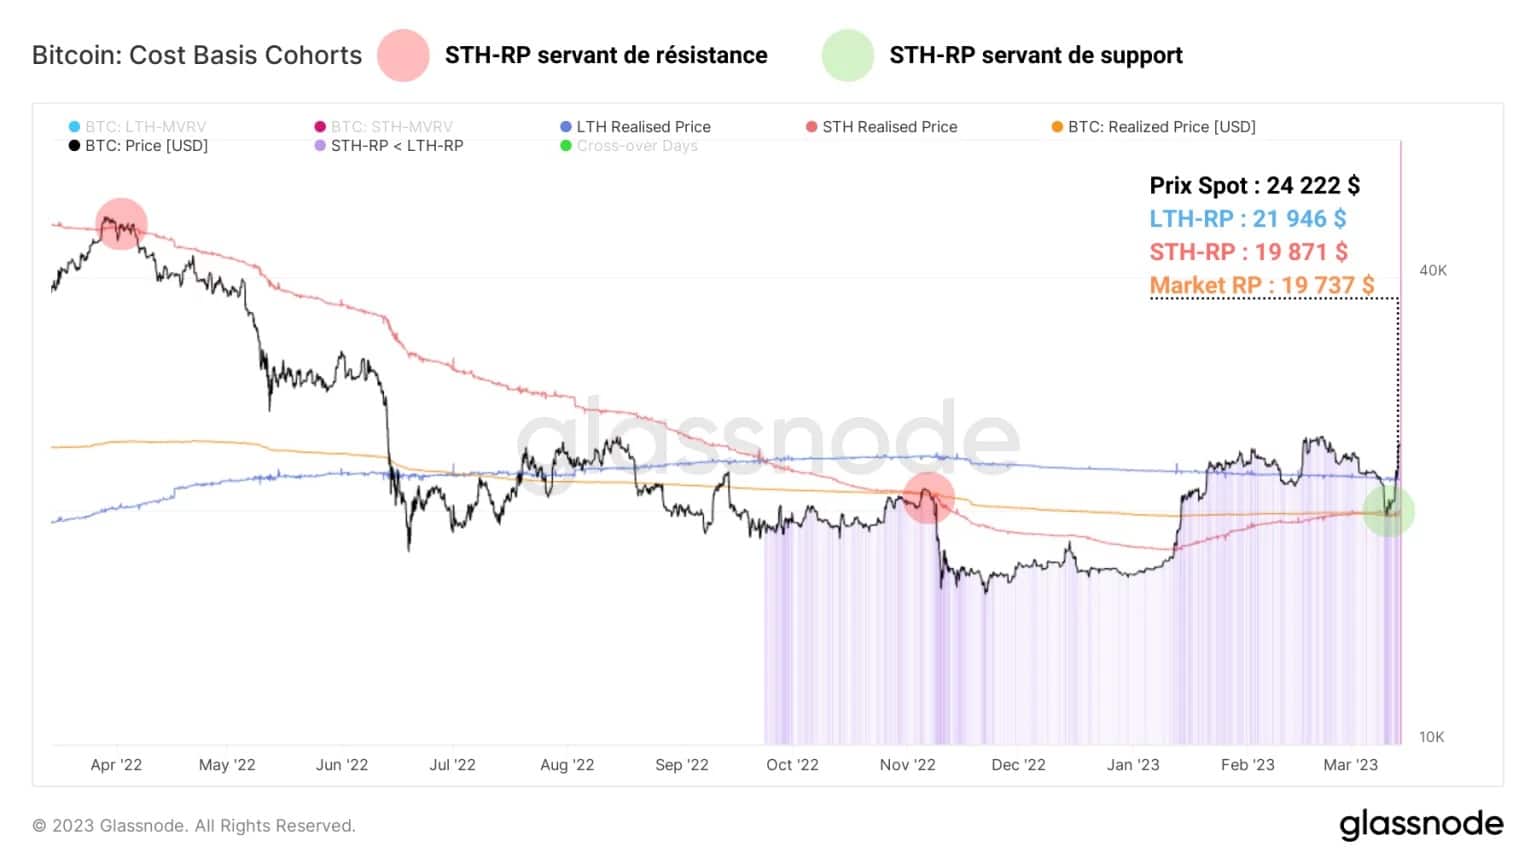
Figure 2: Realised market price, STH and LTH
Long-term holders’ loss making
On the long term holder (LTH) side, selling behaviour has been pronounced and has only just begun to slow down. Indeed, the loss-making volumes sent daily to the exchanges are increasing, from 400 BTC to 1,600 BTC between March 8 and 9 and then to 1,800 BTC over the weekend.
By measuring the ratio of loss-making to profit-making volumes, we can measure the dominance of LTH loss-taking via the oscillator at the bottom of the chart. The latter once again indicates an extreme loss state (dominance ☻ 0.75), while the LTH cohort is struggling to regain an upward bias.
Market ends are periods of increasing risk for members of this cohort, who tend to run out of steam and make large losses as time goes on, despite an initially strong conviction.
Note that the conviction of some long-term holders may also have been shaken by the recent news of the Silvergate and SVB bank failures, portending a very risky contagion for the traditional financial sector.
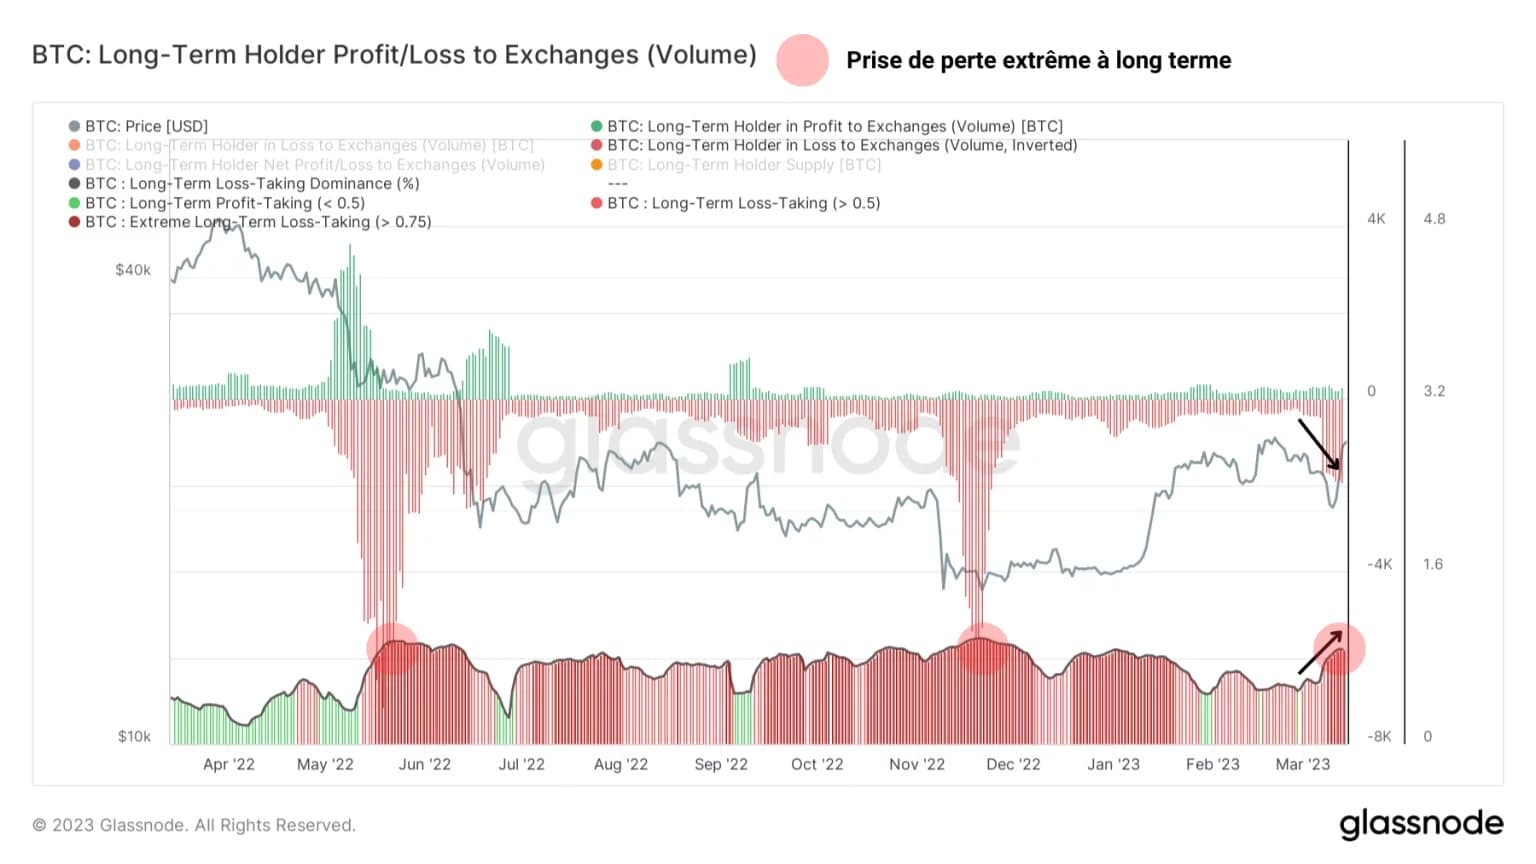
Figure 3: Volume in profit/loss from LTH to exchanges
Overall, the LTH cohort is still making significant losses, ranging from -10% to -20%. Despite a notable improvement in their realised profitability from -50% to almost -20% between November 2022 and March 2023, few long-term holders are currently taking profits.
This is also visible via the LTH-SOPR, which measures the profitability of spent UTXO being older than 155 days. This indicator provides an excellent overview of the long-term directional bias of the market, with the neutral zone (LTH-SOPR =1) serving as the border between the bullish and bearish bias.
The failure of the LTH-SOPR to move above 1 is a perfect illustration of the difficulty of LTHs to move into profit taking, as many are once again above their break-even point (around $22,000).
While the price had been above this threshold for most of February, its relapse, albeit temporary, signalled a significant loss-taking by LTHs. In order to signal the return of a long-term bullish bias, the LTH-SOPR will need to rise above the neutral zone (LTH-SOPR = 1) on a sustained basis and use it as support.
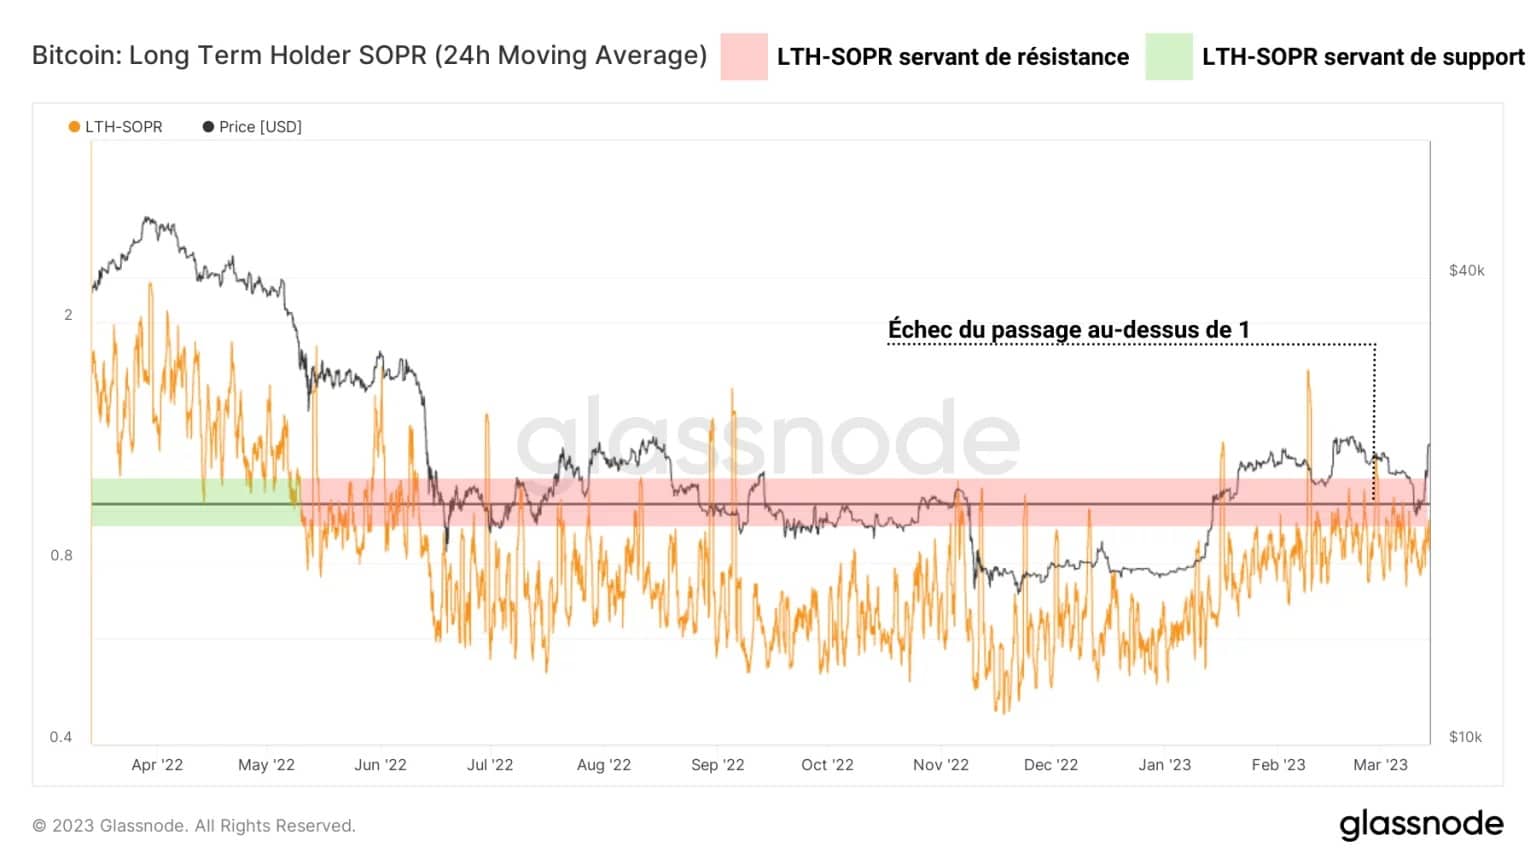
Figure 4: LTH-SOPR
This selling behaviour is corroborated by the data in the following graph. The age bands of BTC volumes spent measure the relative share of a given age band’s spending volume against the total daily volume.
By selecting volumes that are 6 months or older, the so-called “old” ones, we can target the spending behaviour of long-term holders and observe their reaction to market fluctuations. What emerges from the study of the most recent data in this metric is that old volumes were indeed spent, and increasingly so, from the end of February.
This spending peaked on 7 March, just before the price fell below $22,000, accounting for over 10% of total transfer volume at that time.
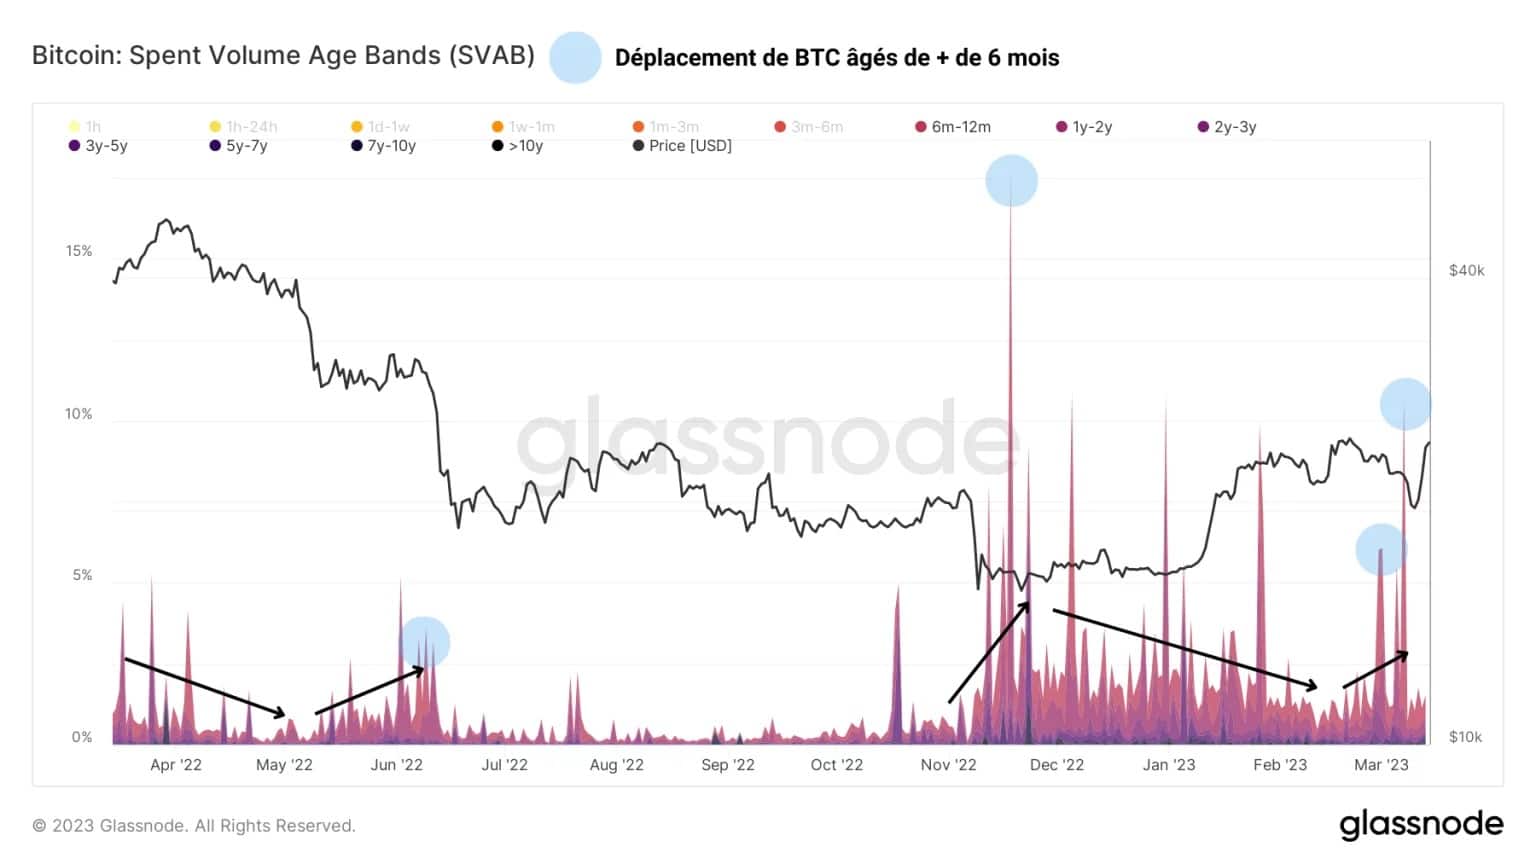
Figure 5: Age bands of volume spent
Summary of this on-chain analysis of BTC
Overall, this week’s data suggests that BTC’s recent move back towards $20,000 has offered market participants a significant test of conviction.
On the long side, a significant loss-taking has taken place, involving increasingly unprofitable legacy BTC as BTC slides back to its average cost basis of around $22,000.
The failure of the LTH-SOPR to break above 1 illustrates the difficulty of LTHs to transition to profit taking, with the cohort still making losses of between -10% and -20%.
It is likely that this distribution was absorbed by strong demand at the $20,000 level, led by the whales and some of the STHs.
