: What can we expect in 2023?")
With short-term conviction taking a beating over the past couple of weeks, we take a look at activity on the Bitcoin network and the evolution of underlying market trends to gain some perspective on 2023. For the time being, on-chain activity is signalling a return of interest from participants, and the rise recorded this year is very similar to that of mid-2019.
Bitcoin is making life difficult for speculators
The price of BTC has turned against speculators by breaking the $29,000 level from below. Since then, the market has entered a new phase of stagnation, this time at the $26,000 level.
Yesterday, the announcement of Grayscale’s victory over the SEC sparked a new rush of speculators onto the market, causing the price to rise by more than 6% in one hour and a cascade of liquidations of short positions.
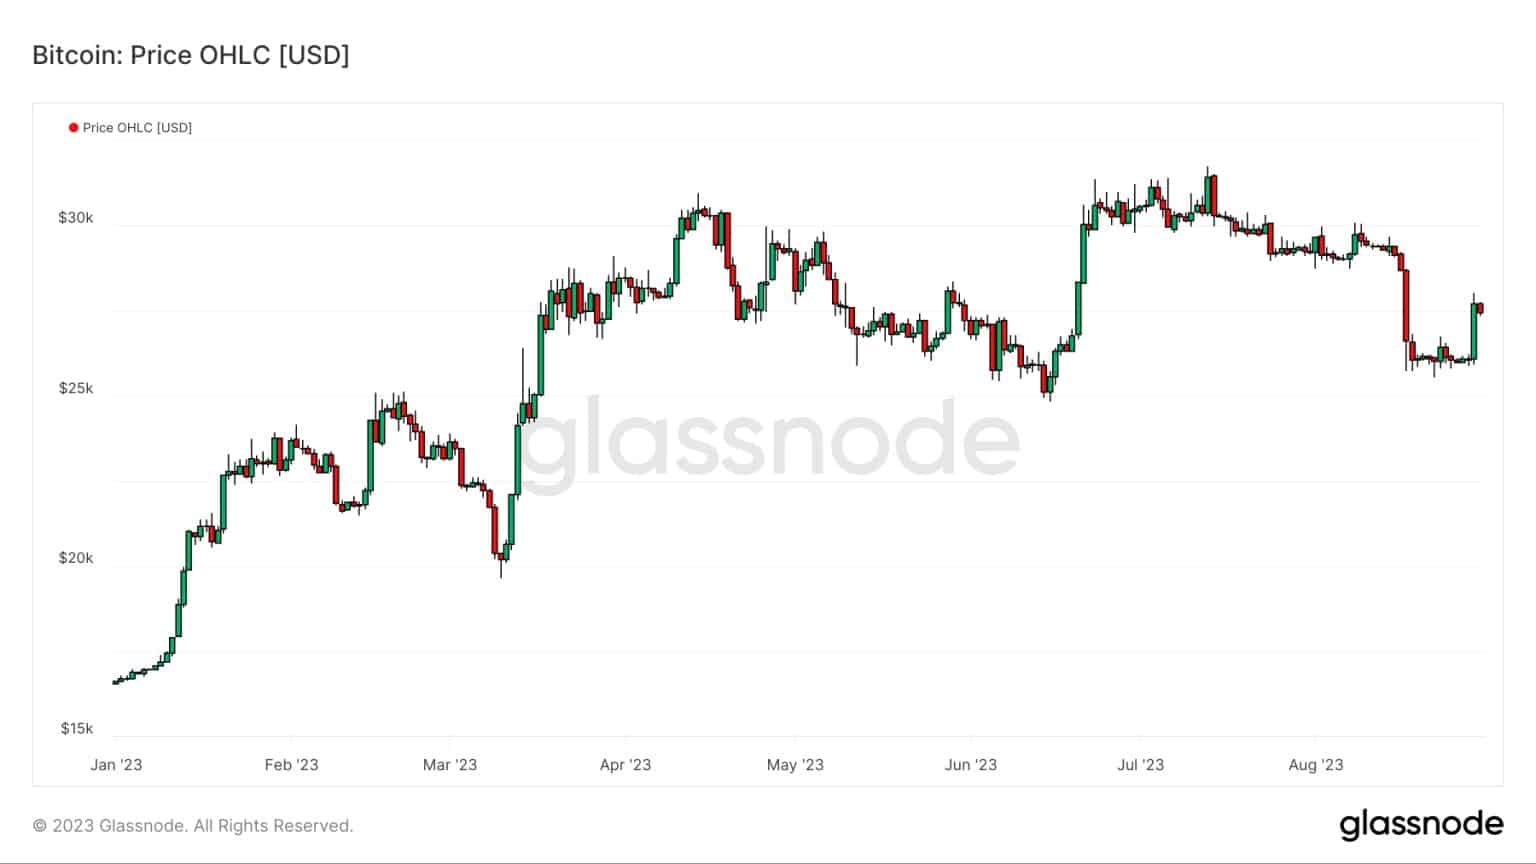
Figure 1: Daily BTC price
While the short-term uptrend could be challenged by a new downtrend in price, today we look at Bitcoin network activity and underlying market trends to take a step back into 2023.
On-chain activity
One of the most popular measures of Bitcoin network activity and adoption is the number of active addresses per day. Here, we will look at the adjusted variant of this metric (in red), which measures the number of active entities, providing a more accurate signal of network usage.
Overall, entity activity seems to follow the cycles of the BTC market, oscillating between peaks of intense activity during the advanced phases of bull markets and periods of reduced activity during bear markets.
We can highlight the presence of a fundamental activity channel, indicating that some participants are still using the network in a sustained manner, even during the most painful moments.
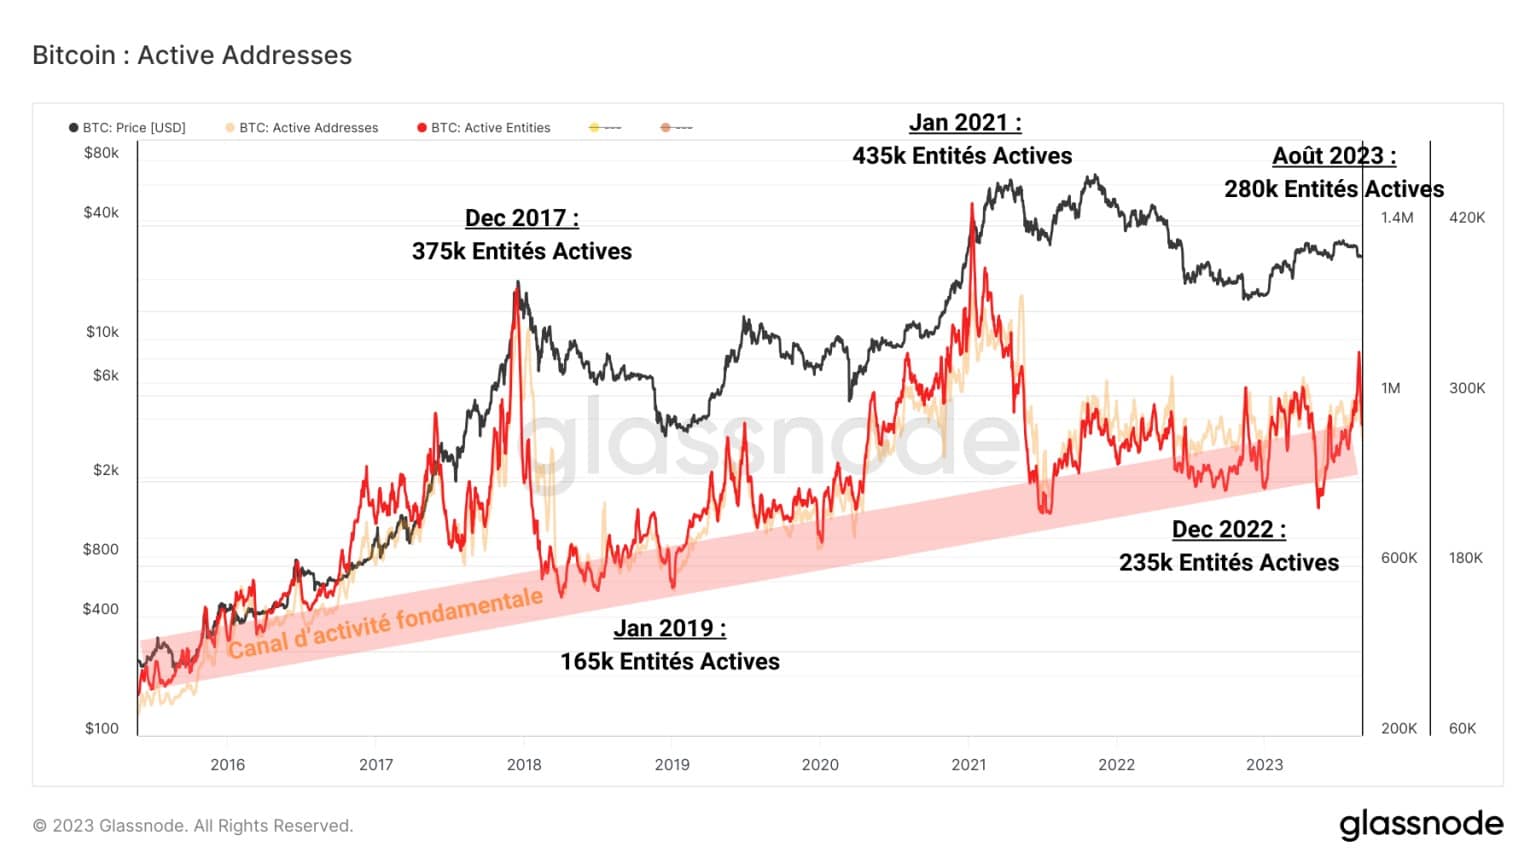
Figure 2: Addresses and Active Entities
This channel exists for two reasons:
- The use of the Bitcoin network for its basic purpose: money transfer, which is little impacted by price cycles;
The opportunism of investors who take advantage of low prices to accumulate BTC.
Currently, we can see that the number of active entities is growing, visibly reproducing the trend formed after the bear market bottom of 2019.
The number of daily transactions carried out by these entities has exploded since the start of 2023, rising from 240,000 tx per day in January to 380,000 tx per day in August.
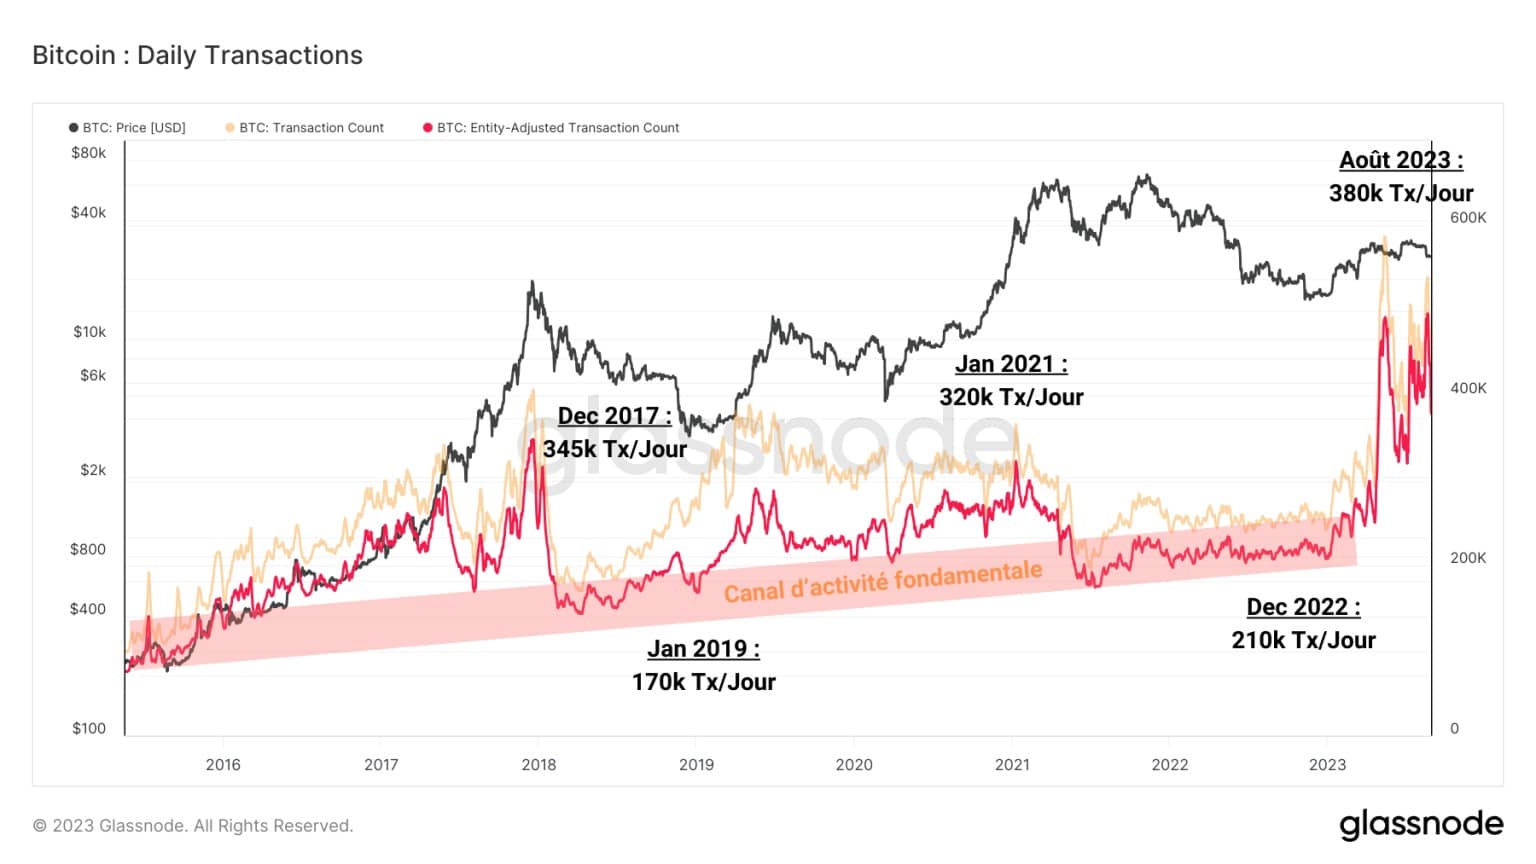
Figure 3: Daily transactions
This increase in activity is also explained by two phenomena:
- The return of investors and speculators following the formation of the bear market bottom in November 2022;
- The advent of Theory Ordinals and Bitcoin Registrations, which now account for a significant proportion of transactions on the network.
A fundamental channel of activity can be identified, but it’s a safe bet that the innovation of Subscriptions will have a significant impact on activity on the Bitcoin network (probably by pushing up metrics).
So we’ll need to keep a close eye on this and potentially find new heuristics to measure how participants use the network.
State of the market
To measure the state of the BTC market, we can do a simple statistical study of the parameters of the BTC economy:
By measuring the value of the historical mean of a parameter and its standard deviations to +/- 1 σ, we can highlight times when the BTC market is in rare or extreme conditions. Overall, these periods coincide with inflection points in the market’s underlying trends.
By applying this method to the MVRV ratio, we can obtain an insight into the latent profitability of the market and therefore the psychological state of BTC holders.
Here, the MVRV did not come close to its historical average after recording an extreme bearish deviation during the second part of 2022.
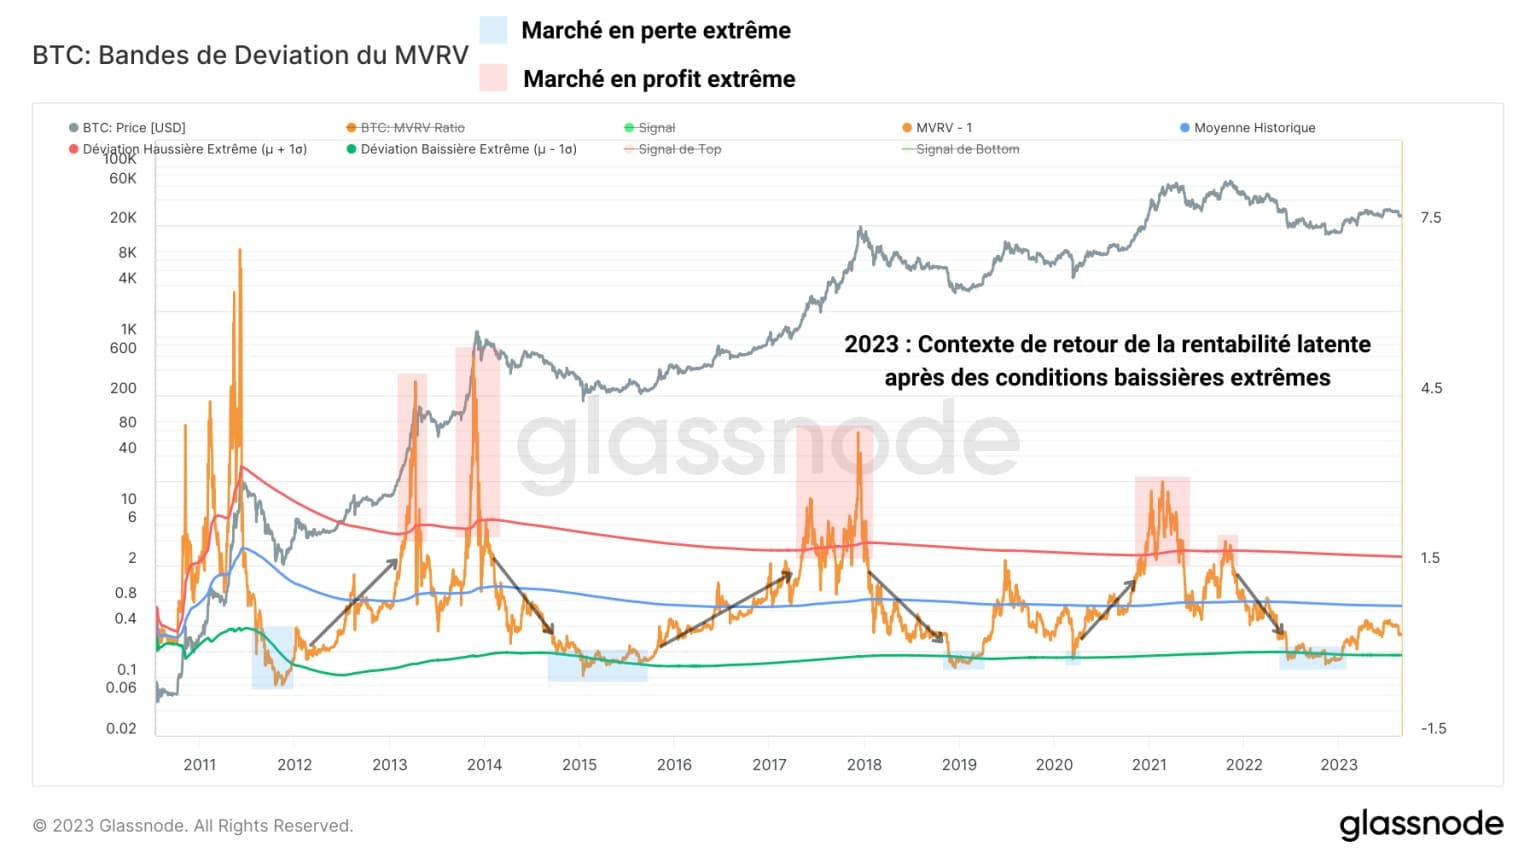
Figure 4: MVRV ratio deviation bands
After an episode of significant latent losses, which led many participants to capitulate, the market has made a rapid recovery that has allowed many opportunists to take profits over the last few months.
Such a market recovery is reminiscent of the rally that followed the bear market of 2019, propelling BTC from $3,000 to $12,000 in just 6 months.
However, the intensity of the 2023 rally was more moderate. It now remains to be seen whether there will be a correction lasting a few months, similar to the one at the end of 2019.
In addition to this statistical study, we can use a model of the BTC market that takes into account:
- The profitability of the supply in circulation;
- Variations in the MVRV ratio;
- The degree of profitability of short-term investors;
- The degree of profitability of long-term investors.
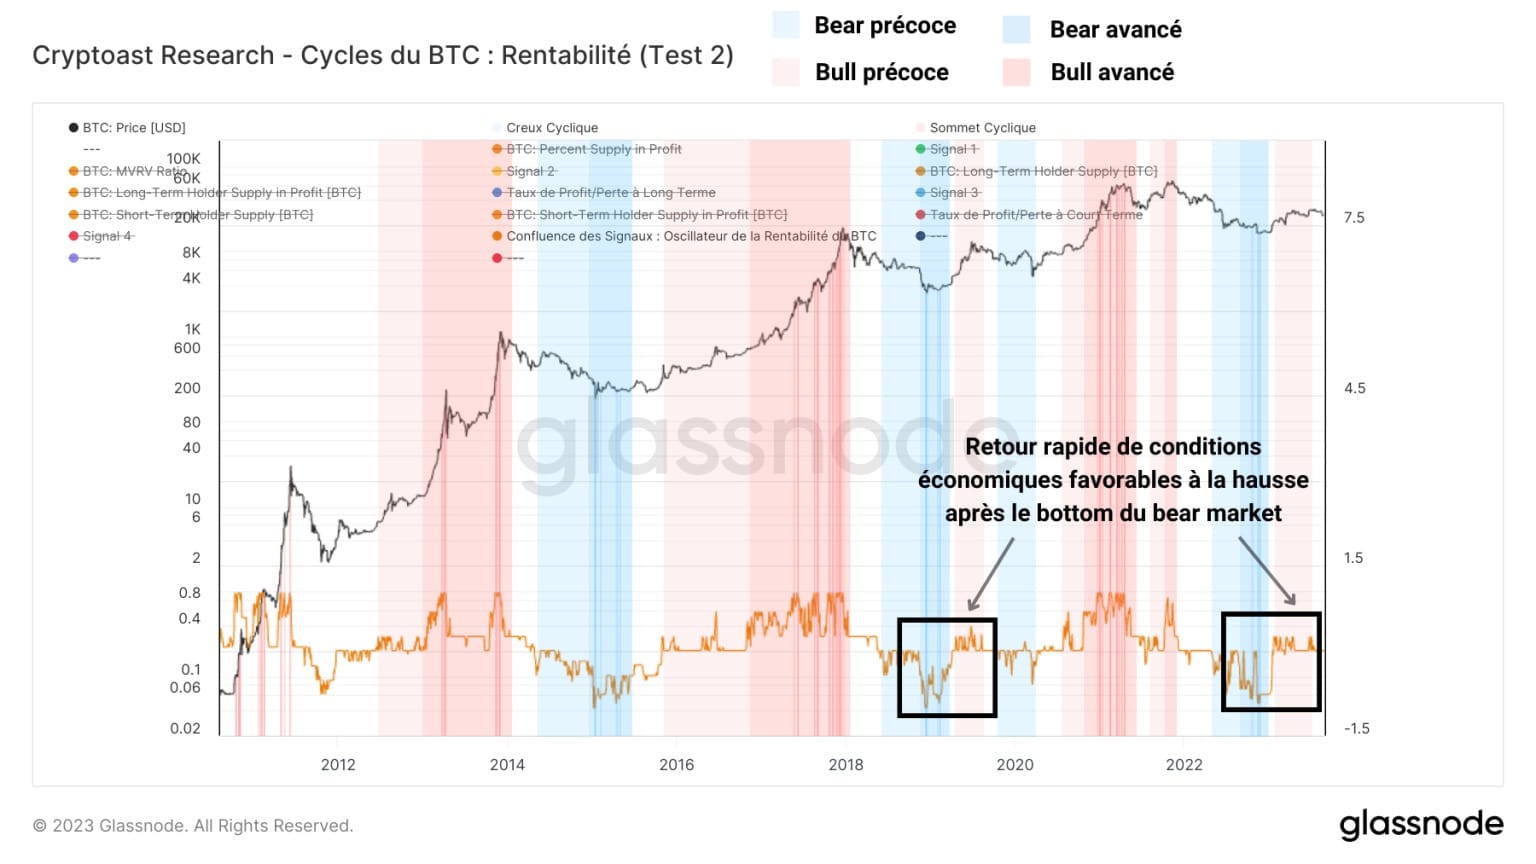
Figure 5: BTC market profitability model
Although this model is still experimental, it highlights the early and advanced phases of bull and bear markets, providing a simple and enlightened reading of the underlying market trend.
As far as the current situation is concerned, it seems that the rapid return of conditions favourable to the upside is taking a form very similar to that of the 2019 rally, the first occurrence of this ‘lightning recovery’ dynamic.
Although the current uptrend is showing signs of slowing in the short term, the structure of the market indicates that an inflection point was formed in November 2022 and that the bear market is behind us.
2023 is likely to be a year of transition, marked by volatility and indecision, alternating between bull and bear dominance as the market matures.
Summary of this on-chain analysis of Bitcoin
This week’s data shows that the number of active entities and transactions is growing. Overall, on-chain activity is signalling a return of interest and engagement from participants, albeit still below the bull market levels of previous cycles.
Moreover, the rapid return of bullish conditions in 2023 appears to be taking a very similar form to the 2019 rally, although the intensity of the current rally is more moderate
2023 is likely to be a year of transition, marked by volatility and indecision, alternating between bull and bear dominance as the market matures. Since short-term conviction has already been undermined over the past two weeks, it now remains to be seen whether a correction lasting a few months, similar to the one at the end of 2019, will occur.