
With the low volatility of the Bitcoin (BTC) price, speculators in the derivatives markets are adjusting their positioning to limit liquidation risk. In addition, a large volume of 3-4 year old BTC was spent on Tuesday 18 October. On-chain analysis of the situation
Volatility hits record lows
The current market gloom is reminiscent of the events of September 2015 and November 2019, as volatility is squeezing the Bitcoin (BTC) price into an ever-shrinking price range.
As seasoned investors and speculators know, the lower the volatility of an asset, the more its energy condenses, the more powerful the directional movement that will follow this consolidation.
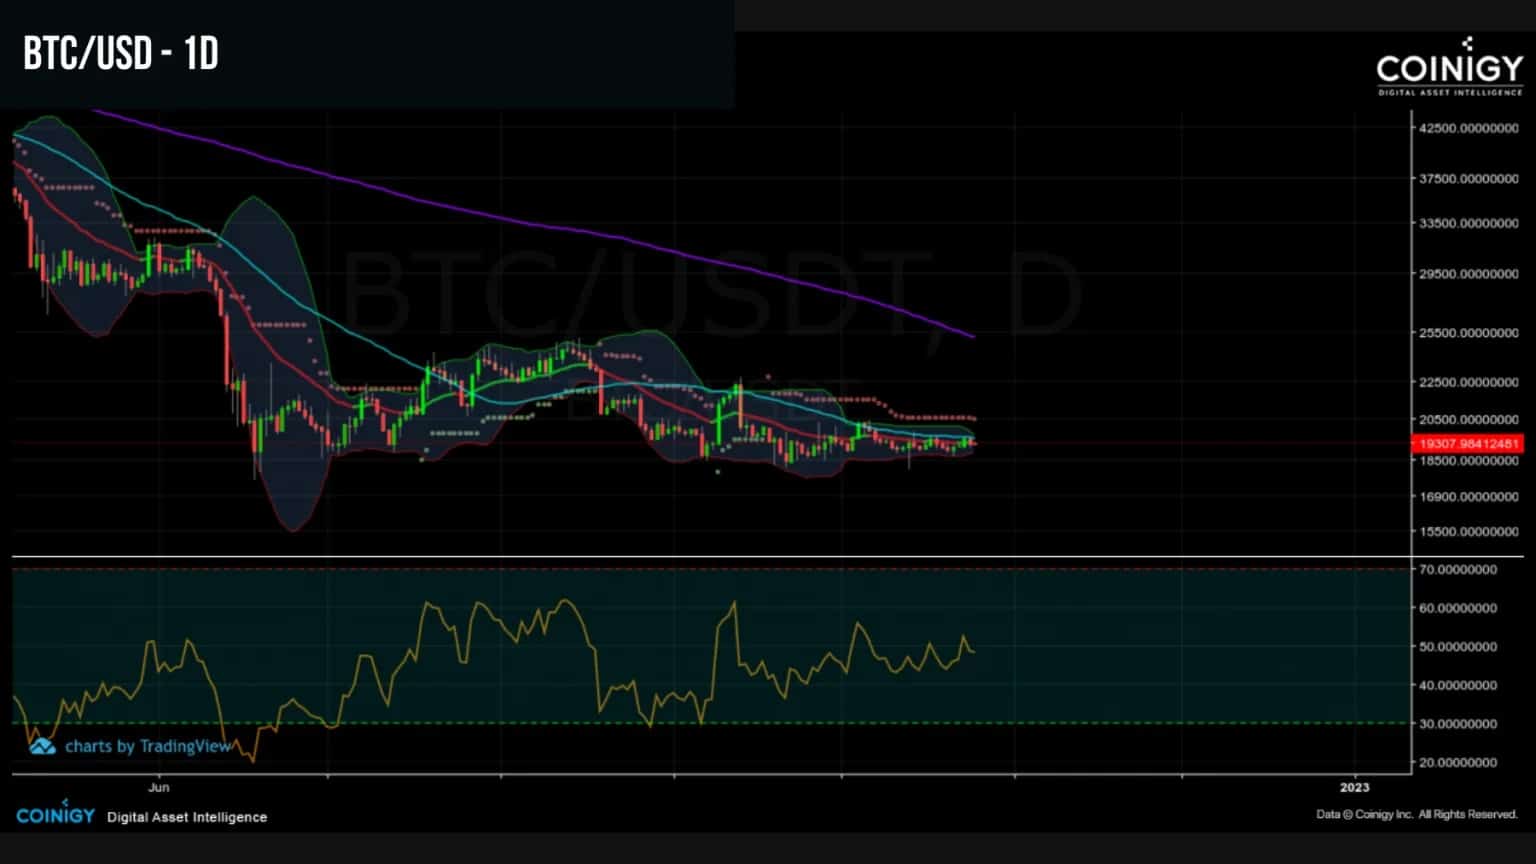
Figure 1: BTC daily price
While HODLing behaviour is holding up and selling pressure is easing in the spot markets, the derivatives markets are showing increasing speculation, accompanied by constructive risk management dynamics.
This week we will assess:
- The activity and positioning of derivatives market participants;
- The recent spending of old UTXOs, dormant since 2018-19.
To better understand and grasp on-chain analysis, check out our podcast on this topic:
Speculators limit risk
Volatility is a technical indicator, measuring the magnitude of changes in the price of BTC. High values indicate that the price change is very high, while low values indicate that the price is stabilizing.
Currently below 20%, the volatility is indicative of the gloomy current consolidation of BTC, which has spent more than one minus between $20,000 and $18,000. It has only recorded such values on very rare occasions in the history of the BTC market.
- In September 2015, the consolidation had been broken from above, triggering the bull run of 2016-17 ;
- In November 2019, it was broken from below, causing the price to fall by 50% in a few weeks.
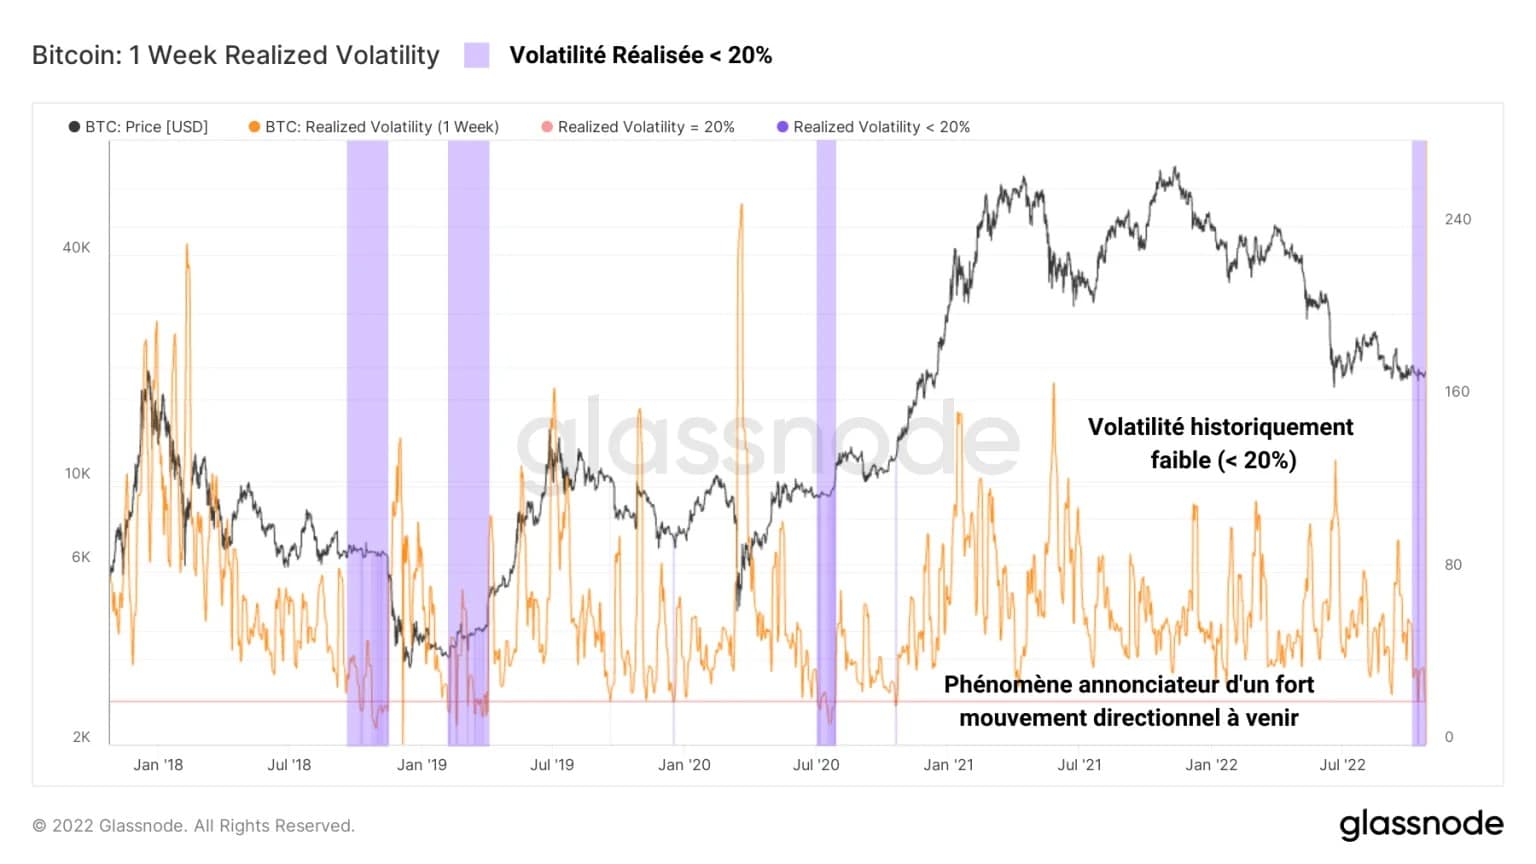
Figure 2: BTC weekly volatility
Although the dynamics of circulating supply and profit/loss distribution are not transposable from one down cycle to the next, it is clear that the BTC price is on the cusp of a major move, the direction of which remains unknown.
While the spot markets do not allow us to assess the potential future direction of the BTC price, the derivatives markets are full of clues that allow us to think further.
The following chart shows the total value (measured in BTC) allocated to Bitcoin futures, called Open Interest (OI). While it remained between 300k BTC and 380k BTC during 2021, the OI has since May 2022 started a new upward momentum.
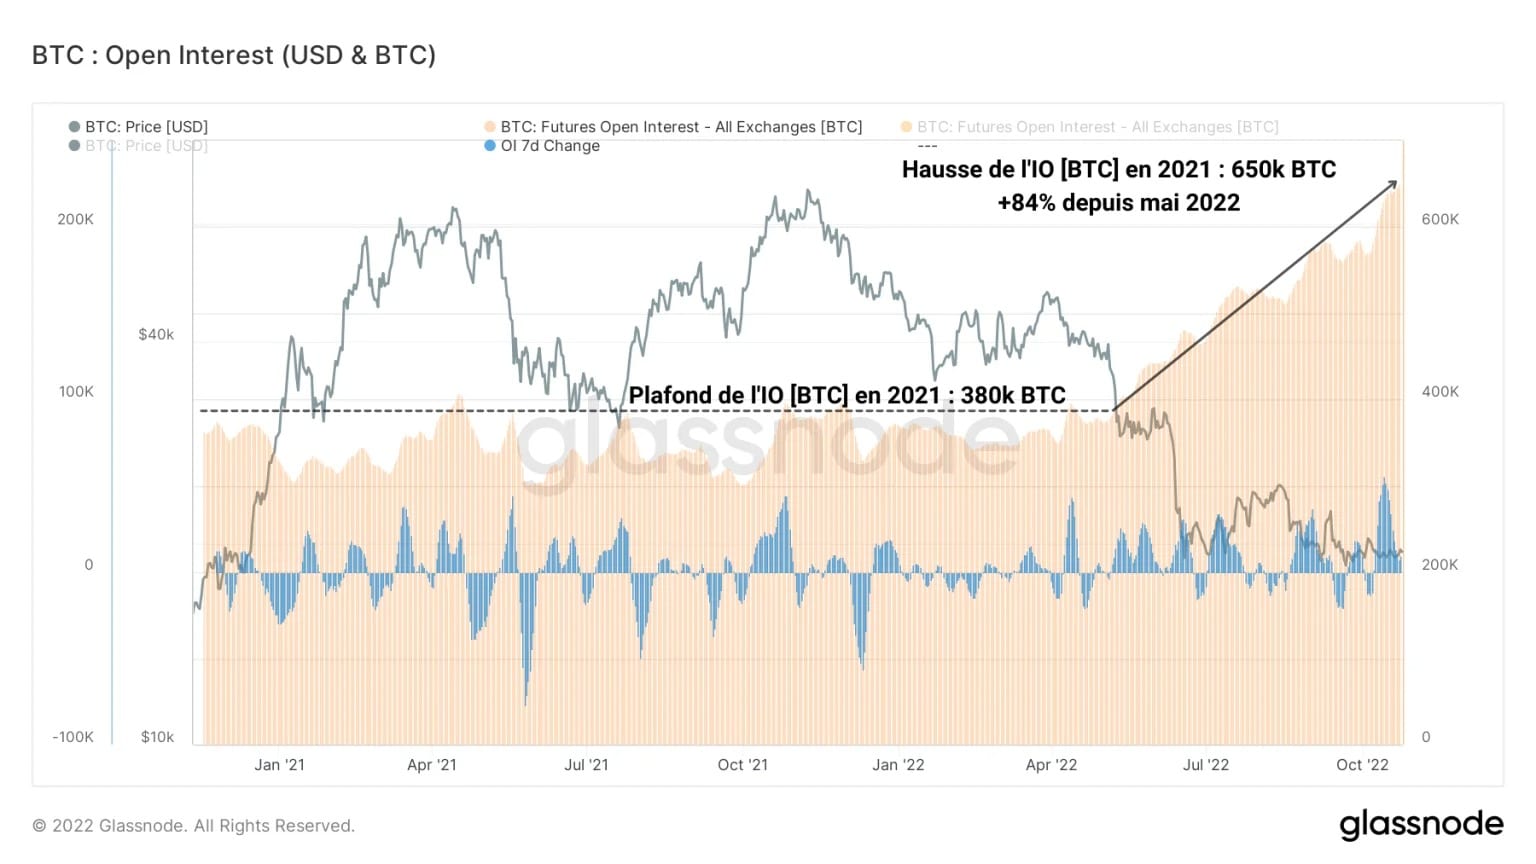
Figure 3: Open interest denominated in BTC
As a sign that speculative interest in BTC is growing despite the adversity of the bear market, OI has risen nearly 80% since May, reaching a new ATH of 650k BTC today.
Speculation has never been so strong, despite a historical price deterioration and macroeconomic components that are deleterious to say the least.
Following this observation, we can separate the OI into two collateralisation modes:
- IO collateralised in crypto (BTC or ETH), which presents high liquidation risks during bearish trends but extreme profitability during bull markets;
- IO collateralised in fiat (cash or stablecoins), which comes with a liquidation ratio unaffected by the value of the collateral, making it less prone to forced position closure.
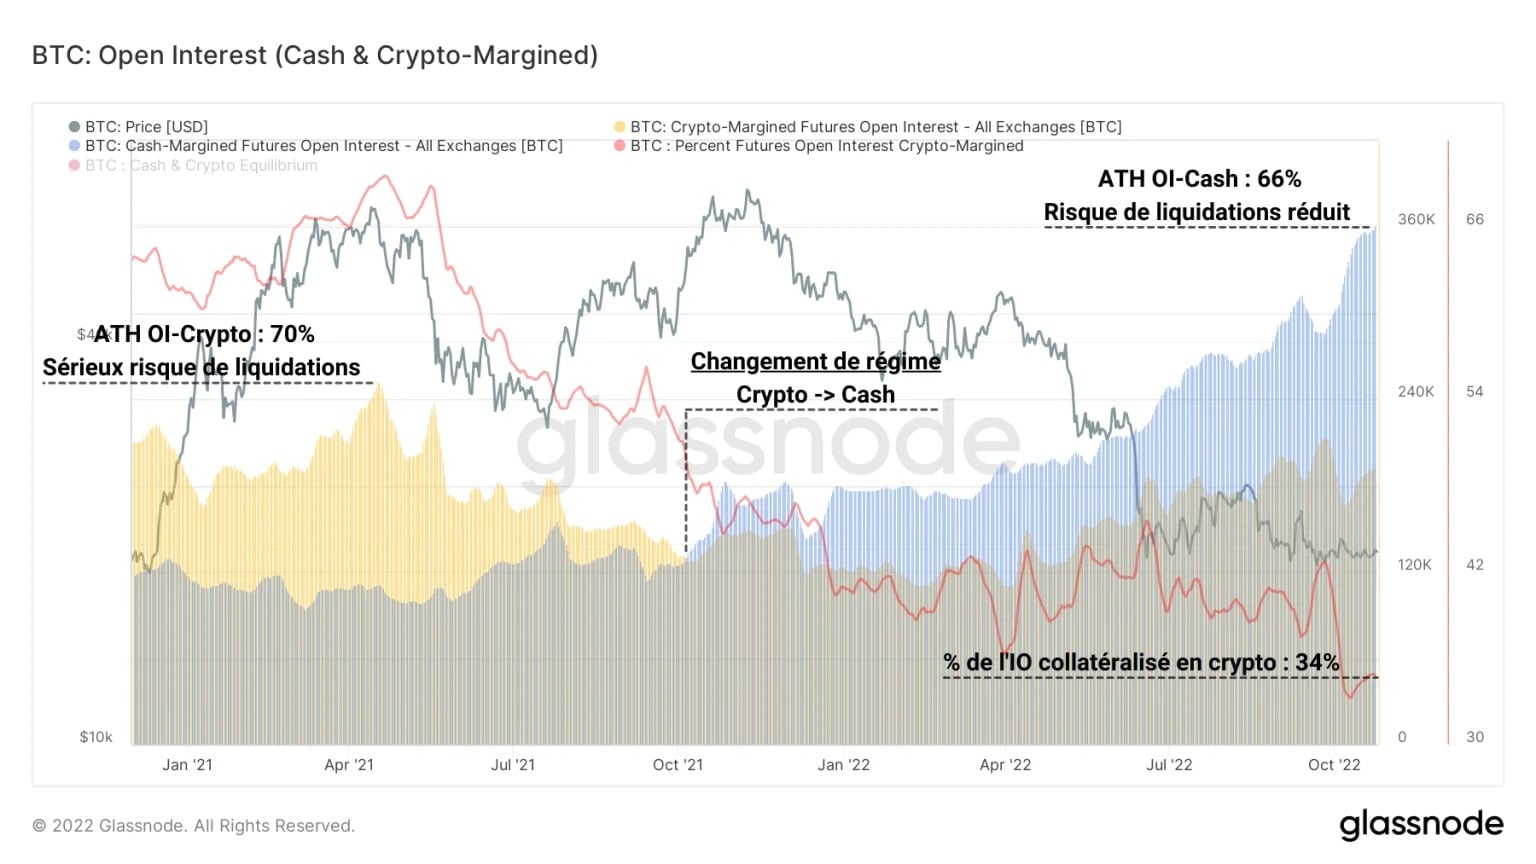
Figure 4: Open interest collateralised in crypto & Open interest collateralised in cash/stablecoin
while the bull market of 2020-21 was marked by a strong dominance of collateralised OI in crypto, it can be noted that a regime change took place during October 2021.
Since then, cash collateralised OI has dominated, a sign that speculators are adopting less risky speculative behaviour and more measured risk management. The current speculative environment is therefore healthier than before, despite significant capital inflows.
If we look at the evolution of the funding rate of futures positions (in yellow), it is currently impossible to identify a clear speculative bias.
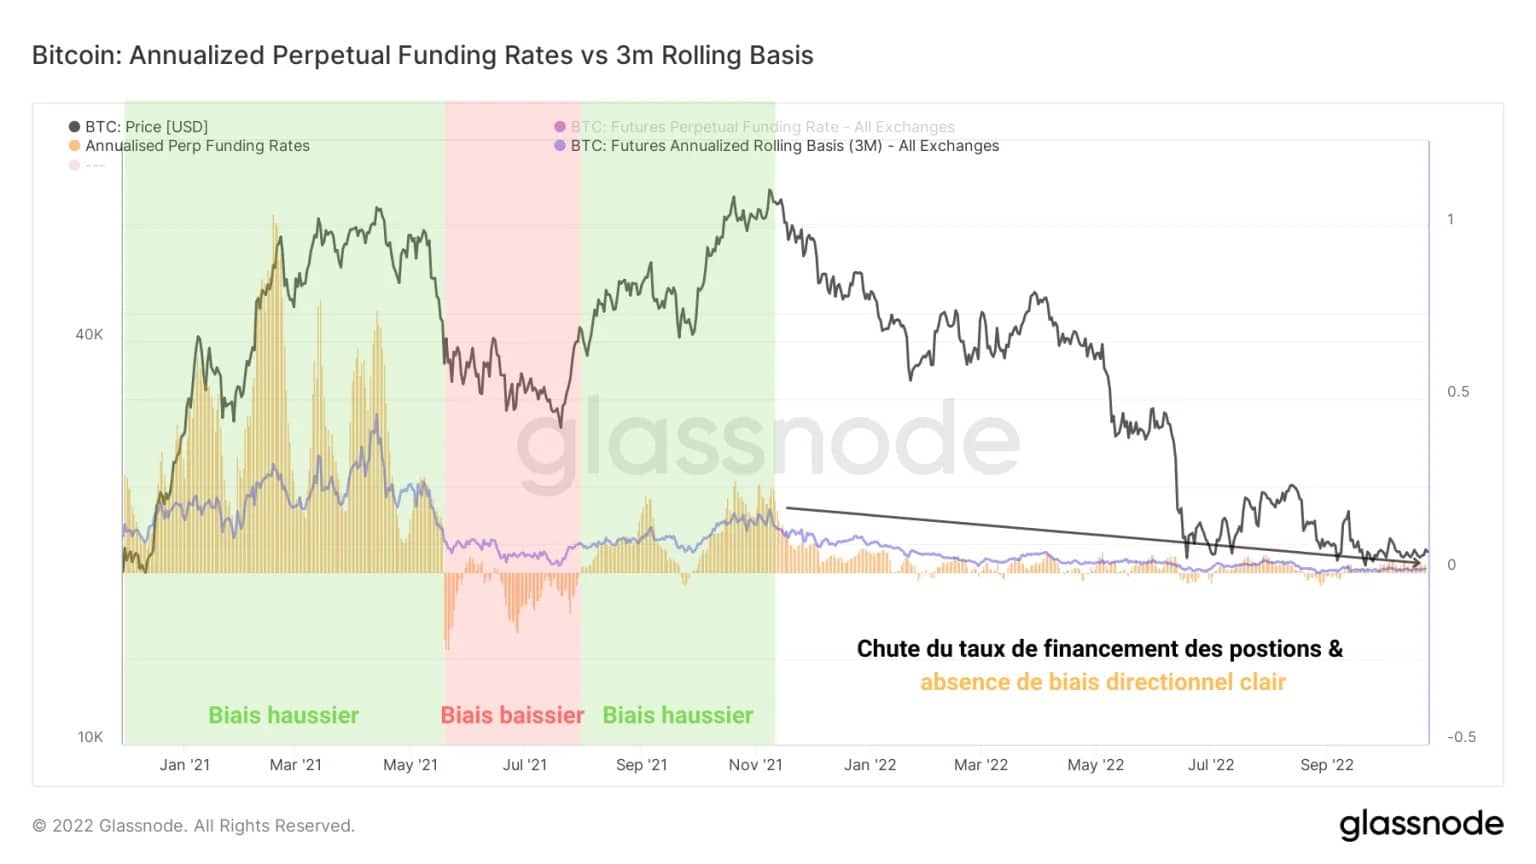
Figure 5: Weekly and annual funding rate for perpetual contracts
Indeed, in contrast to the strong bullish or bearish biases seen in 2020-21, the fall in the financing rate since November 2021 provides no clues worth pursuing.
Contracting ever more strongly, the indicator’s amplitudes are so small that they are currently hovering around their annual average (in blue), with values oscillating between +0.05% and -0.05%.
A notable expenditure of former UTXO
The other subject of this analysis is the recent spend of over 3,000 BTC that are at least 3 years old, which occurred on Tuesday 18 October.
At first glance, a spike in Coin Days (CD) destruction was recorded on this date. Totaling over 3 million destroyed Coin Days, this spike is comparable to those created in September 2021 (bounce off the $30,000 mark) and July 2022 (bounce off the $20,000 mark).
While these spikes did not promote a significant bearish bias, it is not possible to determine whether this expenditure of old UTXO will have a real impact on the price in the near term.
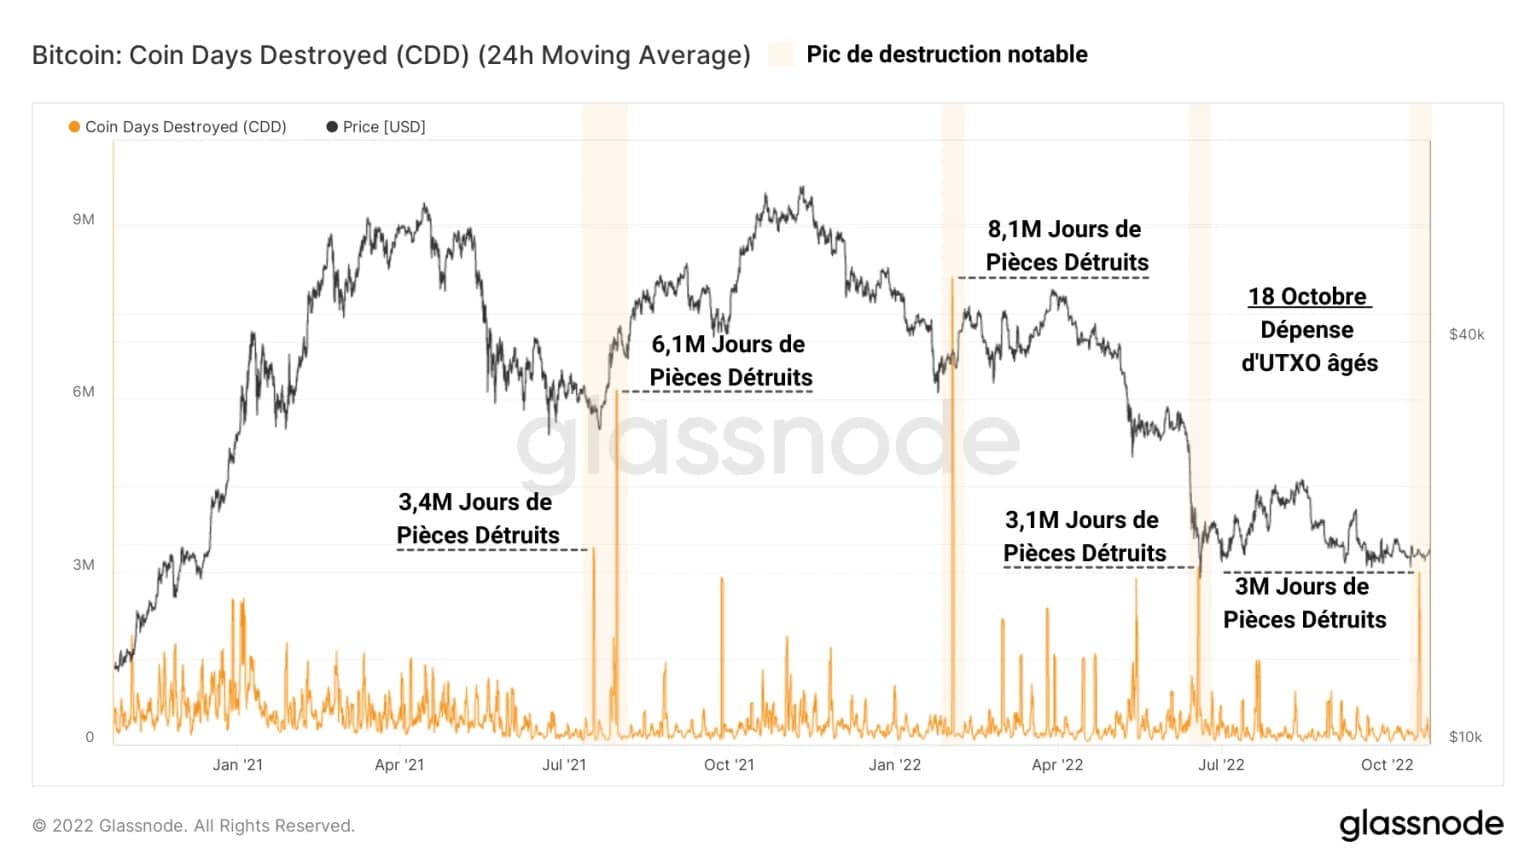
Figure 6: Destroyed Coin Days
The message here is that a significant amount of old UTXO has been spent, but there is no indication that these BTC have been sold. They may have simply been transferred to another wallet, from a different player, or even the same owner.
By observing the liveliness of UTXO, it is possible to gauge the extent to which a spike in Coin Days (CD) destruction impacts the overall saving/spending behaviour of the network.
This metric is obtained by dividing the JPs destroyed over a given period by the total JPs created by the network since its inception. Thus, we can compare the spending behaviour at a given time with its overall historical trend.
The visible drop in liveliness since September 2021 tells us that overall, more JP are created than destroyed. This means that saving behaviour is more present than spending behaviour.
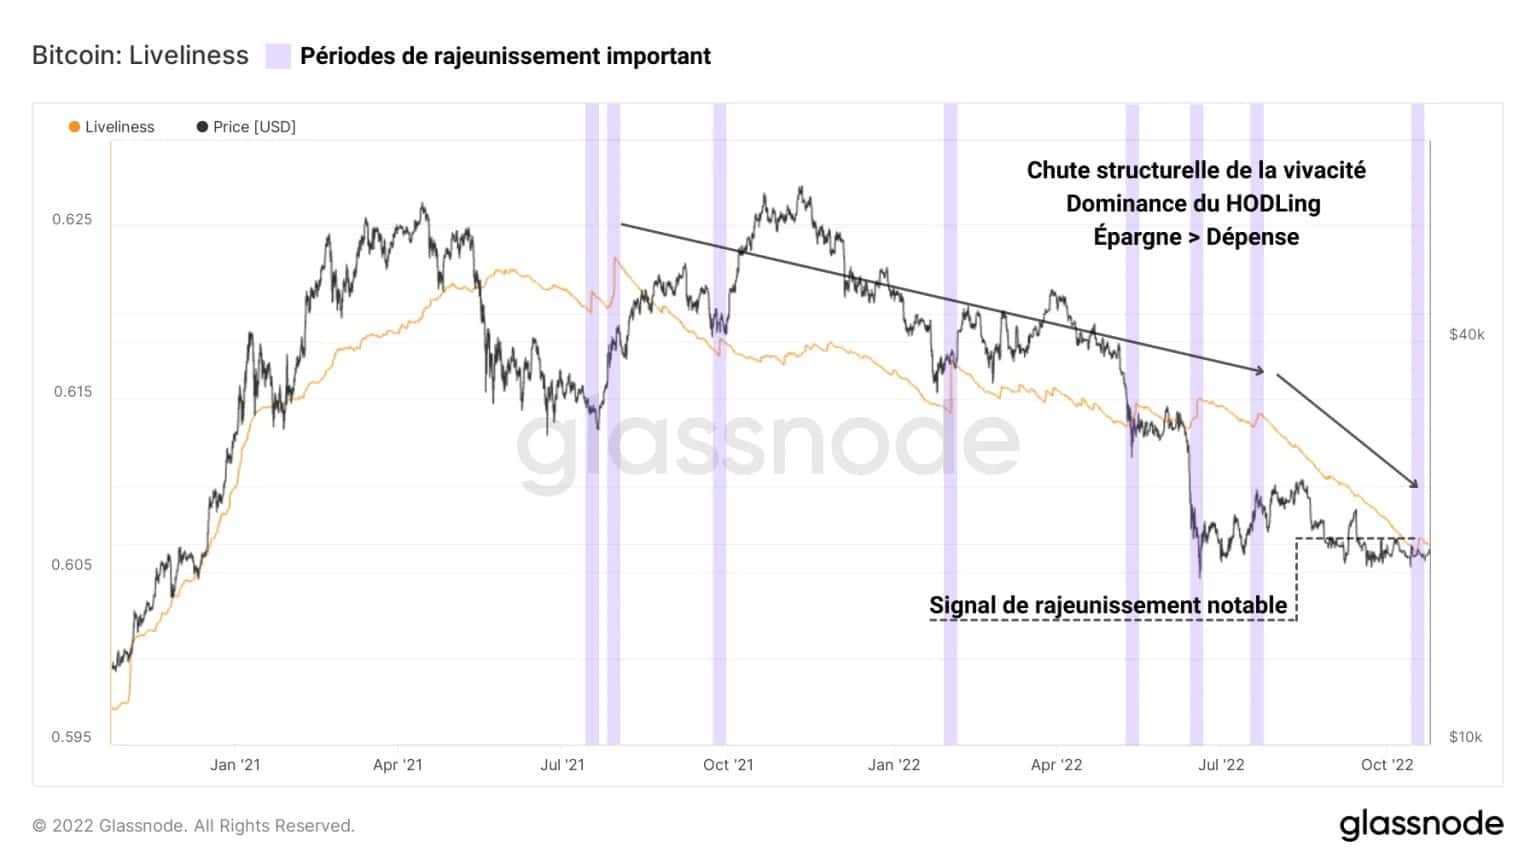
Figure 7: BTC liveliness
That said, on some occasions, spontaneous increases in liveliness signal a notable spike in JP destruction (shown in purple), although it does not challenge the long-term trend in the metric.
This expenditure is relatively small given the large-scale maturation process of UTXO on the chain and does not indicate a significant structural change.
By measuring the profitability ratio of the expenditure of parts older than 155 days (LTH-SOPR), it is possible to plot the profit/loss generated by the expenditure over a given period.
Selecting the period of October 18 last year, it appears that the BTC spent at that time contained aggregate profits of +43%, putting their average cost base at around $11,000.
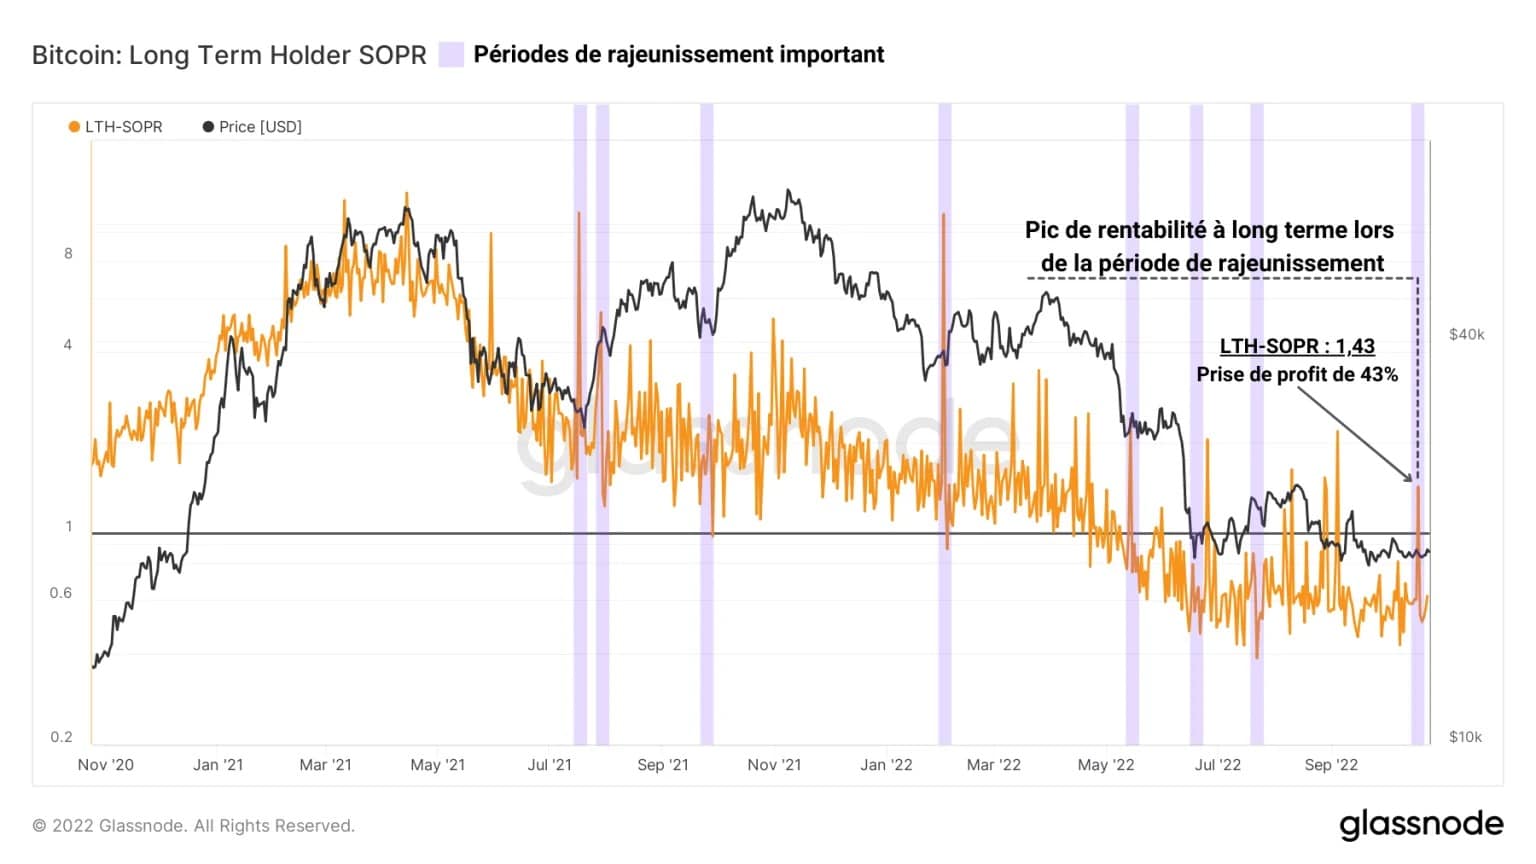
Figure 8: LTH-SOPR
Again, there is no indication that these BTC were deposited and then sold on an exchange or that they were simply transferred in a portfolio reorganisation.
However, it is interesting to know that strong profits are being hedged by these UTXOs, which have a cost basis close to many of the targets held by the more bearish among us.
Summary of this on-chain analysis
Overall, this week’s data indicates that despite very low volatility and a sharp contraction in BTC prices, the pessimistic bias currently has as much weight as the optimistic bias.
Although speculation is rife in the derivatives markets, the trading volumes of futures contracts and the funding rate of perpetual contracts do not indicate a clear bias.
That said, the speculative regime shift underway over the past year signals that speculators favour cash/stablecoin collateral to commit their positions, limiting the risk of cascading liquidation.
This provides the derivatives markets with a healthier speculative structure, which is quite constructive.
In addition, a notable spend of BTC acquired between 2018 and 2019 by addresses with between 1k and 10k BTC, at an average base cost of $11,000 has recently taken place, generating plenty of words on Twitter but in no way impacting the market bias, at least for now.