
Technical tension is high on the crypto market as the bitcoin price has been facing major technical resistance at the $31,000 level since the end of June. Equity market indices are also under resistance and market interest rates have returned to their pre-banking shock levels of March. On the eve of the US NFP report update, bitcoin is very close to making its technical choice for its July trend.
U.S. federal bond yields under intense scrutiny
Almost 4 months after the crisis in the US regional banks, the Western financial markets are once again in a delicate situation with regard to financing costs. The credit market, the largest of all asset classes in terms of stock volume, is seeing its bond yields return to the levels that triggered the failures of some US regional banks in March, forcing the Federal Reserve (FED) at the time to put in place an emergency liquidity plan.
At a time when the Fed is showing no sign of easing its monetary policy (underlying inflation is still far too high), market interest rates are reaching levels that could once again put businesses, banks and some consumers at risk.
Among all these interest rates, it is the 10-year US government bond yield that is the benchmark for judging the absolute level of financing costs on the market. Since the introduction of the restrictive monetary policies of the Western Central Banks, every time this bond rate has exceeded 4%, it has triggered bankruptcies in the Western financial system; the value of this interest rate is 3.97% at the time these lines are written.
On the eve of the publication of the NFP report in the United States, the Friday 7 July update of statistics on the US labour market, high finance is hoping for a downward turn in this benchmark rate in order to avoid another shock to risky assets on the stock market.
As far as the bitcoin price is concerned, the bearish reversal in bond yields in March gave it a strong bullish impetus and enabled it to break through resistance at $25,000.
Clearly, it is imperative that US 10-year bond yields do not rise above the 4 or 4.20% zone to allow the price of BTC to finally break free of the major technical resistance at $31,000.
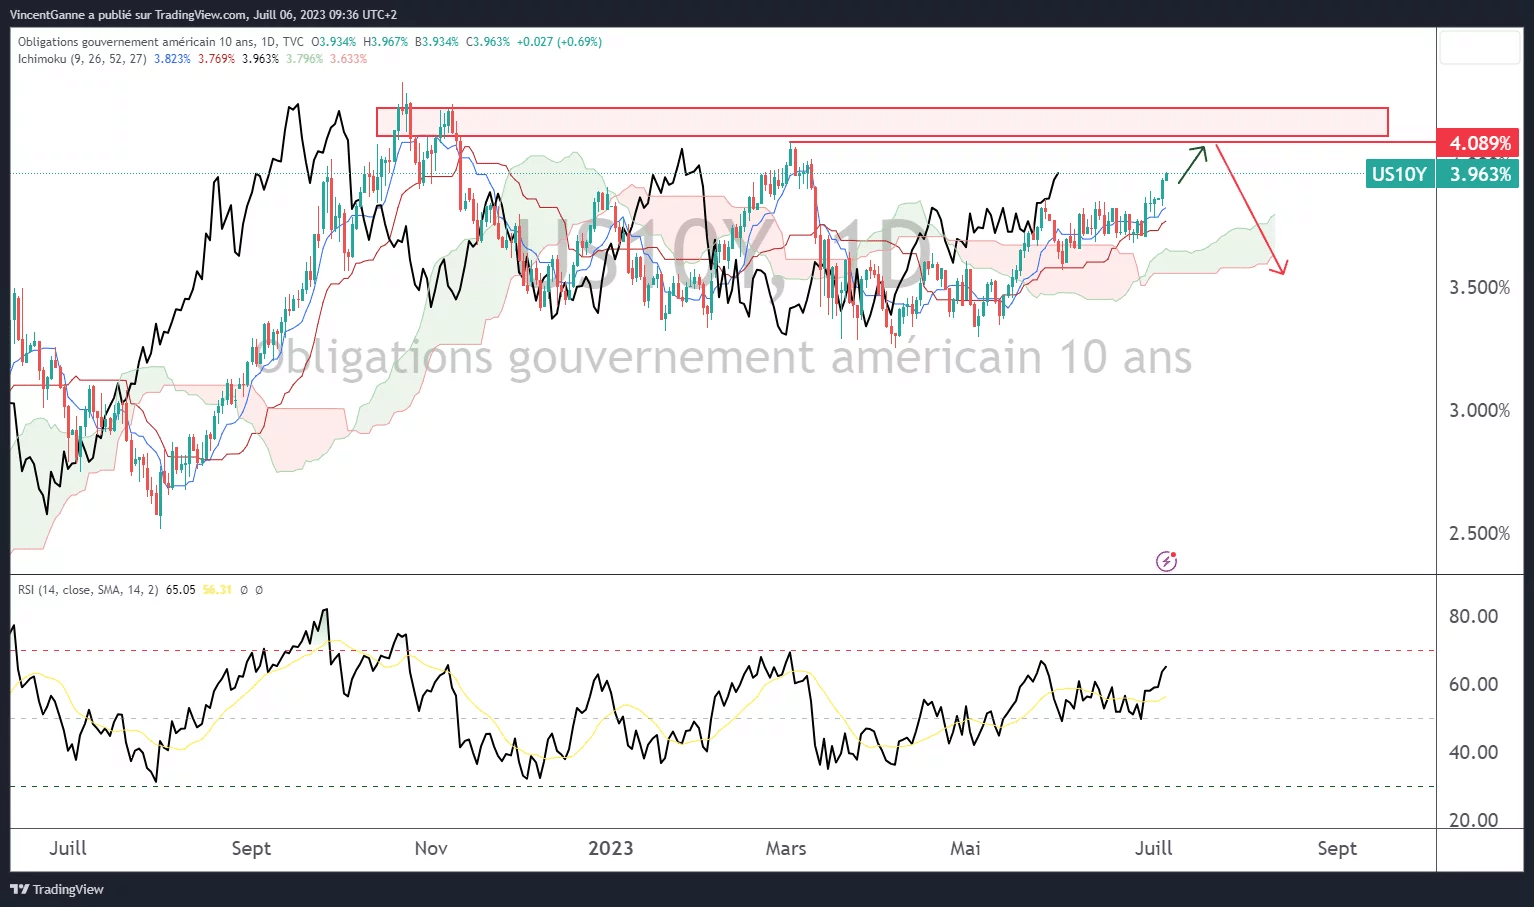
Graph produced with the TradingView website showing the 10-year US federal bond rate
Potential upside if bitcoin breaks through resistance at $31,000
Let’s talk about this resistance at $31,000, which the market has been facing since the bullish impulse from the banking crisis came to an end at the beginning of April. You need to understand that this resistance is weekly in dimension, as it is identified on the weekly time-horizon chart (in particular, it is the SSB of the ichimoku system).
As the chart below shows, it is also from $31,000 onwards that selling liquidity appears en masse, so this is a champagne cork ready to pop, but it still has to be triggered.
The market could take its time, pausing for a long time before trying a breakout. On the other hand, you can be sure that the day this resistance breaks, the bitcoin price will head for $36,000.
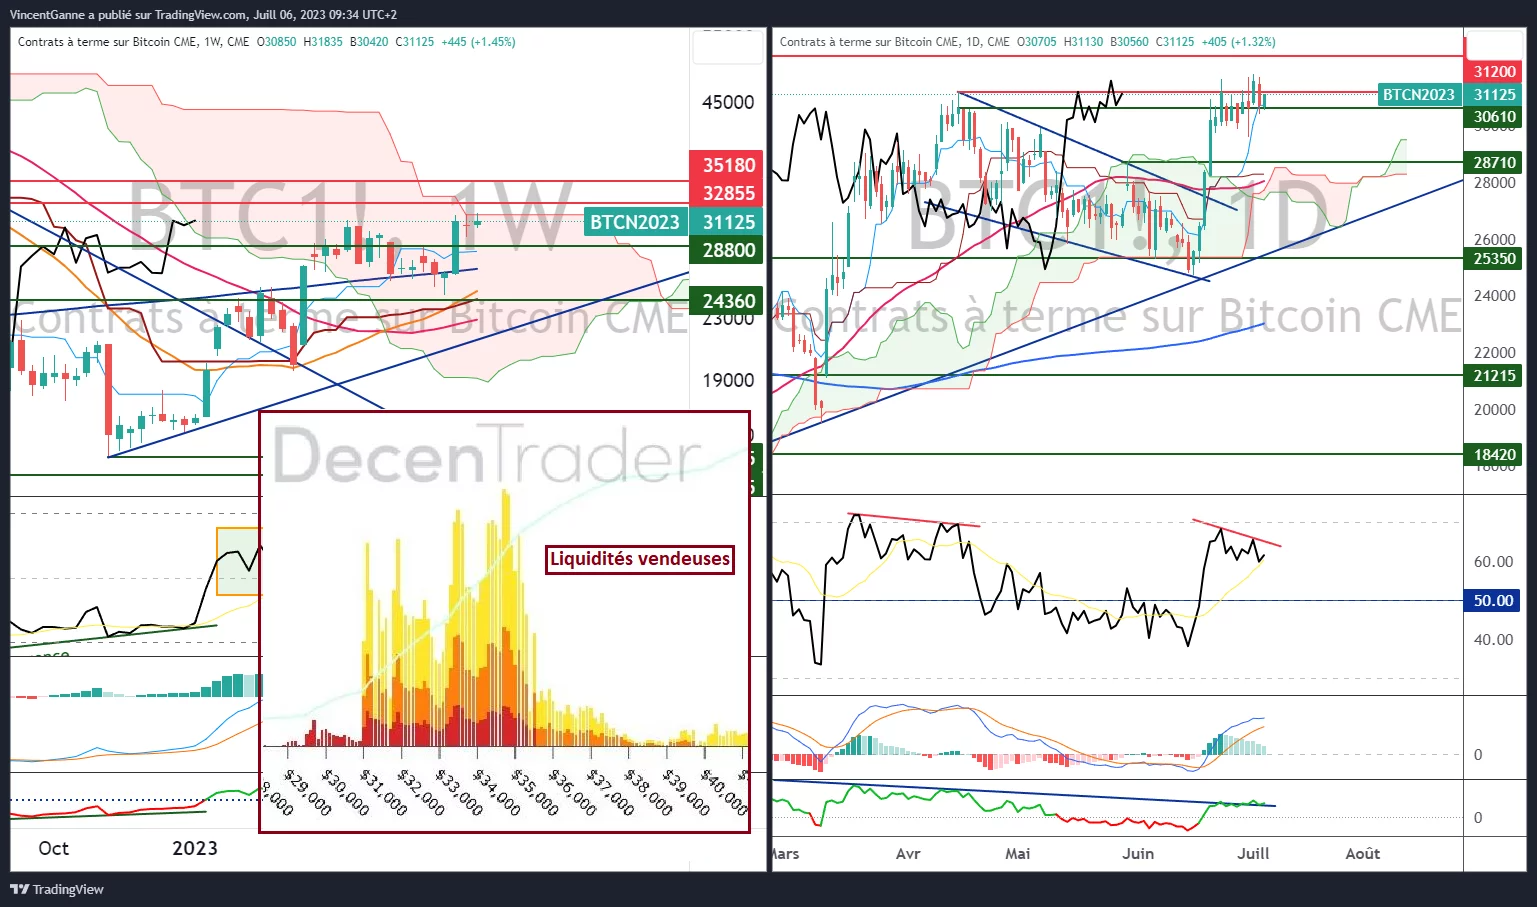
Graph produced with the TradingView website showing the weekly and daily Japanese candlesticks for the bitcoin price, with the inset map of selling liquidity above $31,000