The Bitcoin network is once again very busy following the arrival of a new wave of Text/BRC-20 transactions. Meanwhile, speculators’ profit-taking behavior is slowing, bringing us closer to a short-term bullish bias test point.
Market bottlenecks and network congestion
Following November’s sharp rise, the price of bitcoin (BTC) is stagnating between the upper $38,000 mark and plausible support between $36,000 and $35,000. As the price takes a breather and market momentum returns to neutral, on-chain activity picks up again, with Inscriptions transactions flooding the mempool.
Today we’ll be documenting both activity on the Bitcoin network and the behavior of speculators on the BTC market.
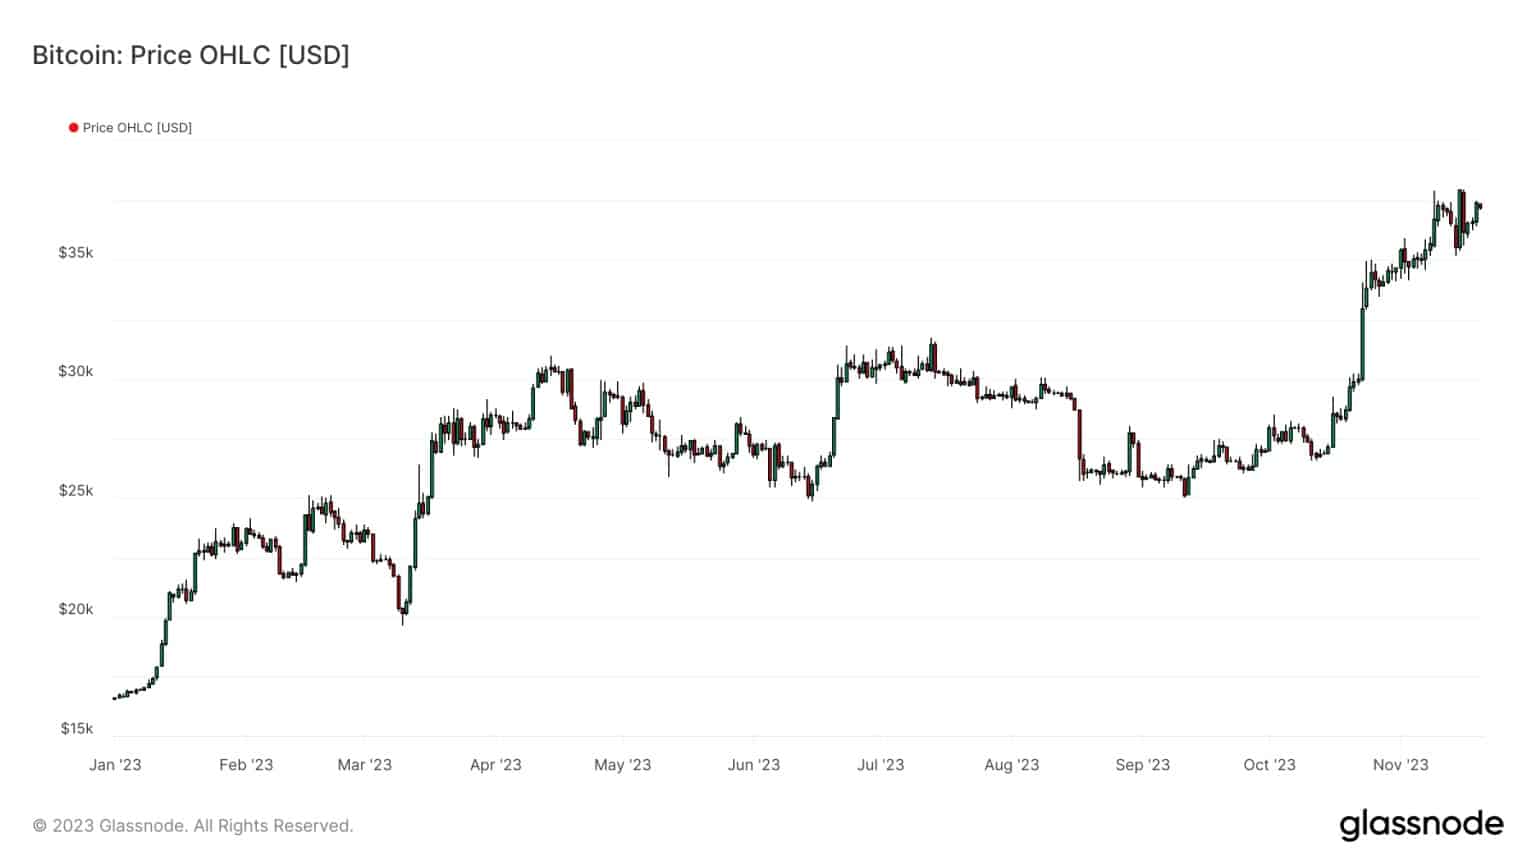
Figure 1: Bitcoin (BTC) price
Strong upturn in registrations
Since our last Subscriptions survey, the Bitcoin network has seen a noticeable increase in on-chain activity. It seems that a fourth wave of Inscriptions, still dominated by the text/BRC-20 format, is underway and is once again causing palpable congestion.
Indeed, the number of pending transactions in the mempool has been rising since the end of October, reaching the levels recorded during previous waves of text/BRC-20 Inscriptions.
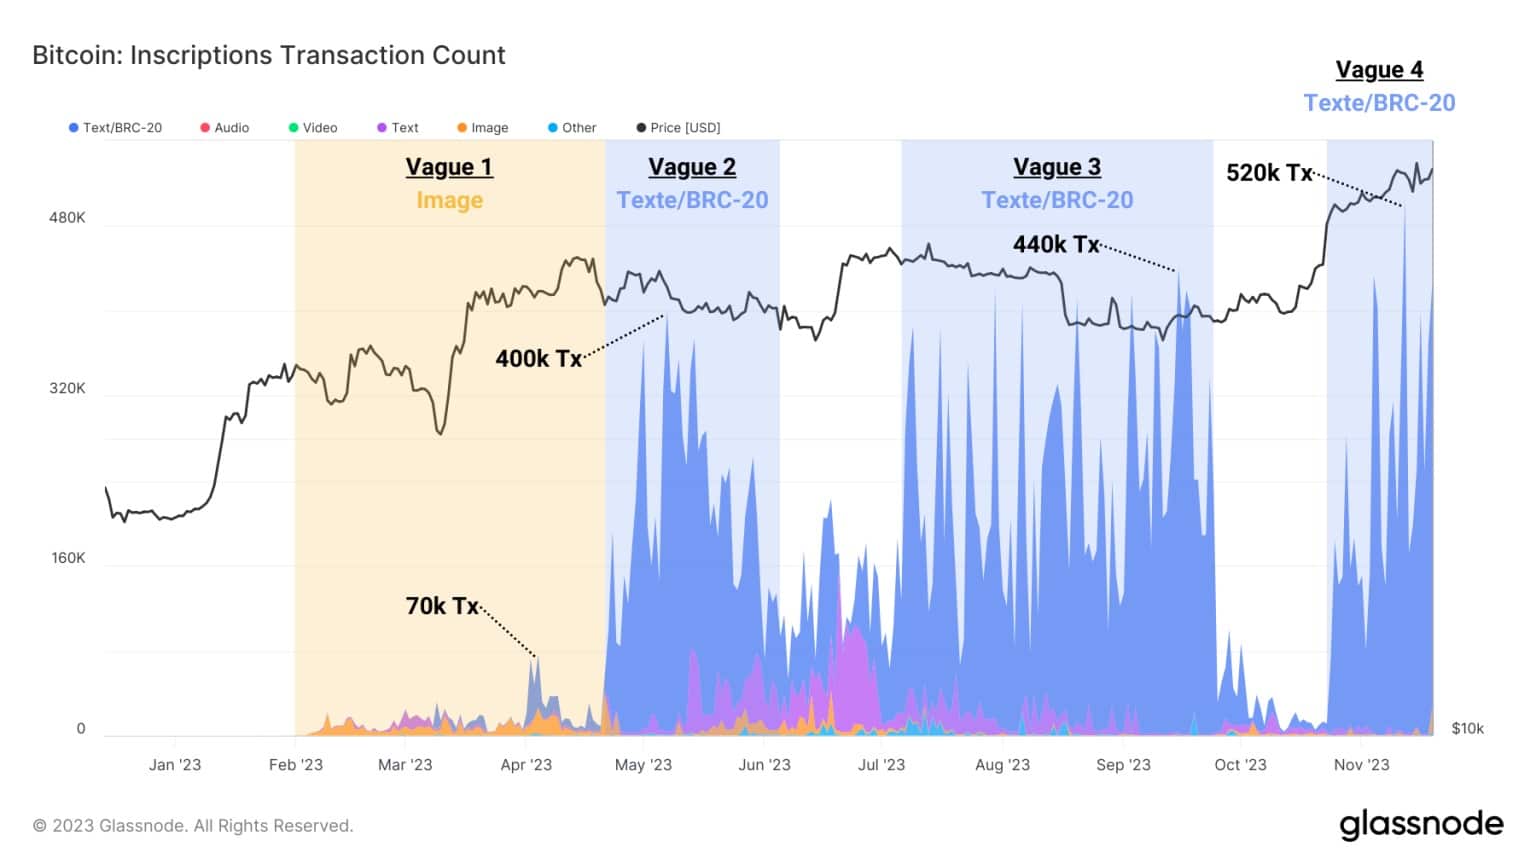
Figure 2: Number of daily Registration transactions
These block-space-intensive transactions are nonetheless very numerous, often accounting for more than half of all transactions carried out in the course of a day. What’s more, the share of transaction fees paid by Registrations has resumed an upward trend, reaching almost 45% of total fees in recent days.
This means that a substantial volume of BTC is being spent by Subscription creators to see their transaction included in the next block, accounting for more than a third of total fees.
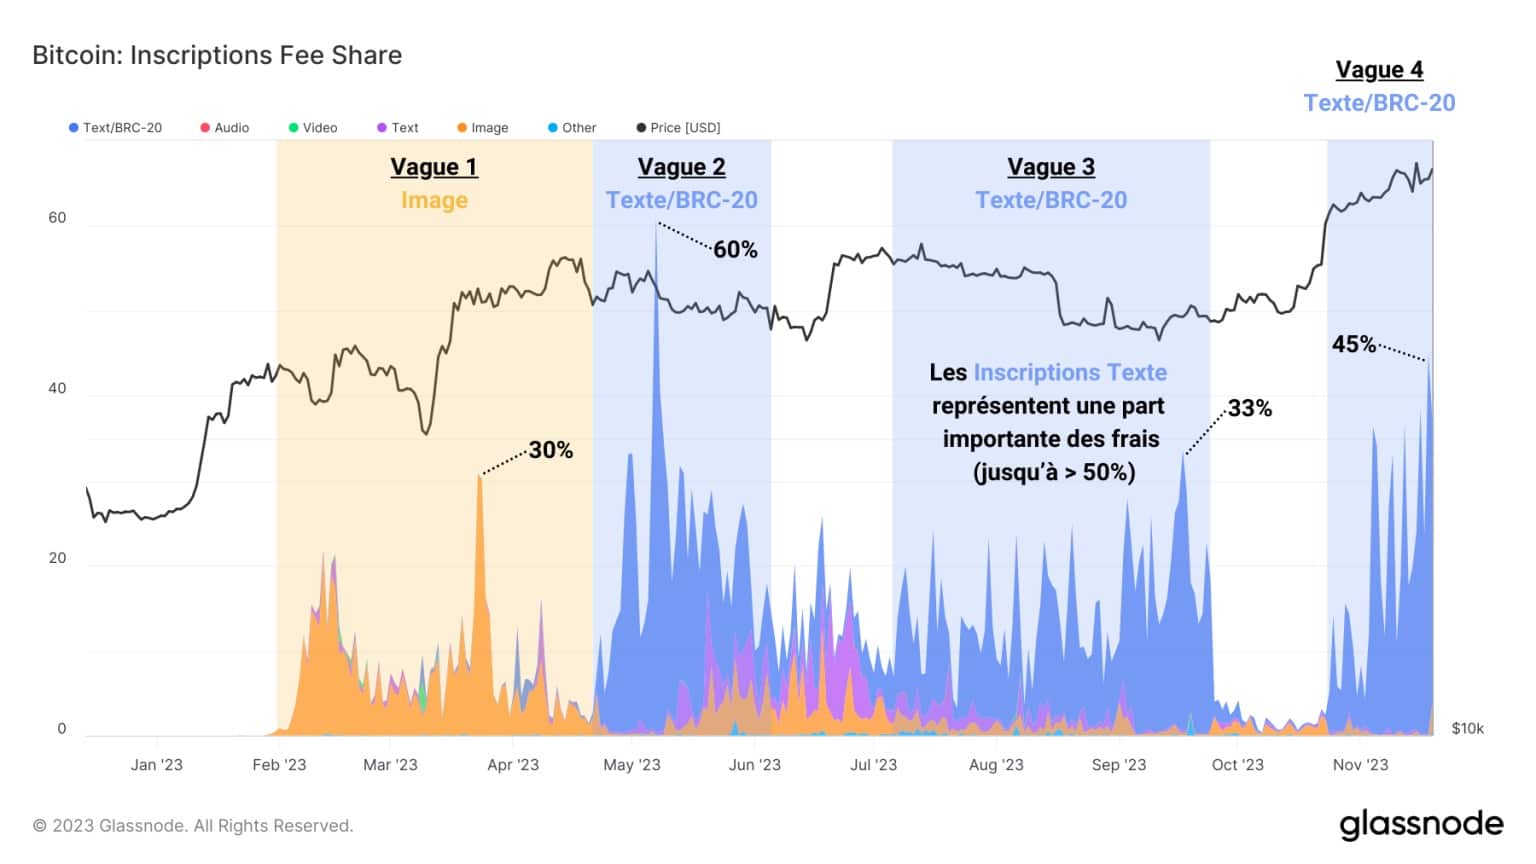
Figure 3: Share of daily transaction fees associated with Listings
The high fees associated with Inscriptions transactions enable a large number of them to benefit from a priority that increases their consumption of space in recent blocks, in turn causing upward pressure on the fees market.
Combining the congestion of the Bitcoin network with this rise in fees, we can observe a massive accumulation in the number of transactions in the mempool, with almost 295 blocks pending. This situation, while unpleasant for some network users, is particularly welcome and profitable for Bitcoin miners.
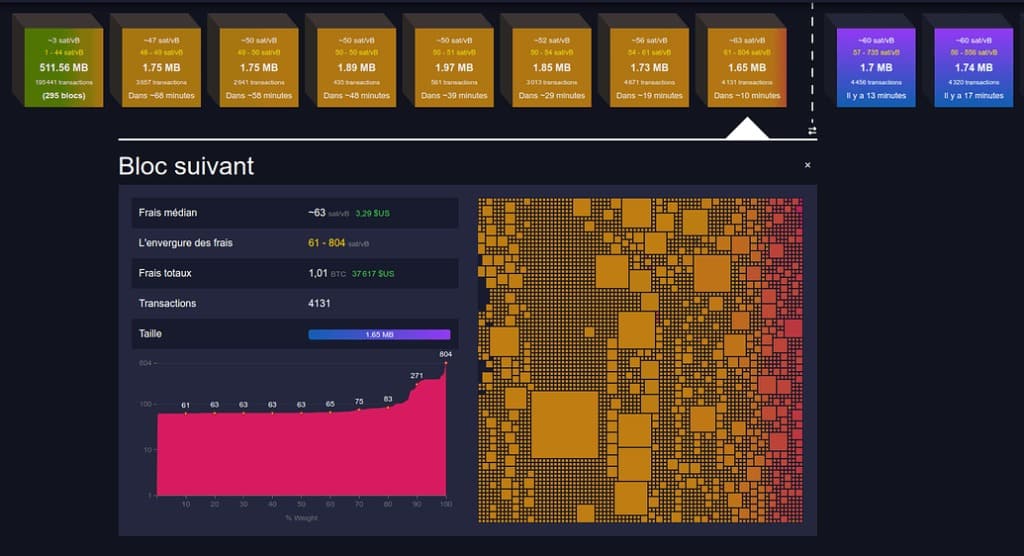
Figure 4: Visualization of the Bitcoin mempool
Test of short-term bullish bias
Since the end of October, the Bitcoin price has been attracting a lot of attention due to the bullish breakout of the $30,000 level. As we have seen, this rise has enabled investors and speculators to reach a level of latent profit sufficient to generate a period of palpable profit-taking.
In terms of speculator behavior (STH), we can observe a divergence between BTC price action and profit-taking intensity:
By measuring the profit/loss status of volumes deposited by speculators on centralized exchanges and assuming that these BTC are deposited for spending purposes, we gain a clear insight into short-term spending behavior:
Red: Volumes of BTC deposited at a loss (taking a loss) ;
Green: Volumes of BTC deposited in profit (profit-taking) ;
Blue: Net flows (profit – loss)
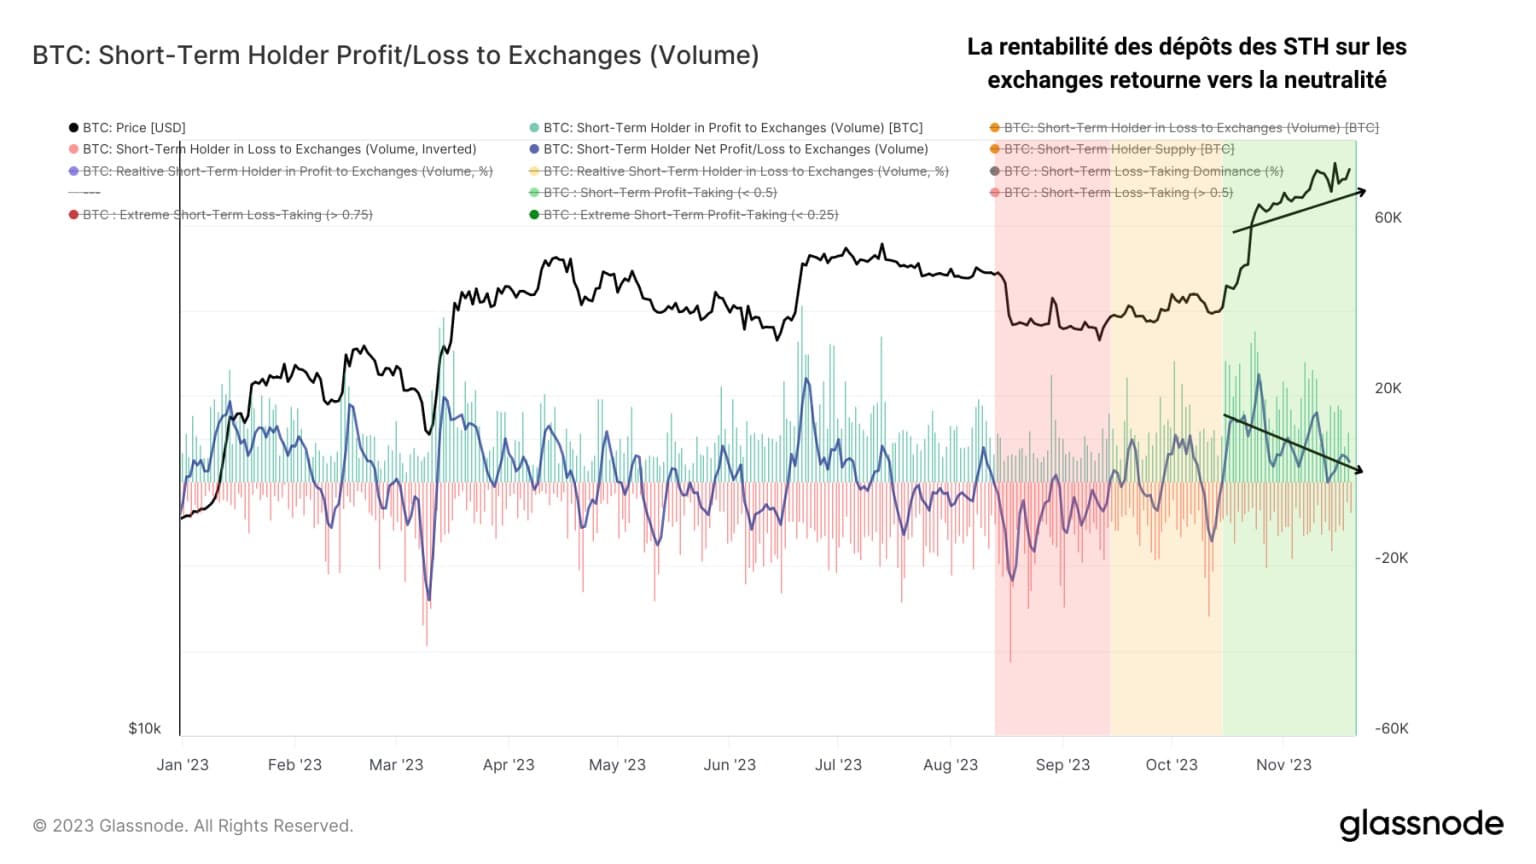
Figure 5: STH profit/loss deposits on exchanges
Thus, it appears that the profitability of speculators’ deposits on exchanges has been gradually slowing down in recent weeks, and is now approaching neutrality.
A certain logic seems to be emerging in three stages:
- Increase in inflows during the uptrend (BTC deposits and profit-taking);
- Stagnating inflows as the trend continues (late profit-taking);
- Slowdown and fall in inflows as the price prepares to correct (end of profit-taking and preparation for a potential wave of loss-taking).
With the STH-SOPR corroborating these observations, we are able to recognize that short-term profit-taking behavior has faded to the point of testing the neutral zone (STH-SOPR = 1).
This indicates that a test of the short-term bullish bias can be expected in the days ahead. Over the course of 2023, divergences between STH-SOPR and the BTC price have often resulted in a price correction ranging from – 5% to more than – 15%.
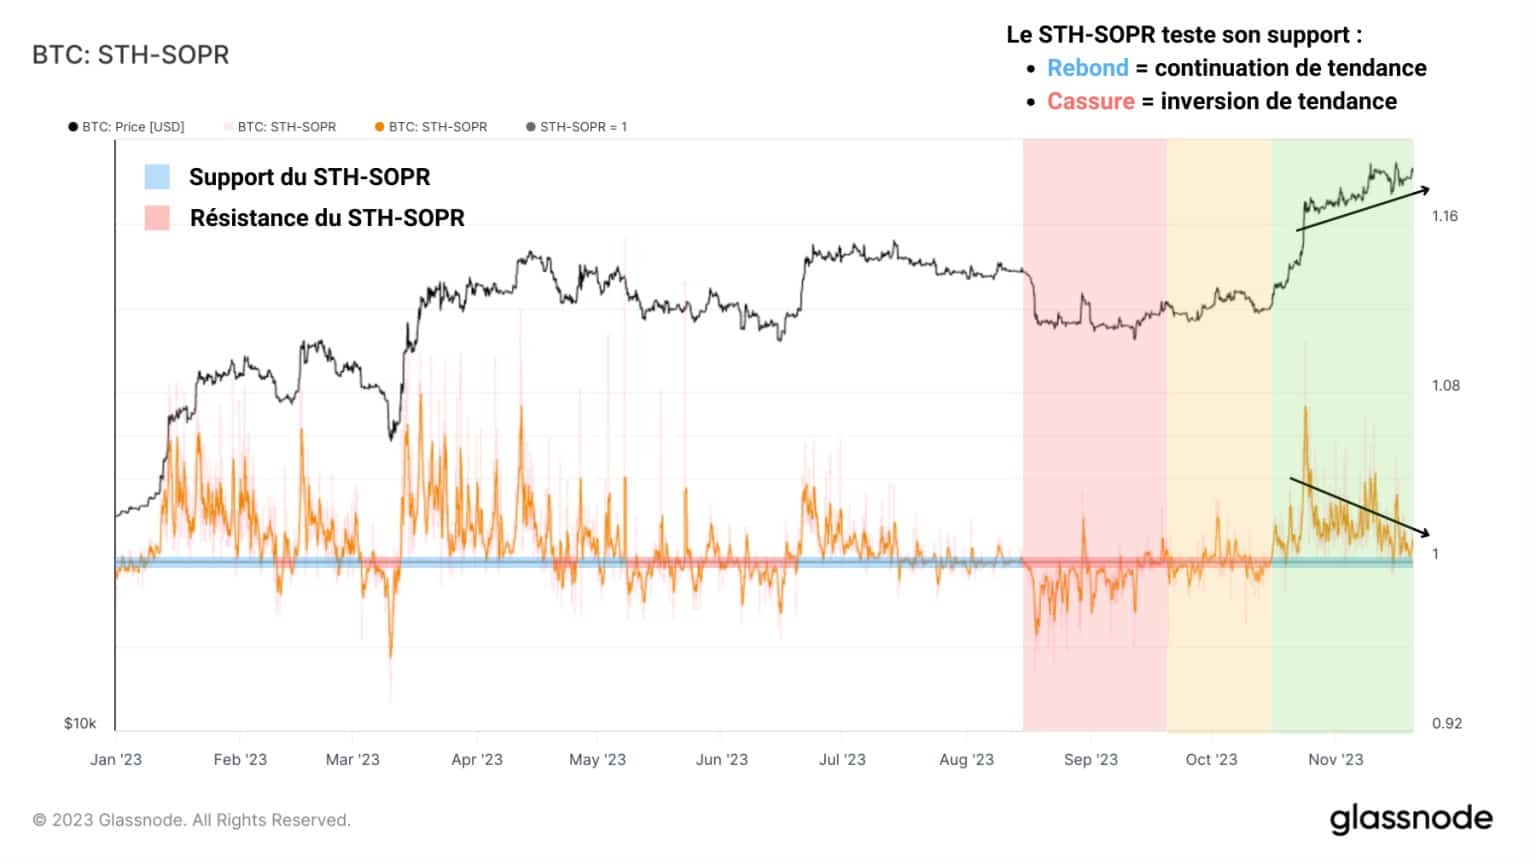
Figure 6: STH-SOPR
With STH-SOPR currently testing its support, we can determine that:
- An STH-SOPR rebound on the neutral zone will signal a continuation of the uptrend;
- A break of the neutral zone and its conversion into resistance will signal a trend reversal and a potential correction below $36,000.
Summary of this on-chain Bitcoin analysis
Finally, this week’s data indicates that the Bitcoin network is once again in high demand following the arrival of a new wave of Text/BRC-20 Inscriptions transactions.
While numerous Inscriptions transactions are flooding the mempool and congesting the network, the resulting pressure on the fee market is pushing up the average fee, much to the delight of Bitcoin miners.
Meanwhile, speculators’ profit-taking behavior is slowing as BTC’s rise loses momentum.
We are now close to a short-term bullish bias test point, which will determine whether the BTC price finally begins a long-awaited correction by the latest entrants.
