
HODLing behavior in Bitcoin dominates and the strength of the $18,000 support indicates that the formation of an end to the bear market is progressing. In addition, a long-term on-chain pattern signals that the final phase of the current bearish cycle has begun. On-chain analysis of the situation
Bitcoin (BTC) tests its floor for a 5th time
Following the successful bounce off the current bear market floor ($18,000) in mid-September, the price of BTC has tested this critical level again.
Still operating within the range established since June 2022 ($18,000 to $24,000), the Bitcoin market appears to be stagnating above five-time proven support.
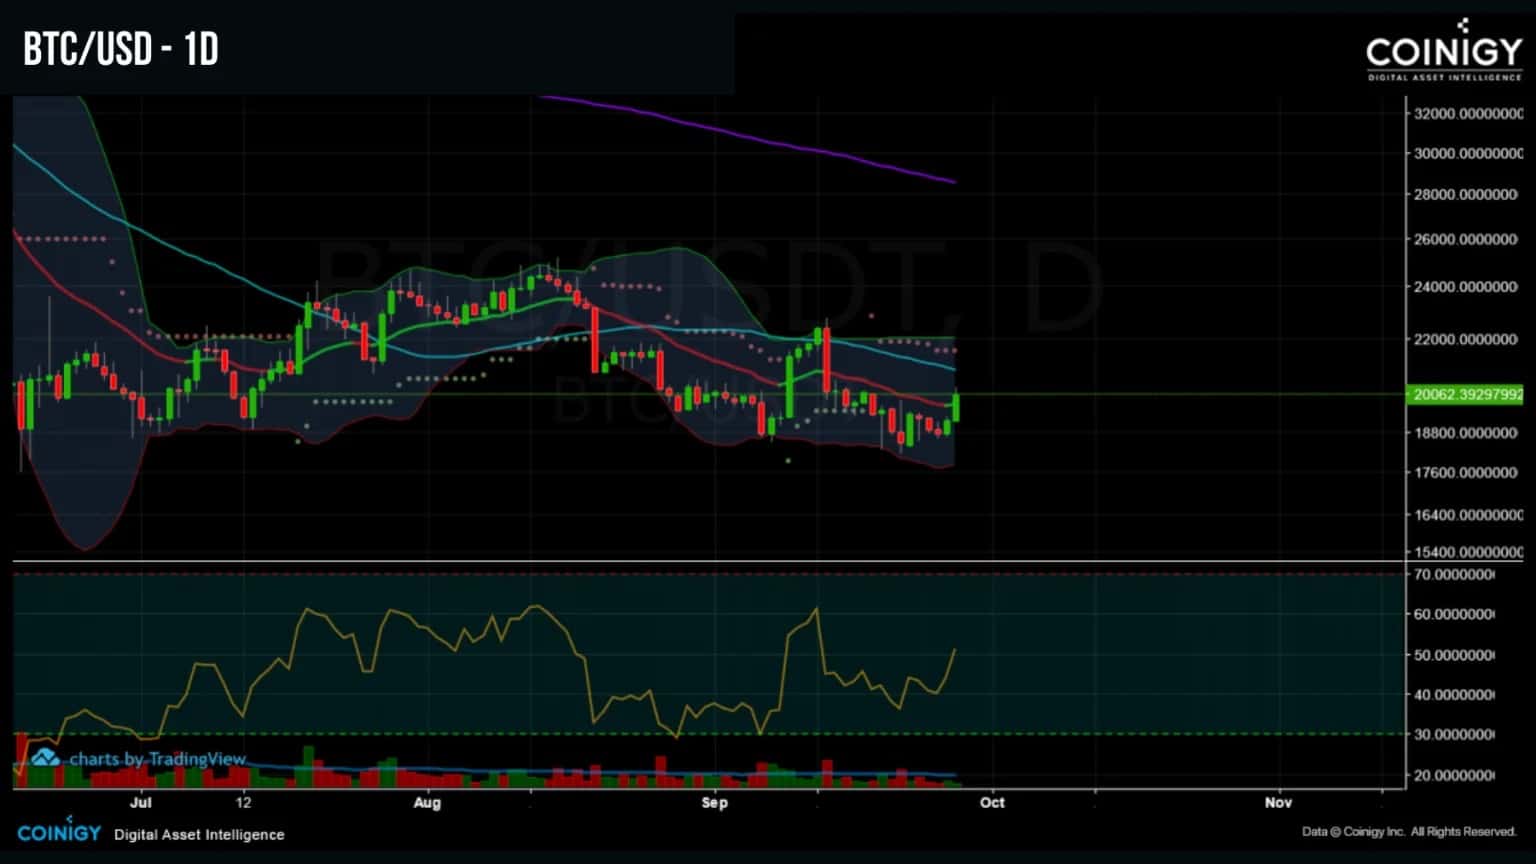
Figure 1: Daily BTC price
However, there is a lot of on-chain data that points to a change in market structure taking place as the weeks go by.
This week, we will assess:
- the dominance of HOLDing and accumulation
- the bear market end signal formed by the bear ☻ bull transition model
HODLing behaviour dominates
Shared five times in the past three months, the $18,000 price level still provides robust support for bearish BTC price movements today.
At the time of writing, the range concentrates nearly 3.47 million BTC between its two bounds, or 18.7% of the outstanding supply. This means that nearly 19% of bitcoins are circulating in this price range.
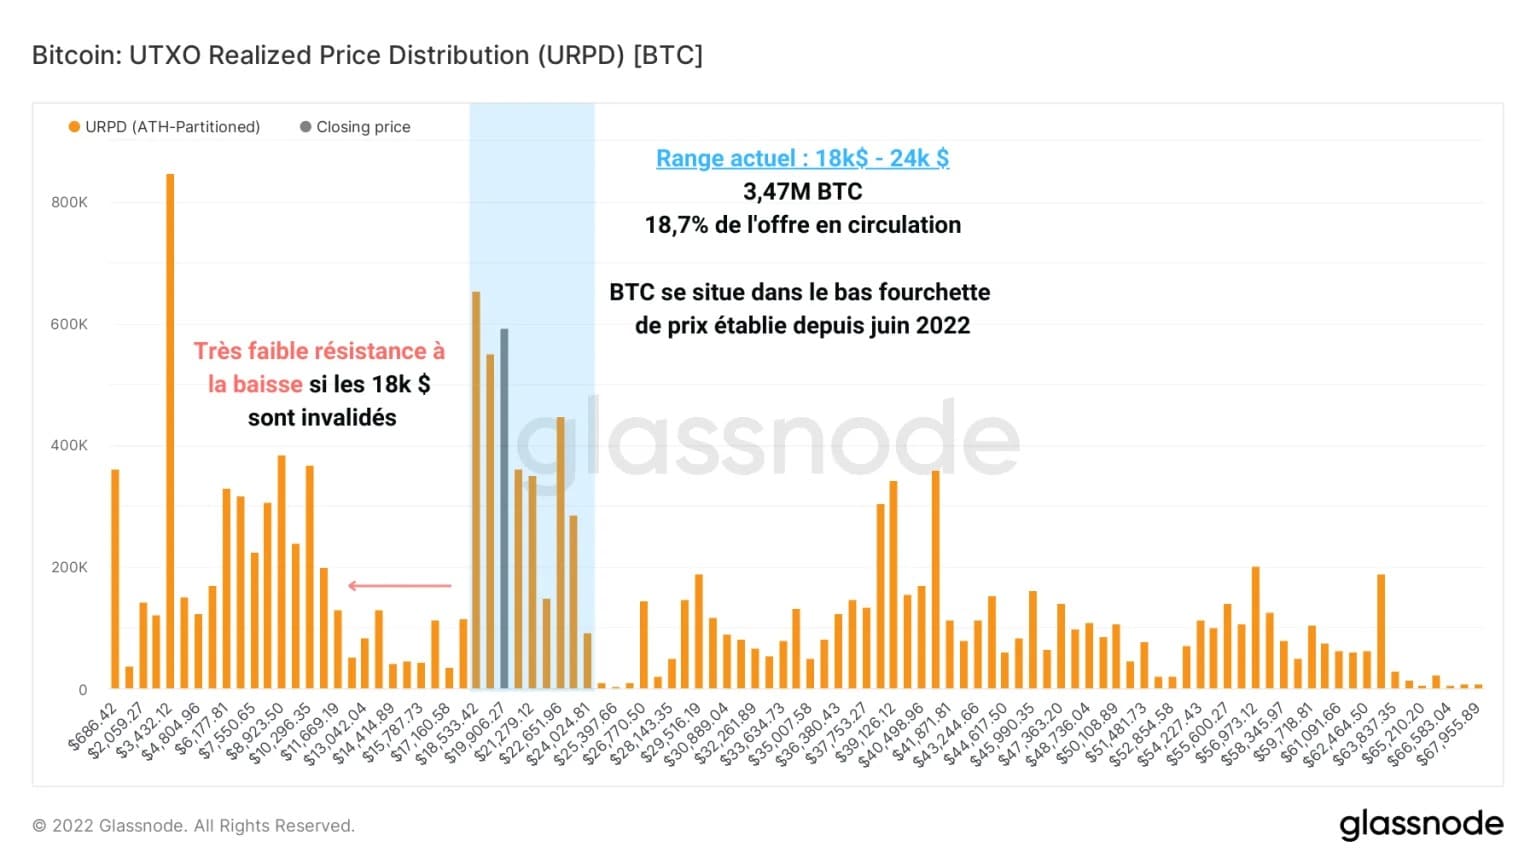
Figure 2: UTXO Realised Price Distribution
Over the past few weeks, the volume of bitcoins acquired in this demand area has gradually moved from the $20,000s to the $18,000s, indicating a slight redistribution of coins near the bottom of the bear market.
Note that, should this support be breached from below, there would be almost no resistance to a potential price decline towards the $13,000 level. But nothing is decided yet.
The study of the Days of Coins Destroyed allows us to confirm an observation made during the last analyses: HODLing (conservation) behaviour clearly dominates the investor cohorts. They are holding on to their acquired BTC for the time being.
While destruction spikes (rejuvenation of UTXO by transferring bitcoins from one address to another) could be observed during the high bearish volatility events of May and June 2022, the overall trend of this metric is clearly downward.
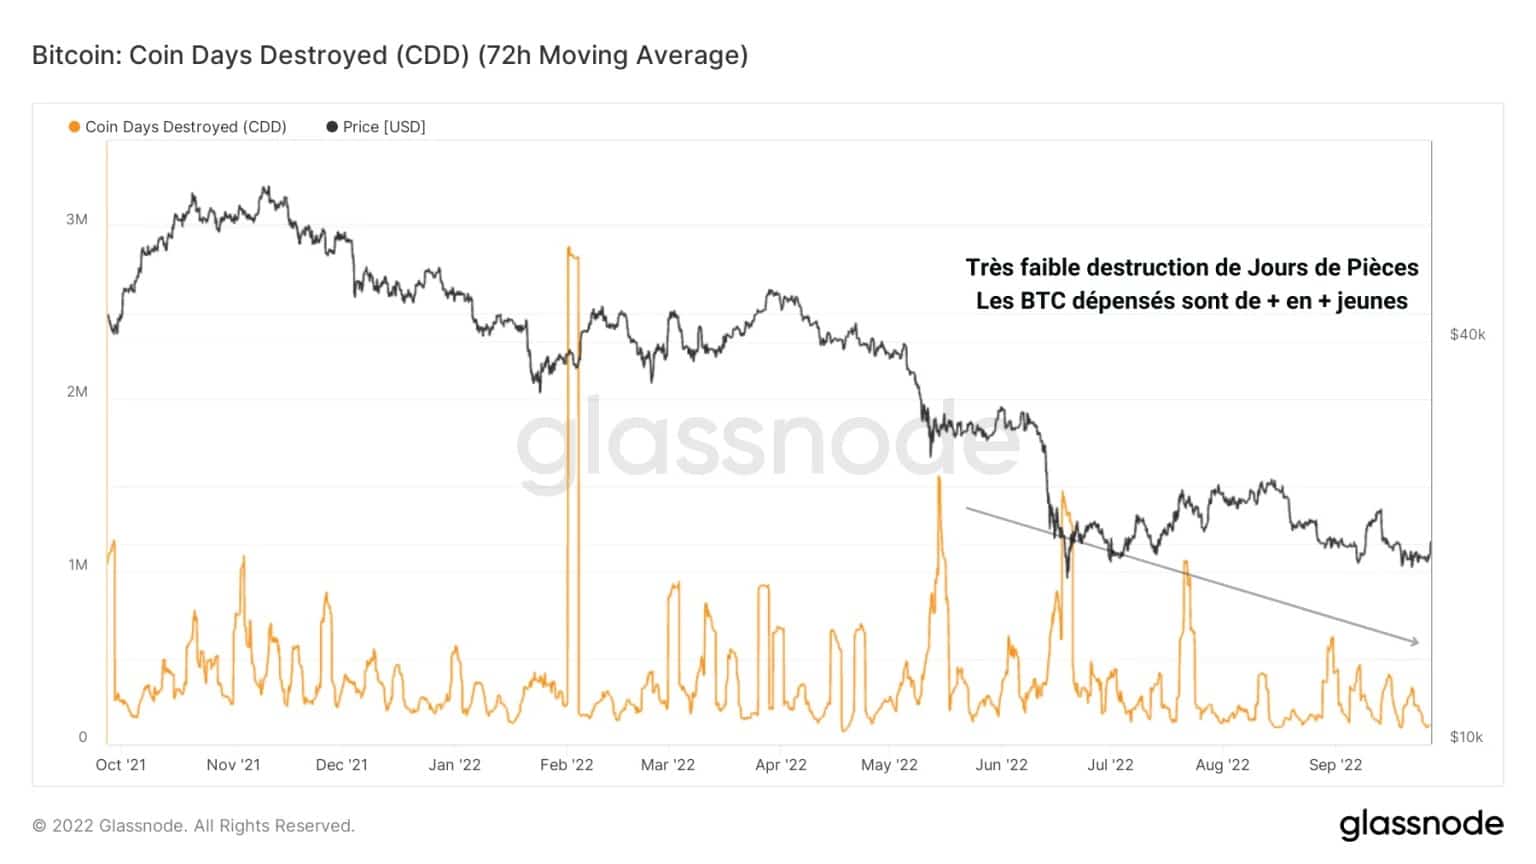
Figure 3: Days of Coins Destroyed
This indicates that the BTC spent in recent months is particularly young. It can thus be defined that the recent sales actually represent only a moderate volume of bitcoins that are passing from hand to hand rather quickly, without finding a holder willing to keep them for the long term.
This is a constructive observation and demonstrates that the majority of participants prefer to hold their coins and mature them rather than spend them at such low price levels.
Corroborating this analysis, the Liveliness metric, which compares the number of Coin Days (CDs) destroyed to the total number of Coin Days created, carries a similar signal.
By showing a sharp fall since August, it indicates that the number of JP created is far greater than the number of JP destroyed.
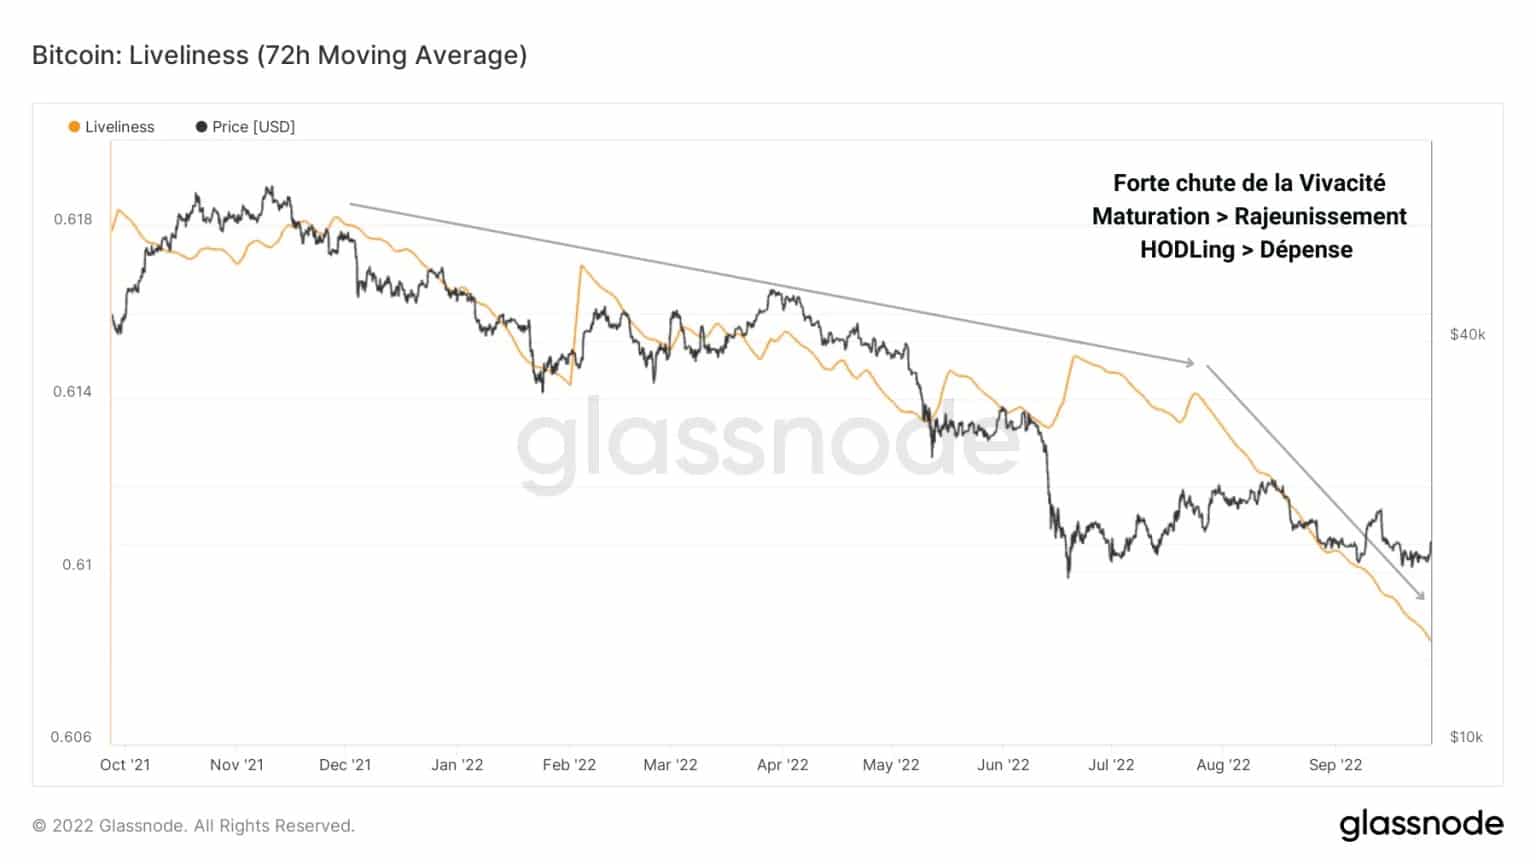
Figure 4: Liveliness
This means that maturation takes precedence over rejuvenation and that conservation behaviour takes precedence over spending behaviour.
In other words, the majority of investors today prefer to accumulate BTC over the long term and store it rather than spend it (e.g. sell it), which is a very constructive observation for the future.
The cyclicality of Bear ☻ Bull transitions
Looking at the long term history of the Accumulation Trend Score, we can notice that a pattern repeats itself when bear market bottom formation phases form.
Whether in 2015, 2018, or currently, a three-stage dynamic seems to reflect the psychological behaviour of investors in response to the sharp decline in the BTC price:
- Opportunism: Strong accumulation during price capitulation. Investors jump at the opportunity to buy BTC at relatively low prices.
- Cautious: Some new entrants leave the market at the first increases, selling close to their cost base. They anticipate a potential further fall.
- Confidence: Once the bottom of the down cycle has been reached and selling pressure has been exhausted, the more reckless participants re-accumulate BTC before a new long-term up cycle is triggered.
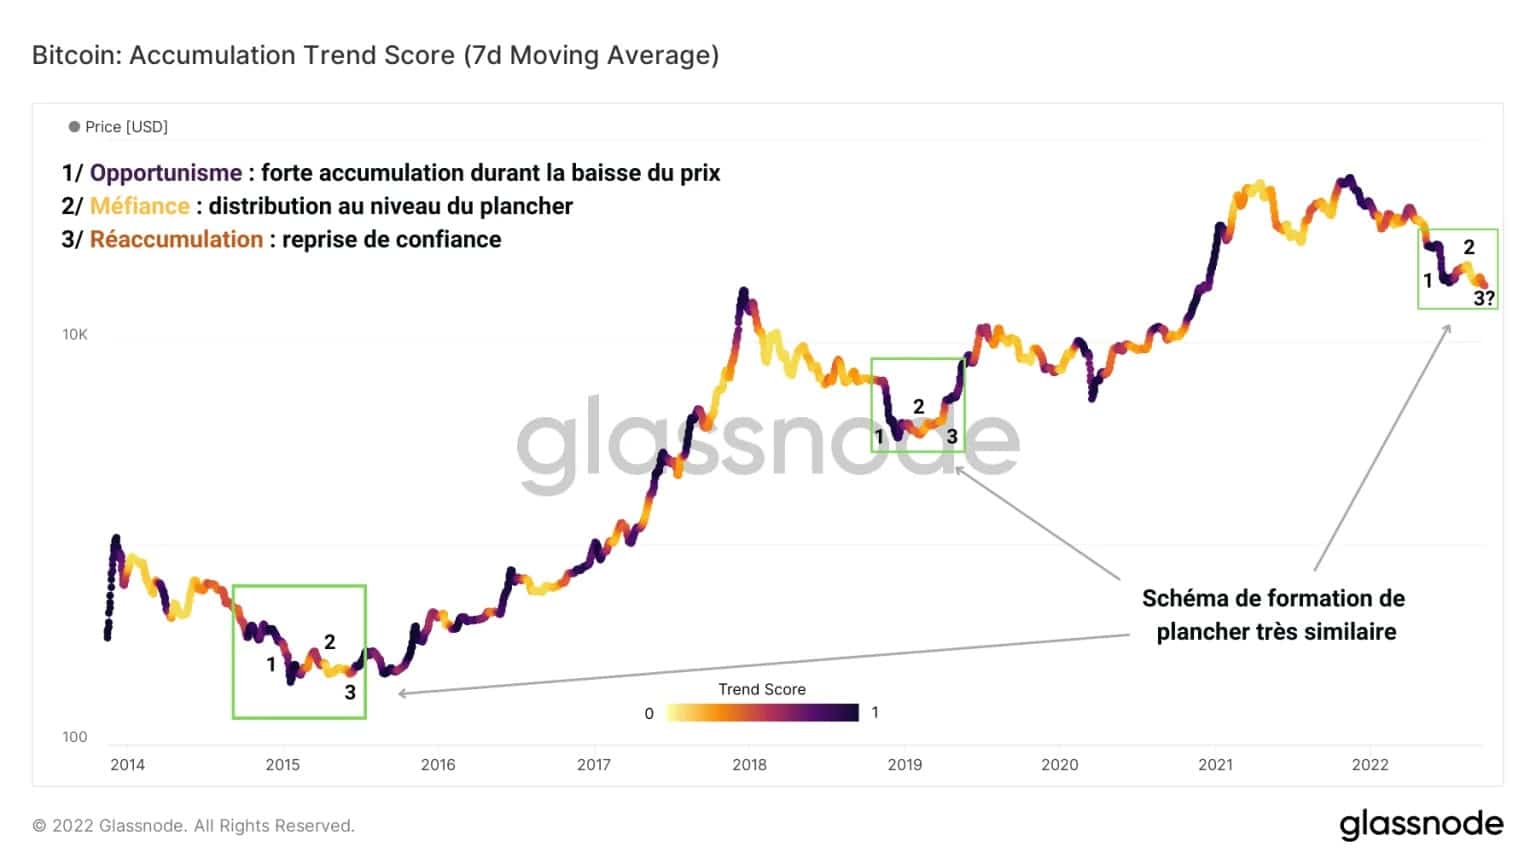
Figure 4: Accumulation Trend Score
In addition, LTH (entities holding BTC for more than 155 days) expenses have reached a very low profitability ratio, similar to the most painful periods of previous bear markets.
Facing severe financial stress, some LTHs are now selling their coins with a profitability ratio of 0.6, equivalent to a loss realisation of -40%.
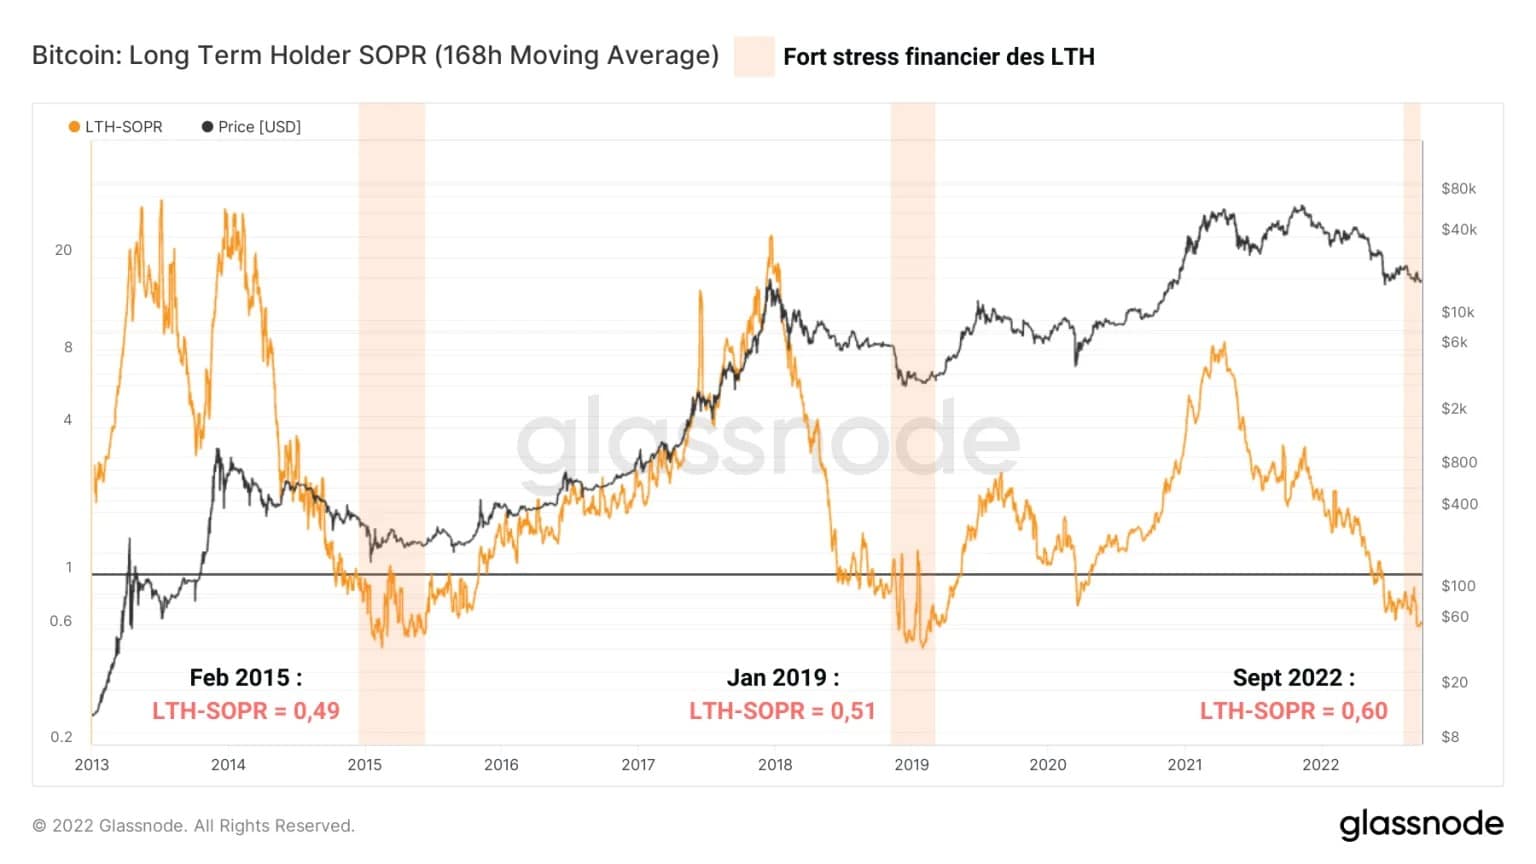
Figure 5: LTH Expense Profitability Ratio
Values like this have only been recorded on very rare occasions in the history of the bitcoin market and indicate that we are currently close to an important inflection point in the prevailing downtrend.
That said, the price is unlikely to move up in a straight line over the course of the week. The transition to a bull market will take several months or even years to build before it is confirmed by a return to profitability for all investor cohorts.
Moreover, the on-chain bear ☻ bull transition model presented in our last analysis has finally provided the long awaited signal.
Thus, on Friday, September 23, 2022, the realized price of STH crossed the realized price of LTH to the downside, signaling a notable short-term accumulation of coins, whose cost basis is now lower than that of the coins accumulated 155 days earlier.
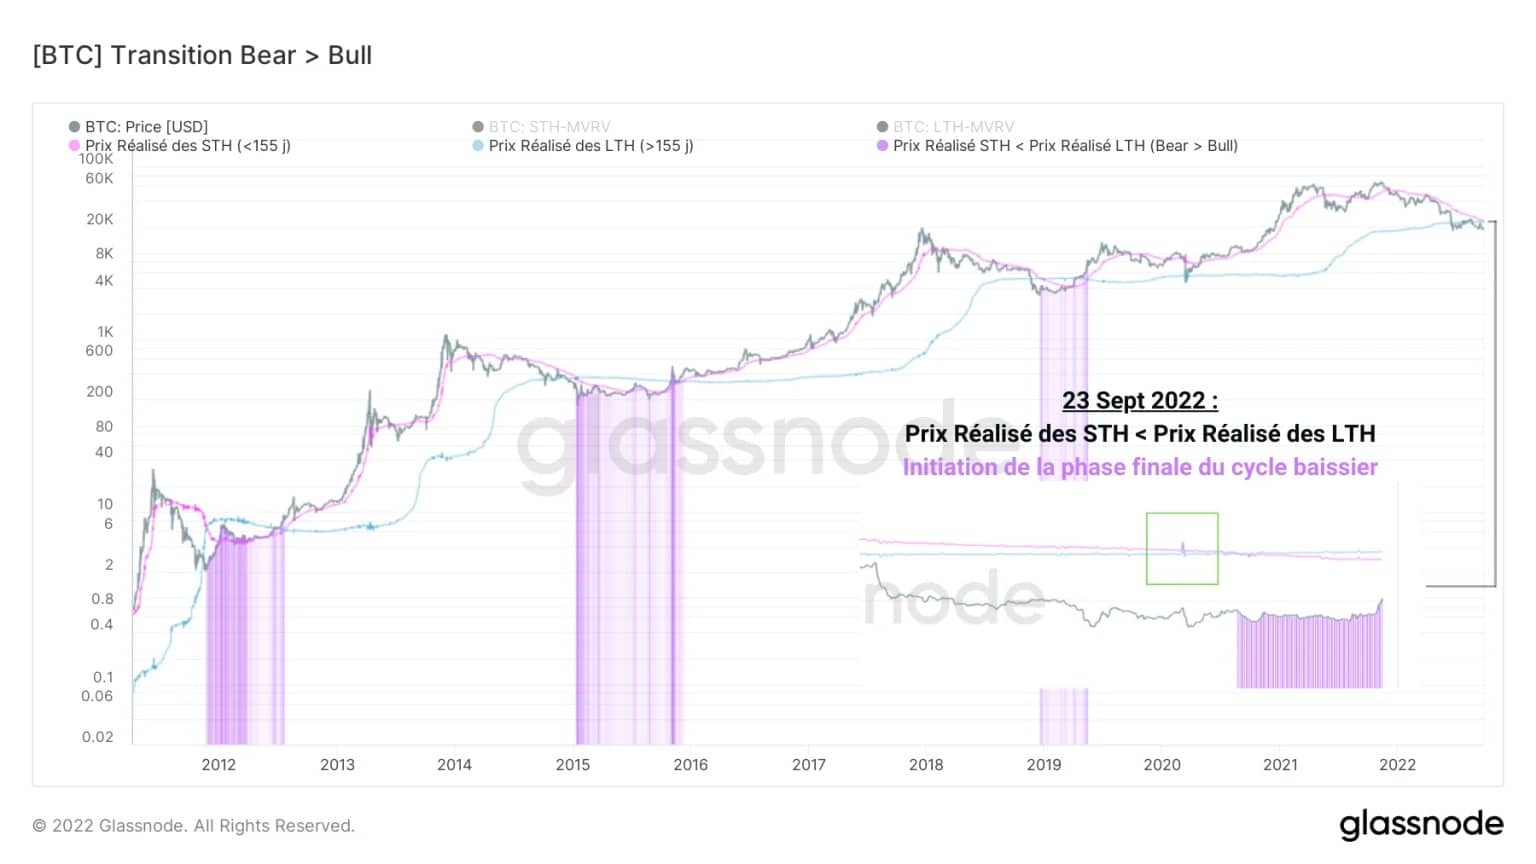
Figure 6: Bear Transition Model ☻ Bull
This signals the initiation of the final phase of the current bear cycle, where the two boundaries of the current consolidation zone ($18,000 – $24,000) are likely to be tested repeatedly.
These tests will allow the most convinced investors to accumulate and mature a substantial volume of BTC which will then be redistributed at a profit in the strength of the upcoming bull market.
Summary of this onchain analysis
Overall, this week’s data indicates that the $18,000 area is likely to serve as a floor for the current bear cycle and that the breakout above $24,000 will signal the start of the bull market ahead.
As HODLing behaviour dominates, participants prefer to accumulate BTC and wait patiently for the end of winter (bearmarket) rather than give in to selling pressure at such low price levels.
From a long-term perspective, the LTH-SOPR and the Bear ☻ Bull transition model indicate that the final phase of the bearish cycle has begun. That said, it will probably take several more months before the return to profitability of all cohorts confirms the advent of the next bull market.
However, Bitcoin (BTC) remains subject to global macroeconomic trends. This on-chain context, while informing us of fundamental structural changes in the market, will need to be accompanied by sound macroeconomic data to allow BTC to take off again.