 – The beginnings of a reversal?")
A clear improvement in Bitcoin (BTC) fundamentals signals that a large cohort of holders has pulled their heads out of the water, supporting a short-term bullish bias. All things considered, the cryptocurrency market is beginning to show encouraging signs of strength. On-chain analysis of the situation
Bitcoin attempts a bullish push
To the delight of investors, the price of Bitcoin (BTC) has been pushing back against bullish barriers for the past week. Rising from $17,500 to $21,700 in the past seven days, BTC has already broken through several key on-chain resistance levels.
With a year-to-date appreciation of nearly 23%, the BTC market appears poised to turn the tide and resume long-term upward momentum.
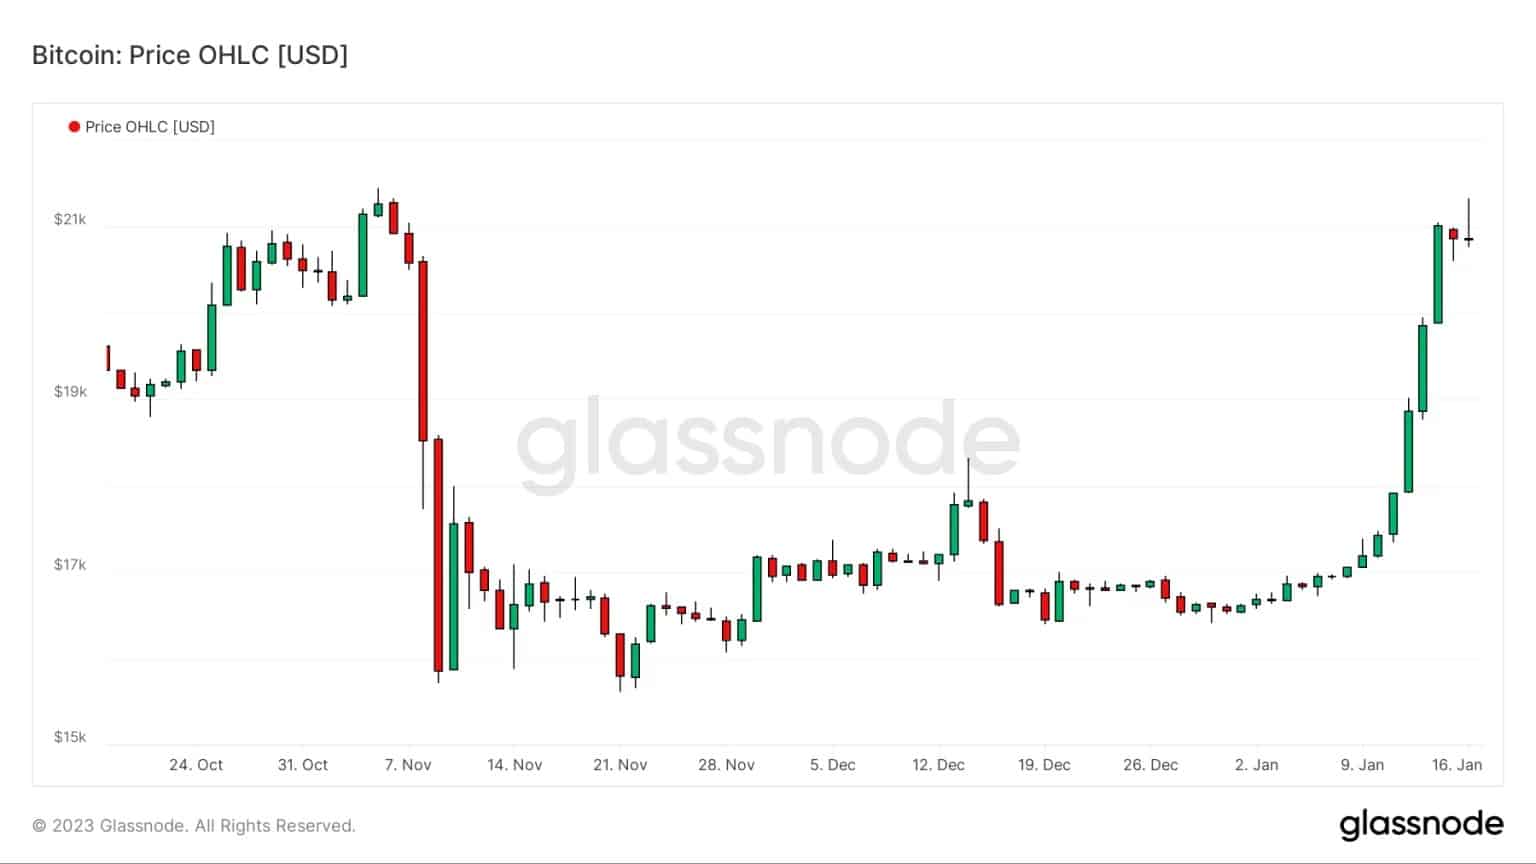
Figure 1: BTC daily price
In order to closely observe this transition from the end of the bear market to the beginning of the upcoming bull market cycle, we will be observing this week and next a variety of metrics regarding the behavior of the main market leading asset.
Fundamentals are bullish
The recent rise in prices has allowed several fundamental indicators to turn green, signalling an on-chain environment favourable for a medium to long-term uptrend.
For the first time since December 2021, the spot price of BTC has exceeded the global realised price (orange), but also the realised price of short-term holders (red).
A breach that we had been waiting for patiently during the analysis of the last quarter of 2022, it signals a return to profitability for the majority of the entities making up the market.
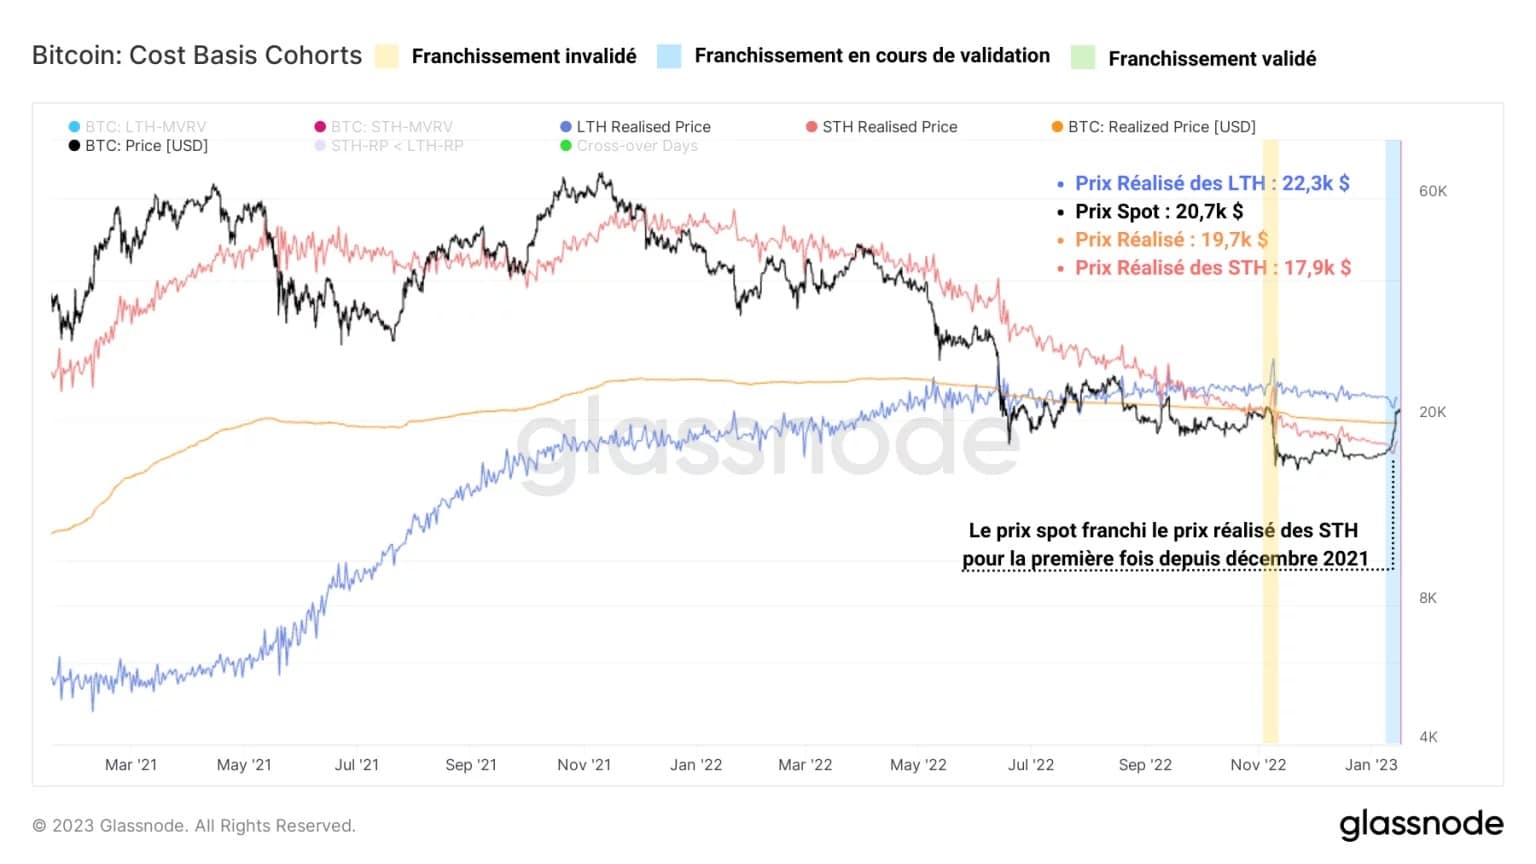
Figure 2: BTC holder cost base (average, STH, LTH)
Breaking out of the water and from a state of latent loss causing implied selling pressure from BTC holders, the breakout from the top of two of the three major on-chain cost bases marks another victory for the bulls over the sellers.
The next and final step is the crossing of the long-term holders’ realised price (in blue), located at the USD 22,100 level. Once this final barrier is breached, the major obstacles to BTC’s rise will have been removed.
In order to gauge the underlying trend that dictates the direction of BTC, the study of the delta gradient (in blue) provides us with valuable information about the momentum of its price.
This oscillator models the strength/depletion of participants over the course of the market and is based on the relationship between the spot price and the realised price. To better understand this indicator, I invite you to read this Twitter thread on the realized market gradient
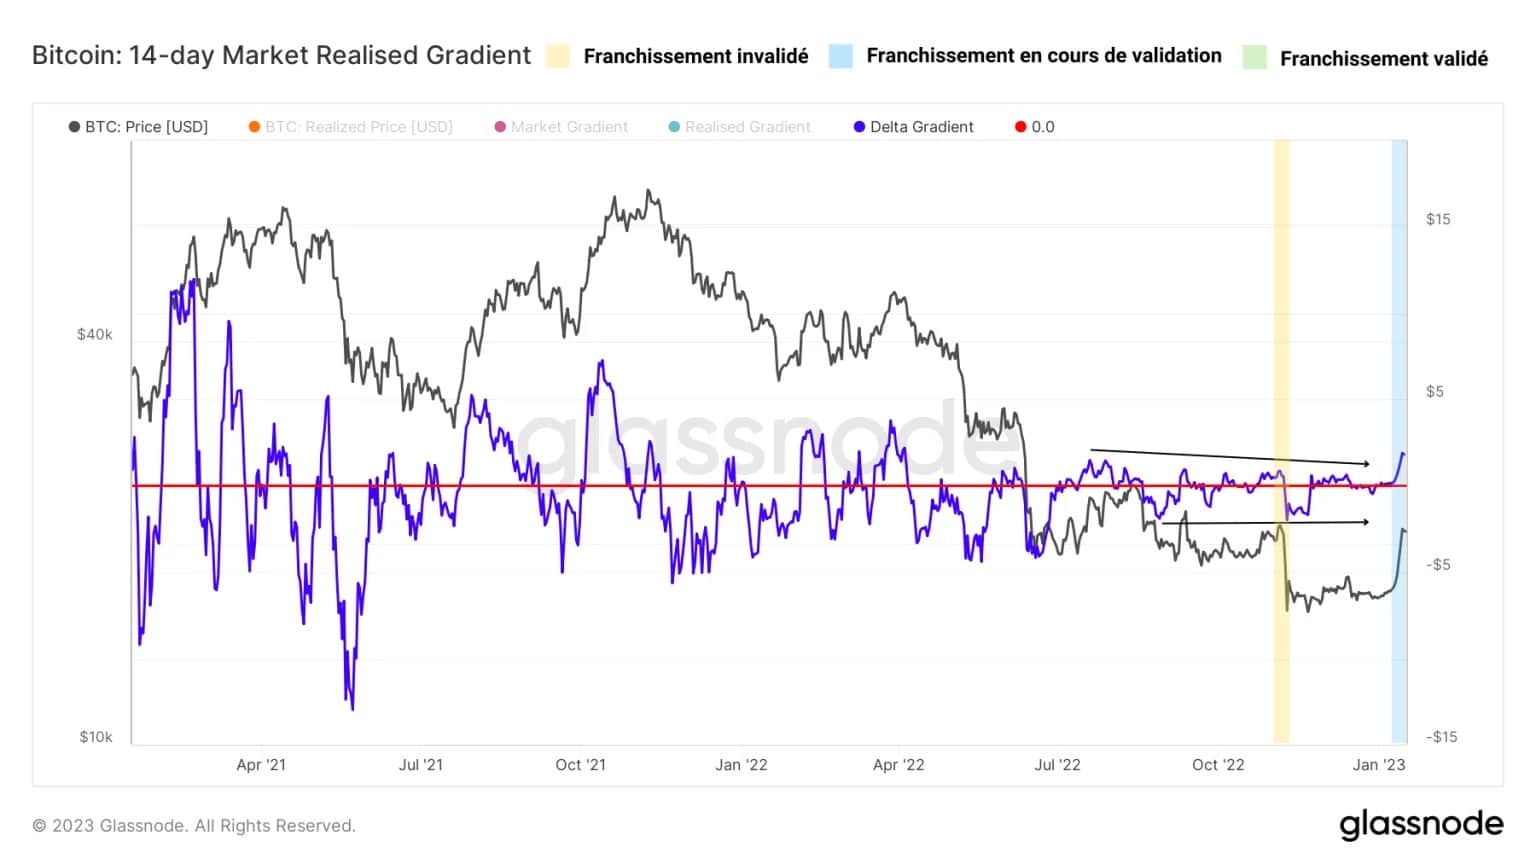
Figure 3: 14 day delta gradient
What stands out from the observation of this indicator in its short term version (14 days) is the clear support of the delta gradient on the neutral zone (in red), which has allowed an exemplary rise towards new positive values.
In sum: in the short term, organic inflows indicate that the directional bias of the market is turning upwards after a period of stagnation of almost 6 months.
A very similar observation can be made for the medium-term (28-day) variant of this oscillator. Indeed, over the last few months, it seems that the bullish and bearish amplitudes of the market have gradually lost their intensity, which has led to the low volatility context that has occurred since October 2021.
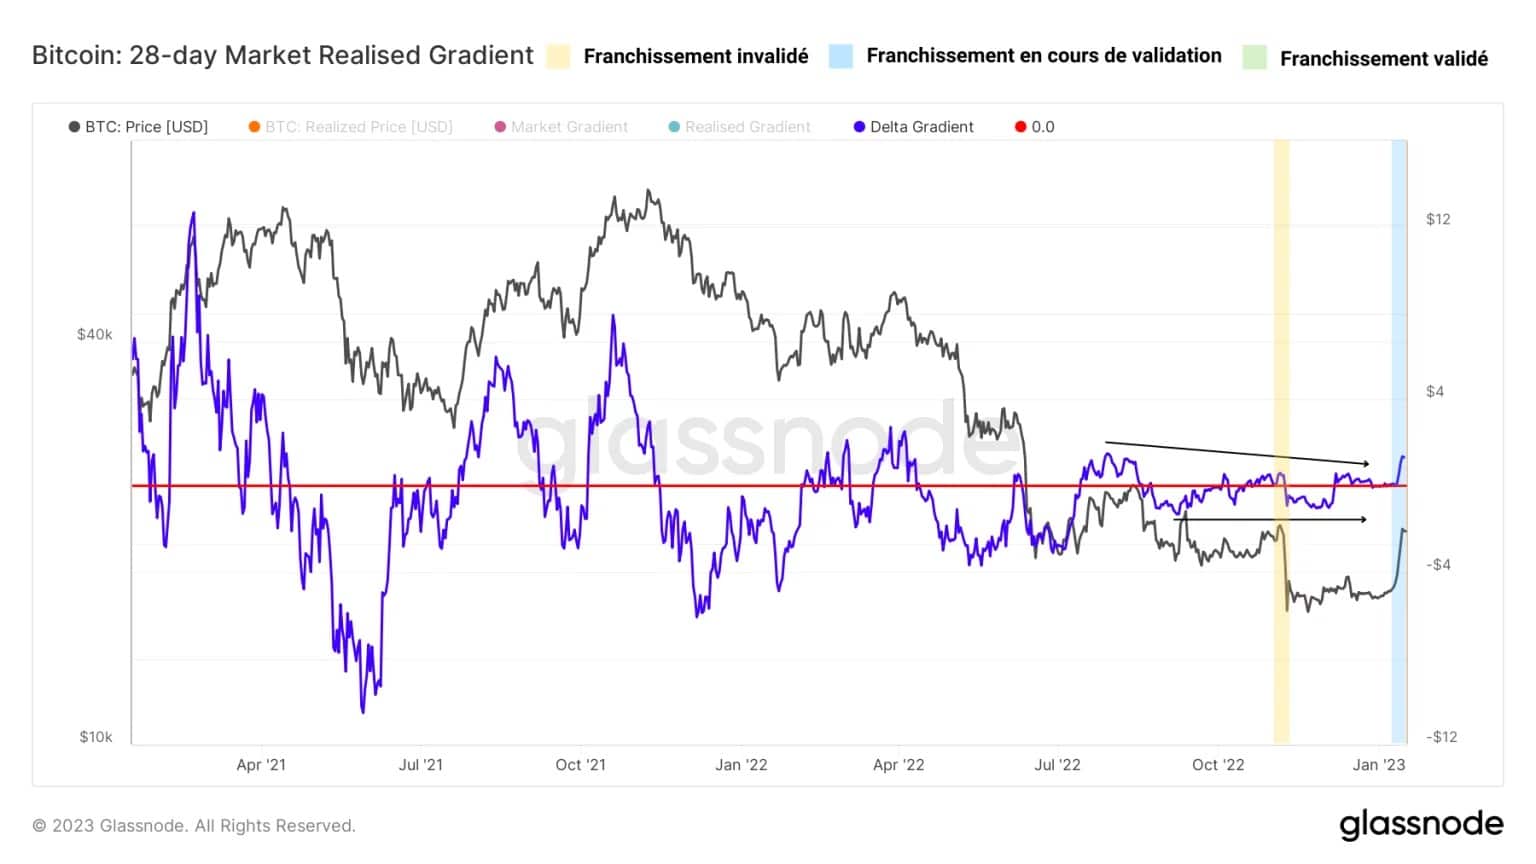
Figure 4: 28-day delta gradient
However, since last week, the bullish amplitudes seem to gain strength after establishing a stable support position at the neutral zone (realized gradient = 0, zero momentum).
Now that the underlying momentum seems to be moving upwards, a retest and then a final rebound on the neutral zone would allow to act with certainty the price recovery that many are waiting for. It would also confirm that the fundamentals are clearly improving.
Finally, from a long term perspective (140 day time frame), we can clearly see a progressive weakening of the market’s bearish amplitudes (black arrow) which augurs the transition from a bearish to a bullish cycle.
Following the failed attempt in October, which was aborted by the debacle around the FTX collapse, the long term delta gradient is again crossing the neutral zone, without having yet performed a bullish retest.
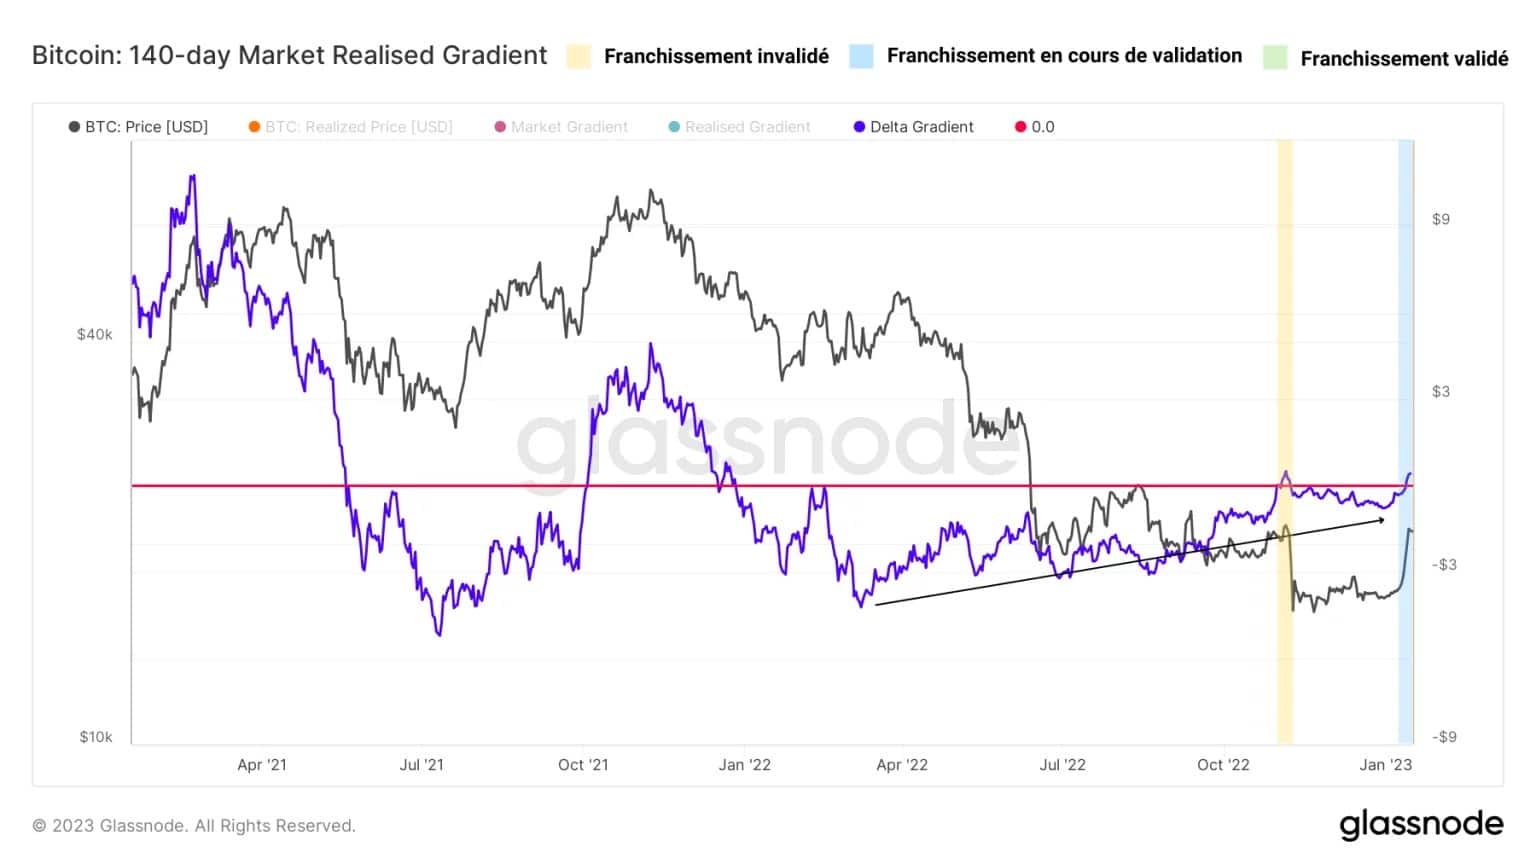
Figure 5: 140-day delta gradient
The common bullish momentum of the delta gradient on three distinct time scales clearly shows that a momentum reversal is at work. Seller exhaustion is beginning to be offset by new capital inflow, attracted by a generational investment opportunity.
Although the full reversal of fundamentals is not yet in place and requires a few more weeks to be validated, the current momentum is very encouraging.
Corroborating previous observations, the aggregate (aSOPR) and short-term (STH-SOPR) expense ratios have begun to rise significantly, to values of 1.011 and 1.027 respectively.
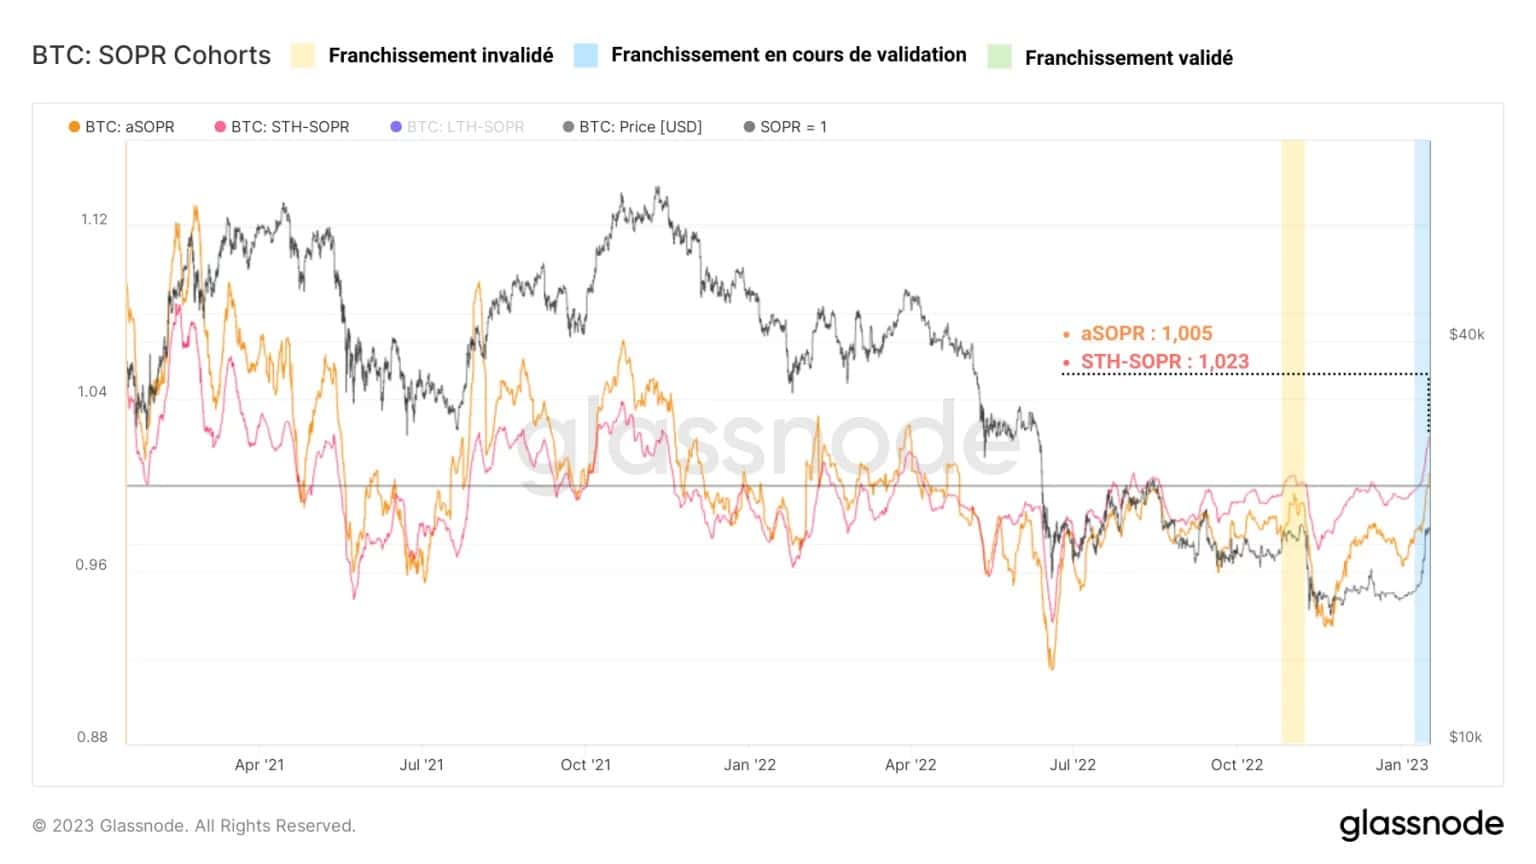
Figure 6: Cost-effectiveness ratio (average, STH)
Here again, a trend reversal in the indicator seems to be taking place, indicating a return to profitability for both the short term holder and the average investor. This dynamic is very similar to those of April 2019 and September 2021, as profitability is returning as quickly as it is broadly based.
With a large number of holders now able to make substantial gains, the current bear cycle appears to be in a gradual twilight that only Bitcoin haters and shorts will regret.
Summary of this on-chain analysis of BTC
In sum, this week’s data tells us that BTC’s fundamentals have improved significantly following the recent price hike.
The market’s latent and realised returns signal that a large cohort of holders have broken out of the red, supporting a short-term bullish bias.
The study of short, medium and long term momentums indicates that a structural trend reversal is materialising as the depletion of sellers is compounded by the arrival of new buyers.
All things considered, the cryptocurrency market is beginning to show encouraging signs of strength. However, these signals will need to be confirmed and a close eye kept on the macroeconomic and financial context to ensure the potential upside is sustainable.