 – Redistribution of capital in bear markets")
Bear markets promote an environment of financial and psychological uncertainty and distress, and it is common to see large realisations of losses. This dynamic can be seen in the current market as it causes a redistribution of bitcoin supply from less experienced participants to high conviction investors. On-chain analysis of the situation
Another failed attempt at a rise in Bitcoin
Following another bearish candle, the price of Bitcoin (BTC) is back in the range established since the first weeks of May.
As the price struggles to choose a clear direction, impatient participants are ceding and selling their coins – mostly held at a loss – to opportunistic buyers, many of whom are more insensitive to market fluctuations
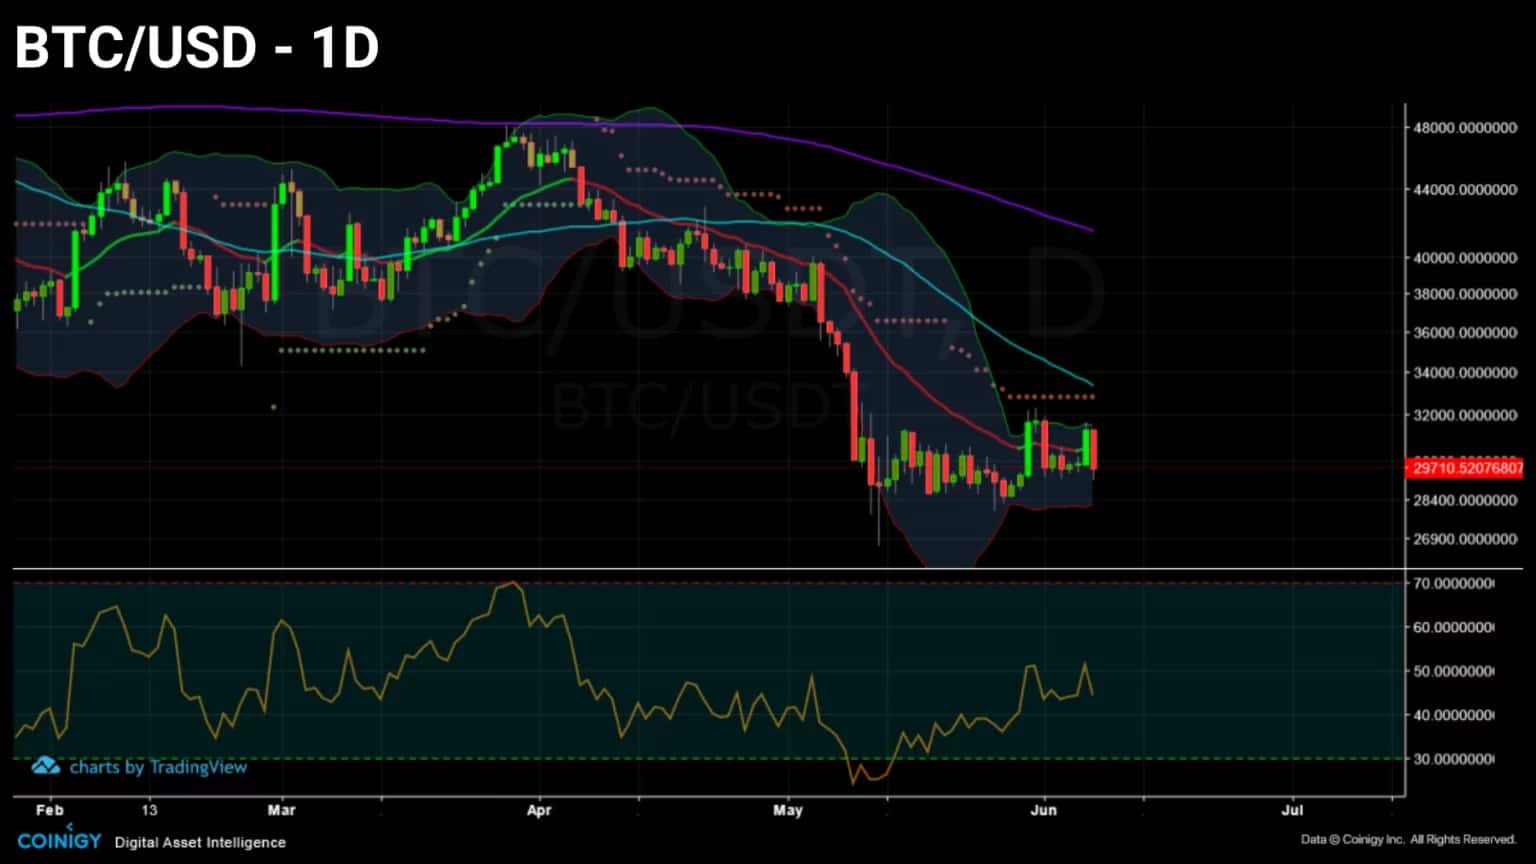
Figure 1: Daily Bitcoin (BTC) price
After studying the rotation of capital from ETH to BTC in our last analysis, this week we will look at the redistribution of bitcoin supply taking place repeatedly during bear markets.
The different stages of supply distribution in losses
Let’s begin this analysis by looking at the five-year interaction of the market price with the different levels of on-chain support, represented by the cost bases of several cohorts.
The graph below shows two curves:
- the short term investor cost basis or STH (pink), which serves as support/resistance to short term market trends, currently worth $37,853.
- the Price Realised by Liveliness ratio, described by Dor Shahar as the HOLDers’ cost base, acting as medium-term support/resistance and currently worth $36,255.
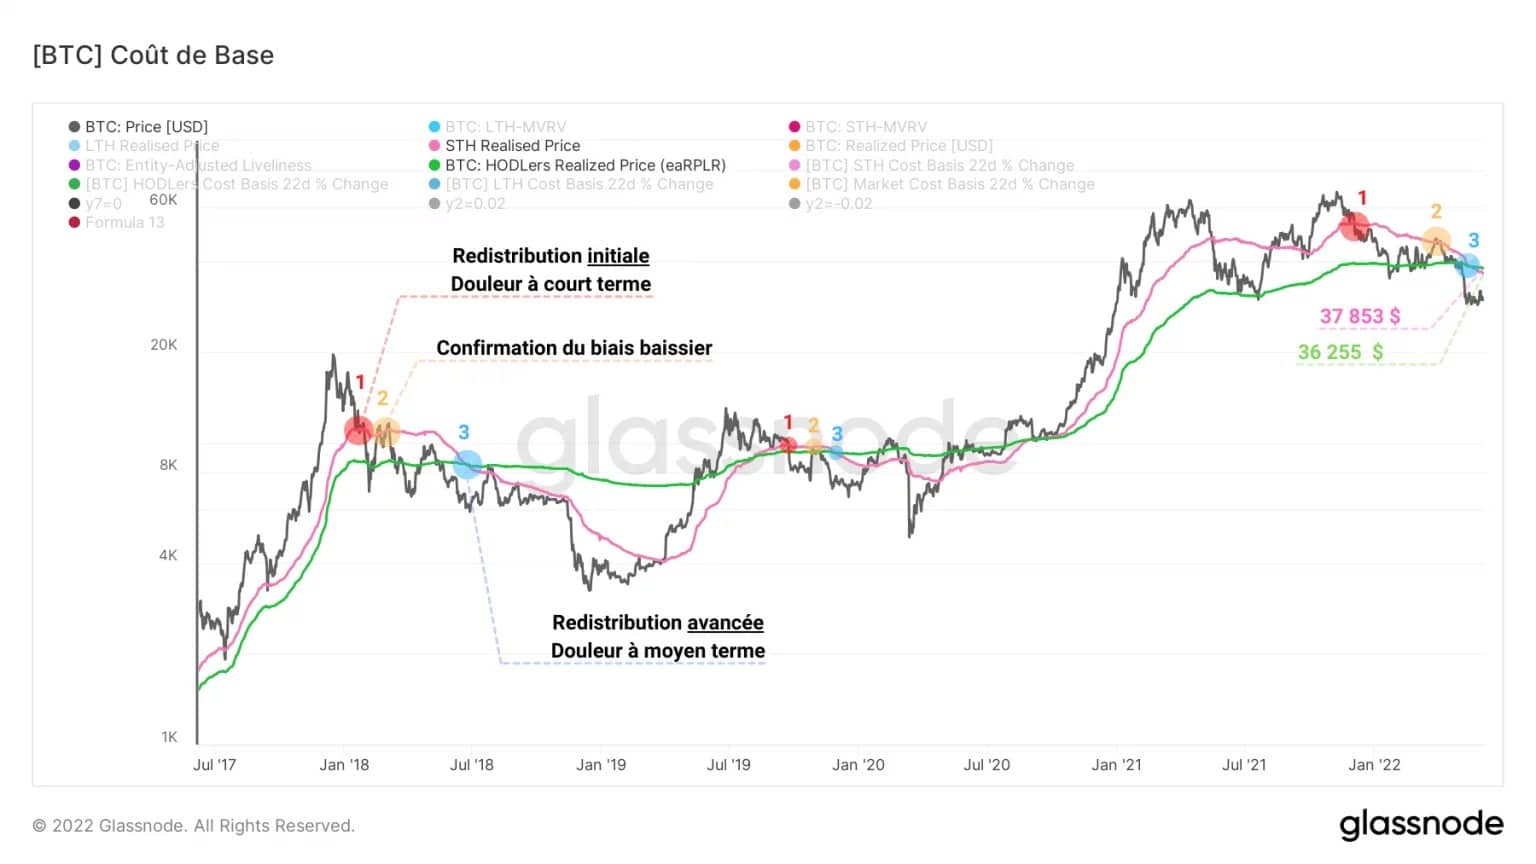
Figure 2: Realised Price of STH and Realised Price Ratio by Vivacity
During bear markets, we can identify a recurrent behaviour of these two indicators, divided in three stages:
- The market price dips on the realised price of STH, starting the initial phase of redistribution of supply from less experienced participants to players with stronger conviction.
- Price tests and then stumbles on the realised price of STH, confirming the bearish bias of the market for the coming weeks.
- Once the market price falls below these two on-chain support levels, the realised price of STH falls below the realised price of HODLers, signalling the onset of an advanced redistribution phase.
This pattern, present during the 2018-2019 bear market, the late 2019 correction and confirmed within the current bear market, indicates that we are currently in the midst of a cyclical rotation phase of bitcoin supply.
A transfer of capital from weaker to stronger hands may take several weeks or even months to reach its final, lower developed stage.
The next state the market may reach is described above as a final redistribution phase.
To reach this stage, it will be necessary – as in the two major downturns of the last five years – for the market price to fall below its realised price (orange) and below the realised price of long-term investors (blue).
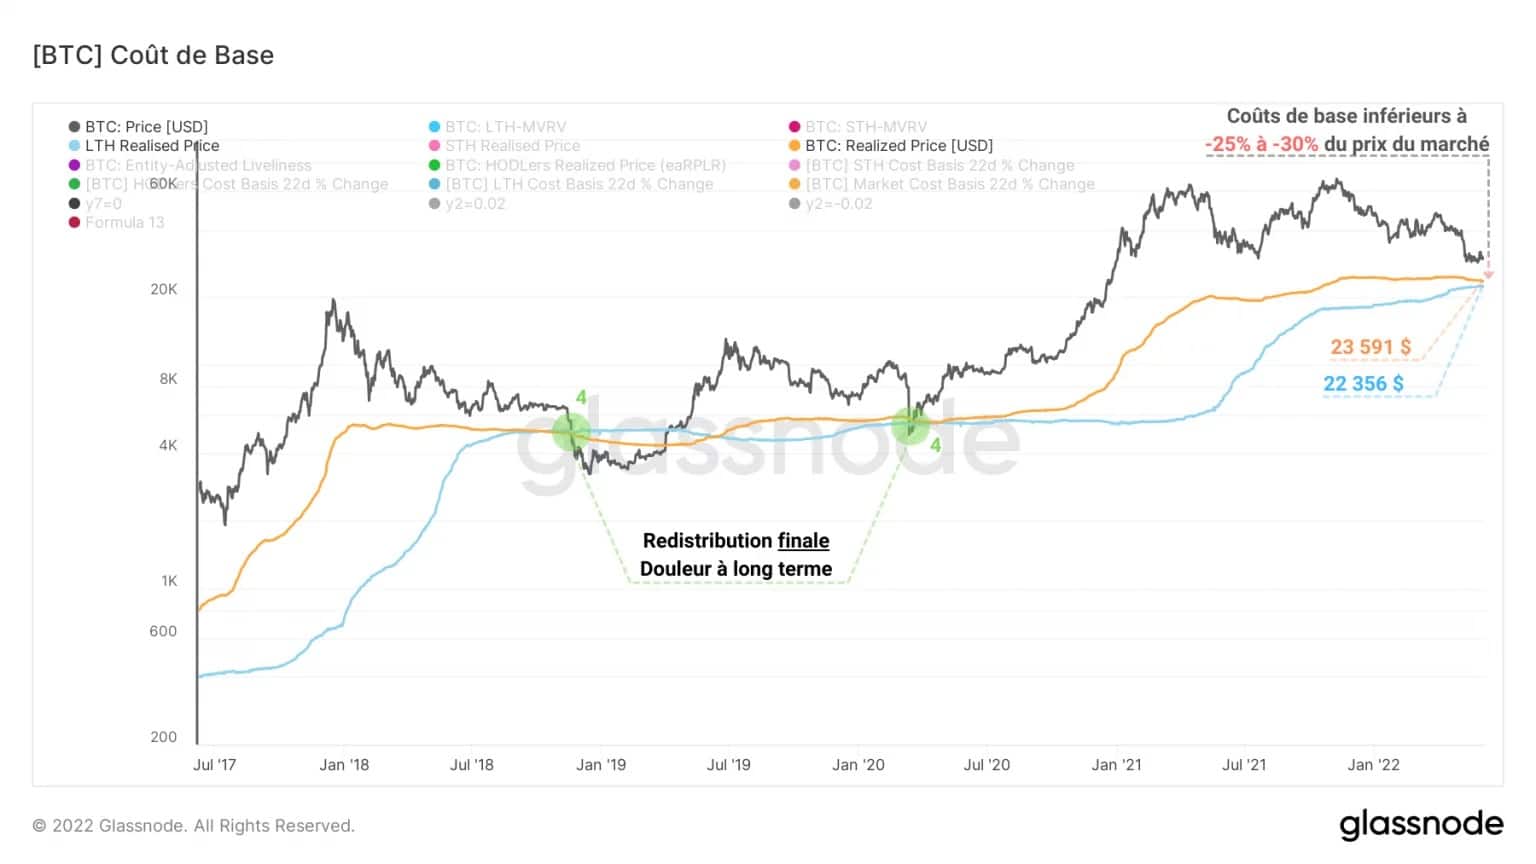
Figure 3: Realised market price and LTH realised price
At this point, a major part of the participants, including STHs as well as LTHs, would find their heads under water and the selling pressure would be strong enough to exhaust those entities lacking conviction.
Accompanied by large realised losses, a large redistribution of supply would take place, before the market price moved back above these two long-term on-chain supports.
A generational buying opportunity would then arise, near the bottom of the current bear market, followed by a new long-term bullish phase for the cryptocurrency market.
Strong re-accumulation at the $30,000 level
To conclude this study, let’s look at a somewhat sophisticated, but meaningful metric for assessing the change in ownership of the supply of Bitcoin in circulation.
The chart below plots the realised prices – by which we mean the last purchase price – of all existing Bitcoins, broken down by price bands and then separated by type of change and cohort.
In sum, this metric visualises the change in ownership of the supply held by STHs and LTHs over the last 30 days and identifies major capital transfers between weak and strong hands.
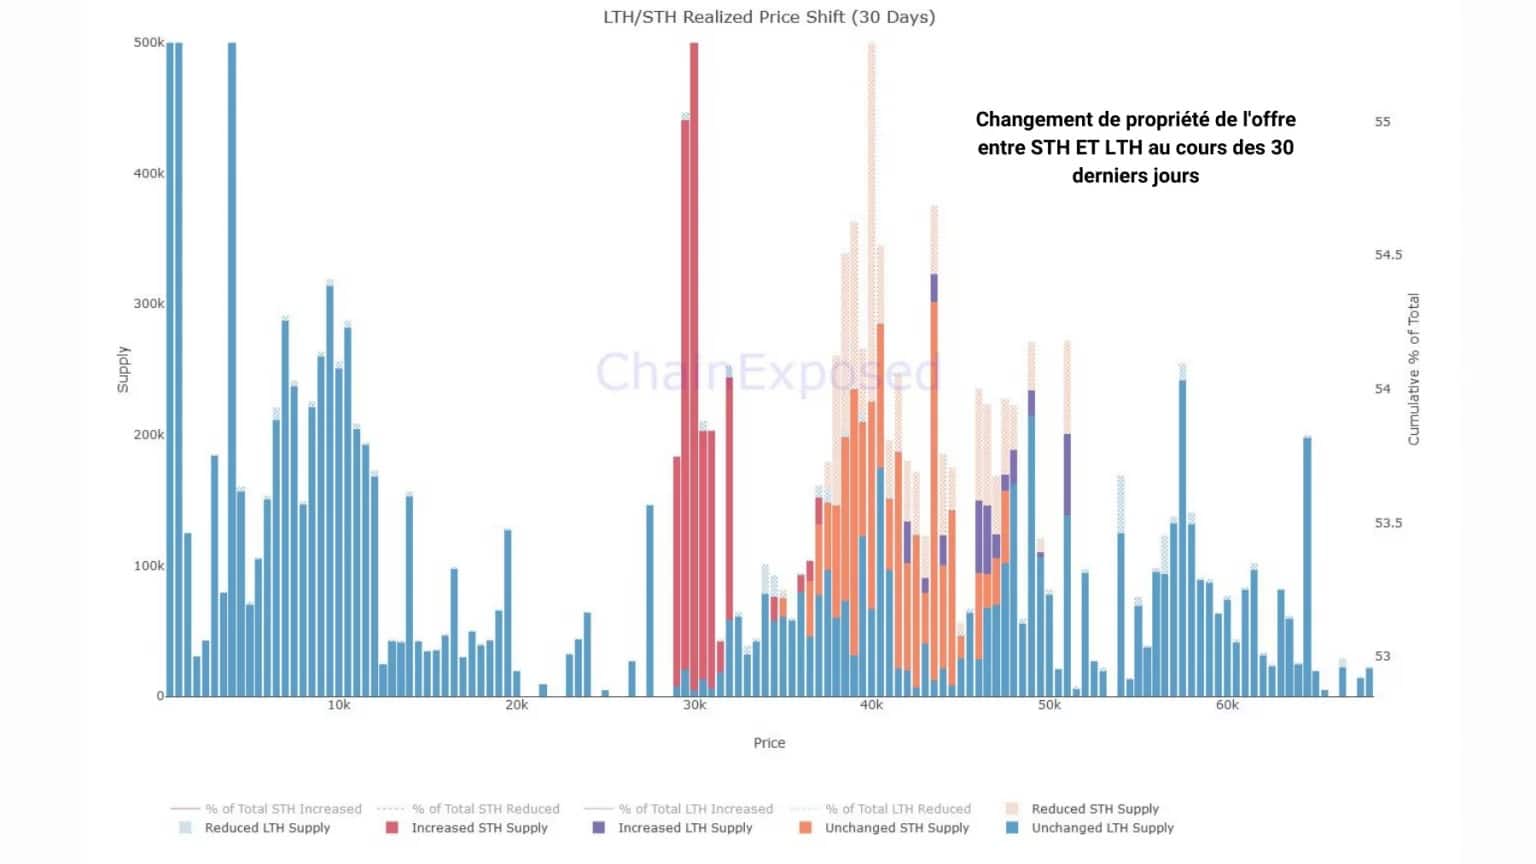
Figure 4: Supply distribution by cohort and 30-day change
Isolating the unchanged BTC supply, we notice in particular:
- three bitcoin piles held at a loss by LTHs between $32,000 and $64,000.
- one loss-making STH bitcoin pile between $37,000 and $48,000.
- a majority of BTC held at a profit by LTHs, with a purchase price ranging from $500 to $2,000
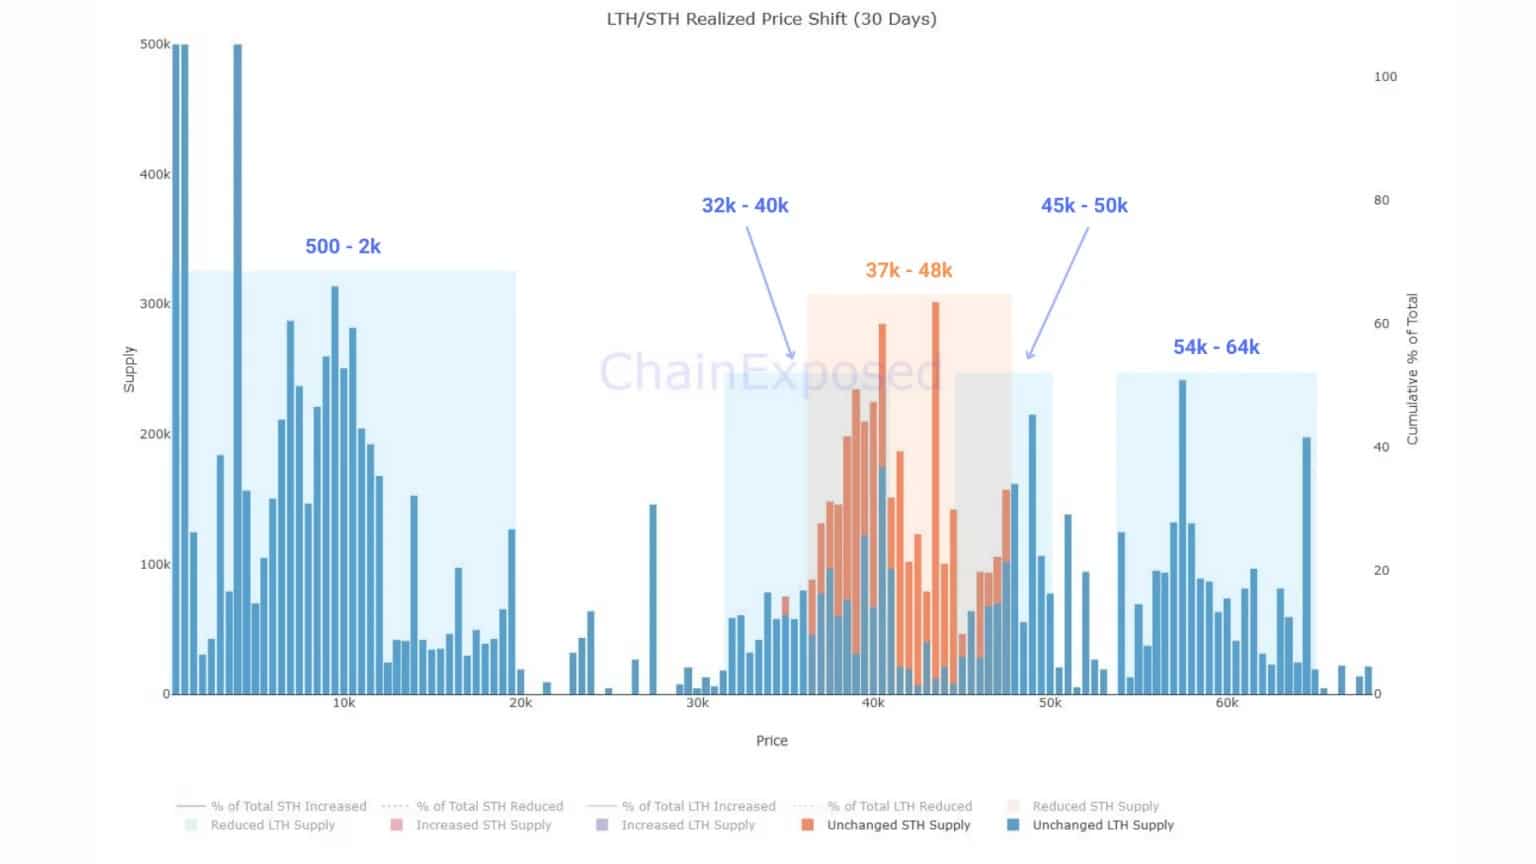
Figure 5: Distribution of Supply by Cohort and 30 Day Change
Thus, a significant portion of the LTH supply is now in a loss-making state. Having accumulated bitcoins since the beginning of the correction, the cohort has been careful to buy every dip while assuming increasingly heavy latent losses.
With the supply held by the peak buying STHs already liquidated, there remains a pile of BTC held at a loss by this cohort between $37,000 and $48,000. These coins are the most likely to be sold in a panic should the price fall once again.
Indeed, this pile of bitcoins coincides almost perfectly with the volume of BTC spent by STHs over the past 30 days.
Isolating the reduced supply, it appears that 800,000 BTC, held between $37,000 and $51,000, were liquidated during May. This chart is an on-chain record of pure capitulation.
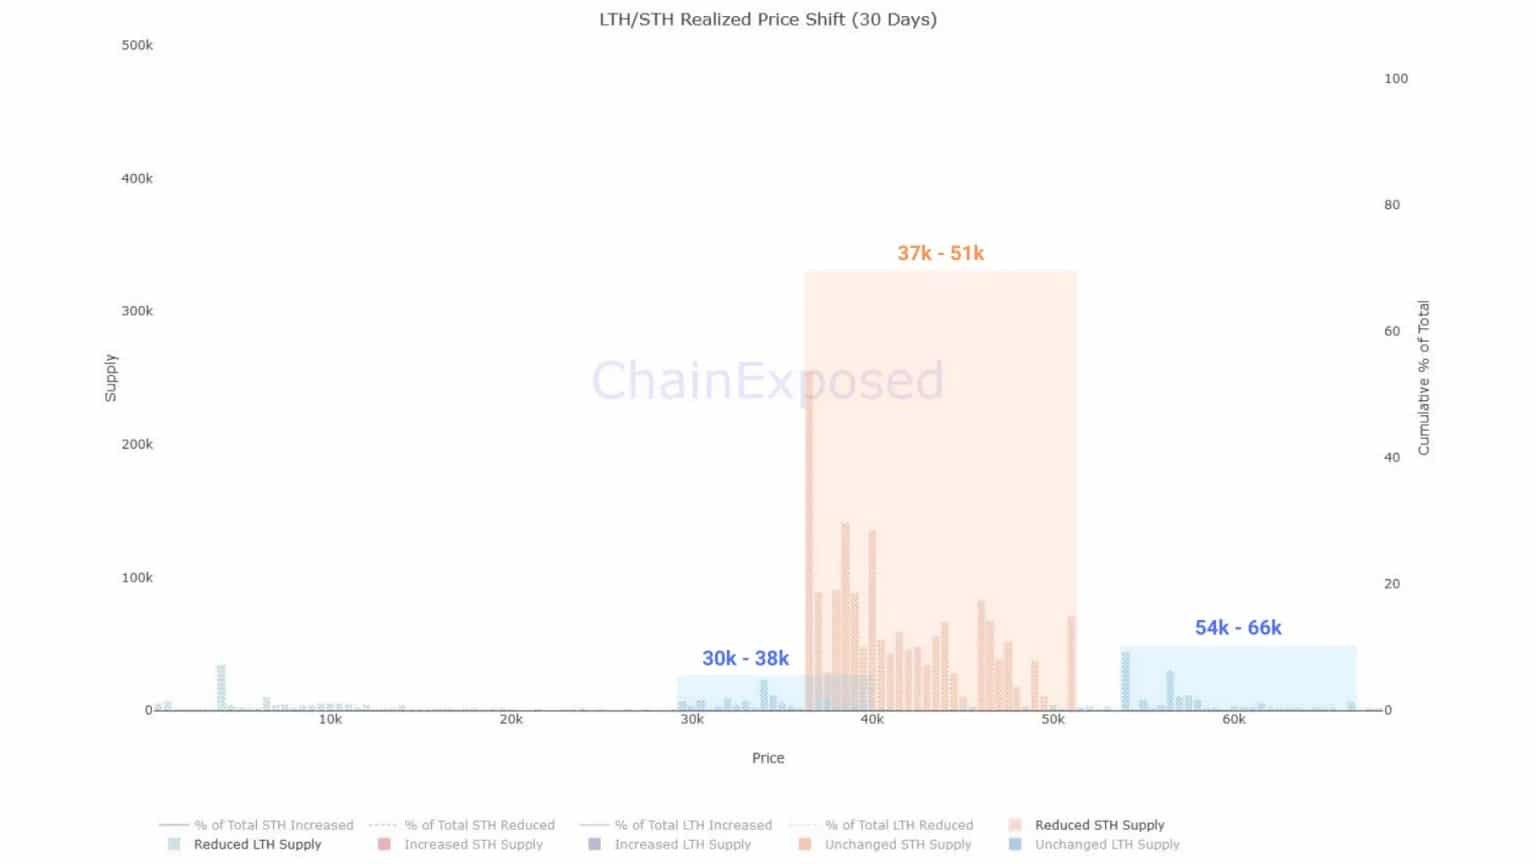
Figure 6: Distribution of Supply by Cohort and 30 Day Change
LTHs sold coins between:
- $30,000 to $38,000 (0% to 18% loss),
- $54,000 and $66,000 (40% to 50% loss).
This indicates that, despite the HODLing behaviour of long-term investors, participants in this cohort are not immune to sudden panic, causing them to sell BTC at sometimes very painful loss rates.
On the supply side, identifying bitcoins acquired and held over the past month, two clusters are identifiable:
- A large volume of approximately one million BTC found buyers between $29,000 and $32,000.
- Nearly 300,000 BTC have passed the 140-day seniority threshold and are now counted as part of the supply held by LTH.
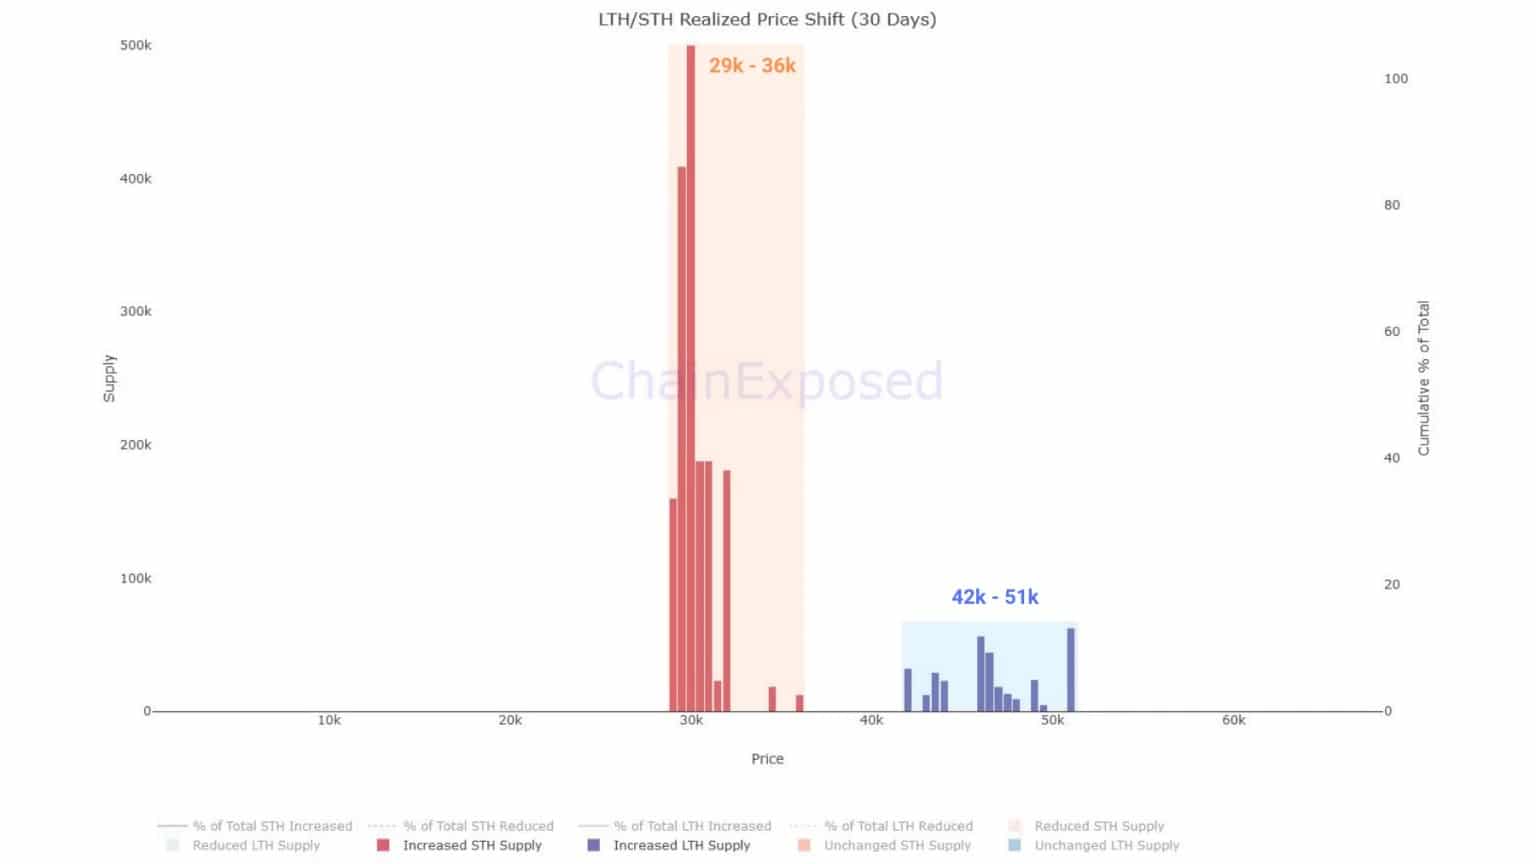
Figure 7: Distribution of Supply by Cohort and 30 Day Change
The overriding signal to take from this latest chart is that, despite macroeconomic uncertainty and numerous headwinds in the cryptocurrency market, strong demand is still present.
The range established between $32,000 and $28,000 since last month is a very attractive value area for many participants, as evidenced by the large spike of 608,427 BTC accumulated at the $30,000 price.
This is a perfect illustration of the capital transfer taking place in the market: price-sensitive investors are selling, often at a loss, BTC quickly accumulated by participants with both an opportunistic and long-term view.
However, while this reinforces the idea that each bear market forms a new base of high conviction investors, we must remember that we are in the midst of a large-scale redistribution dynamic, the most painful part of which may be yet to come.
Summary of this on-chain analysis
In sum, a dynamic redistribution of bitcoin supply from less seasoned participants to high conviction investors has been underway since November 2021.
BTC is below two key on-chain support levels, signalling the bear market’s entry into an advanced distribution phase that could intensify over the coming months.
While short-term investor spending has been creating continuous selling pressure since November 2021, it appears that a portion of long-term investors have also been shaken by the May decline, catalyzed by the collapse of the Terra/LUNA ecosystem.
In addition, a volume of over 800,000 BTC, purchased between $37,000 and $51,000, has left the hands of short term investors over the past month to be bought back at current range price levels, with heavy buying volume at $30,000, showing a realised loss of -18% to -41%.