
Following the collapse of FTX and the bankruptcy of Alameda Research, the break of the $18,000 support level has left many Bitcoin (BTC) holders in a state of latent loss that is difficult to sustain. Witnessing a historic loss realisation, November 2022 marks the formation of a new bear market floor at the $16,000 level, the strength of which remains to be tested. Here is the on-chain analysis of the Bitcoin situation.
A second floor is forming for Bitcoin
The price of Bitcoin (BTC) is stumbling on the $17,000 level, merging with its 20-period moving average.
Following the collapse of FTX and the bankruptcy of Alameda Research, the break of the $18,000 support level has left many BTC holders in a state of latent loss that is difficult to sustain.
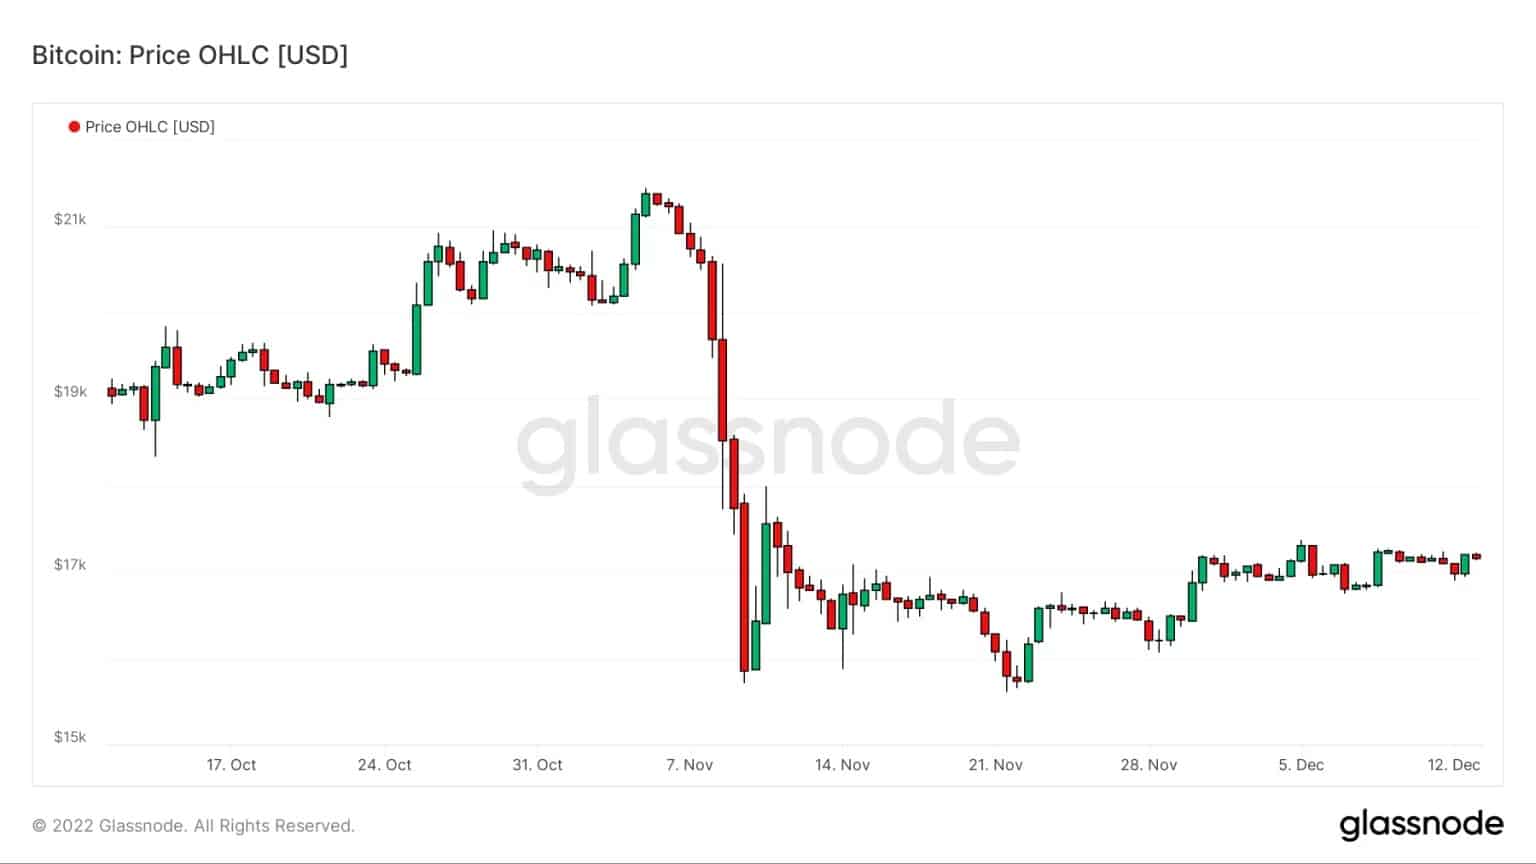
Figure 1: Daily BTC price
In response to this pressure, some of the cohort of long-term holders (LTH), as well as some miners, liquidated some of their holdings and caused a redistribution of BTC supply to lower price levels.
With a historic loss realisation, November 2022 marks the formation of a new bear market floor at the $16,000 level, the robustness of which remains to be tested.
A redistribution of BTC supply
In order to observe how the BTC price has caused a migration of the circulating supply to a new price range, we will study the URPD, or UTXO Realised Price Distribution.
This histogram chart represents the assumed acquisition prices of all UTXO circulating on the Bitcoin network, providing insight into the distribution of BTC holders’ cost base.
In the week before FTX fell, it can be seen that the spot price of BTC was just above a significant realised price volume (in blue), a bearish breach of which was likely to result in a significant loss taking.
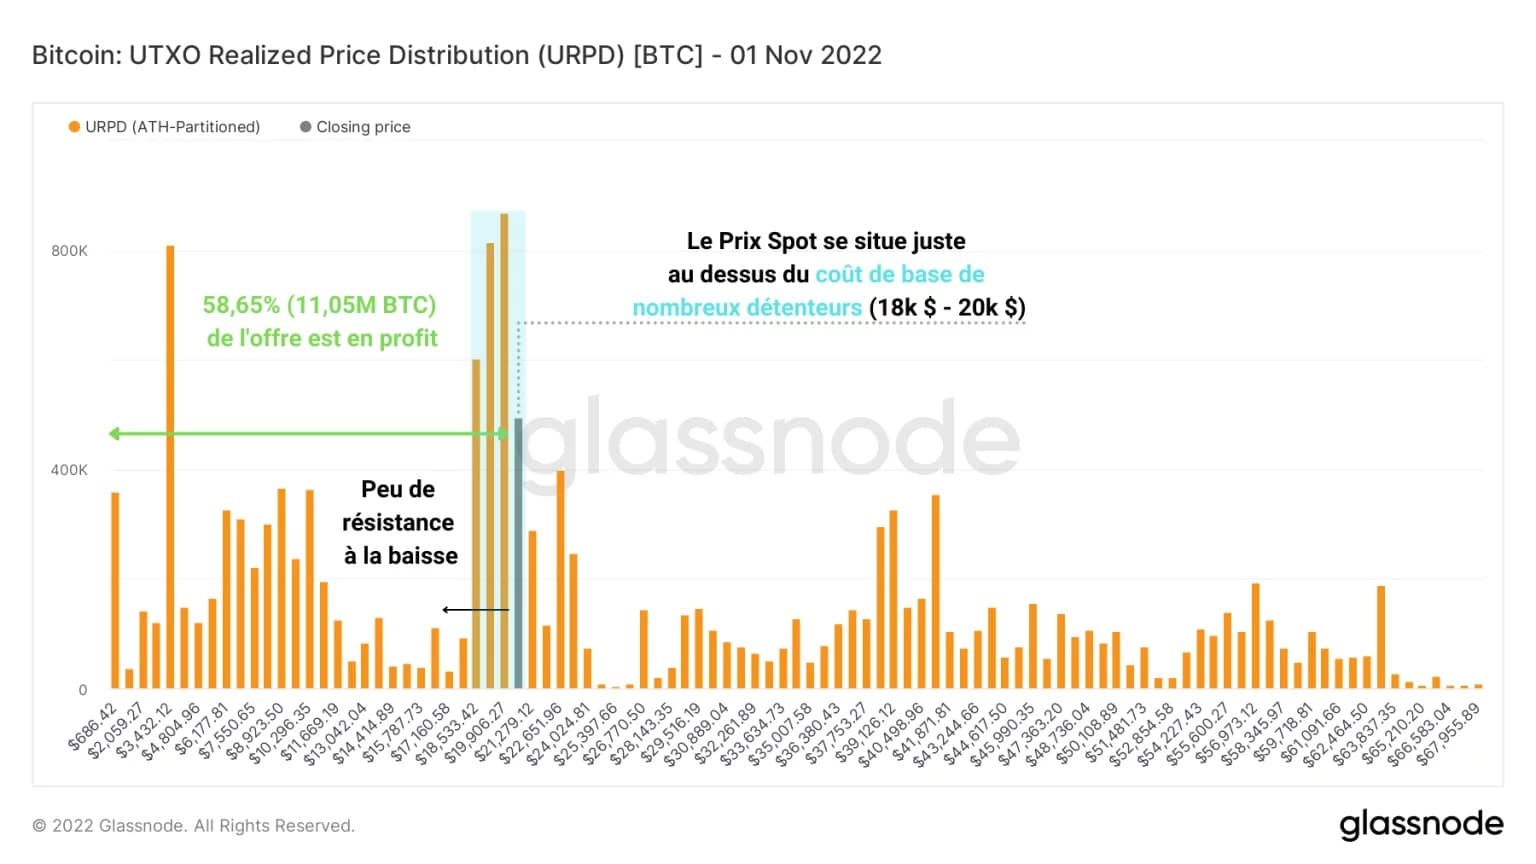
Figure 2: UTXO Realised Price Distribution (1 November 2022)
At this point, just under 60% of the outstanding BTC supply was in a state of latent profit, which was still quite high given the advanced stage of the bear cycle.
A week after the price drop, we could observe a decrease in the concentration of supply between $18,000 and $20,000, which gradually migrated towards the $16,400 level, where almost 5% of the outstanding supply was then located.
The fact that the BTC price plunged below $18,000 clearly caused a bearish redistribution of BTC held at a loss, so that a change in ownership takes place at the new bear market floor.
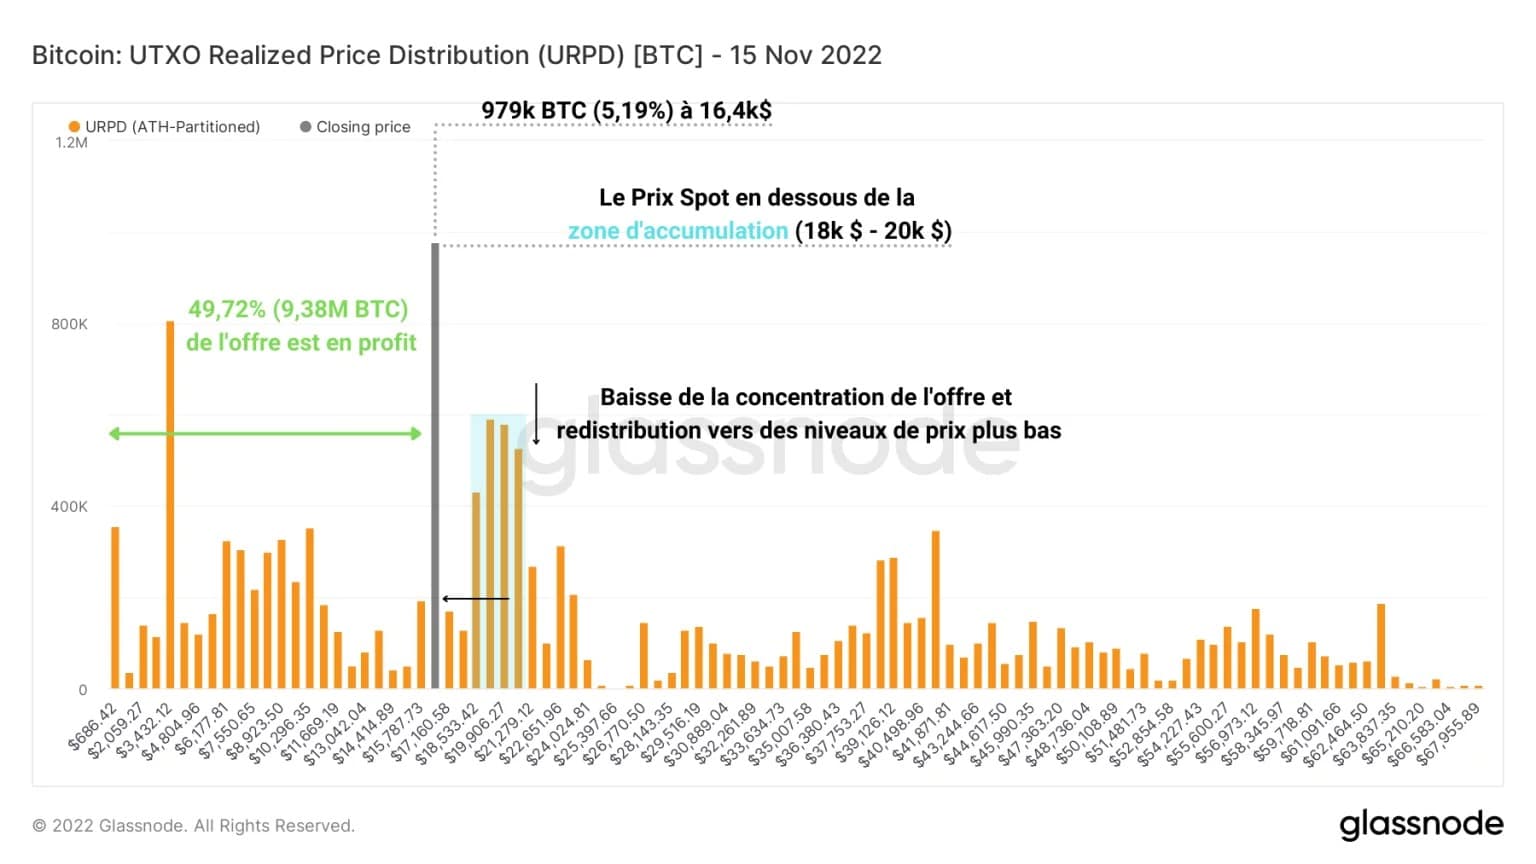
Figure 3: UTXO Realised Price Distribution (15 November 2022)
During this period, the majority of the outstanding supply (50.28%) was at a loss, signalling a sharp decline in the profitability of the overall market that only occurs during the most painful periods of down cycles.
At present, the former accumulation zone has turned into a potential distribution zone (in red), which could hinder the upward momentum of the BTC price.
Indeed, BTC still held at a loss in this price range have significant selling probabilities that could manifest themselves when the price tests this zone to the upside.
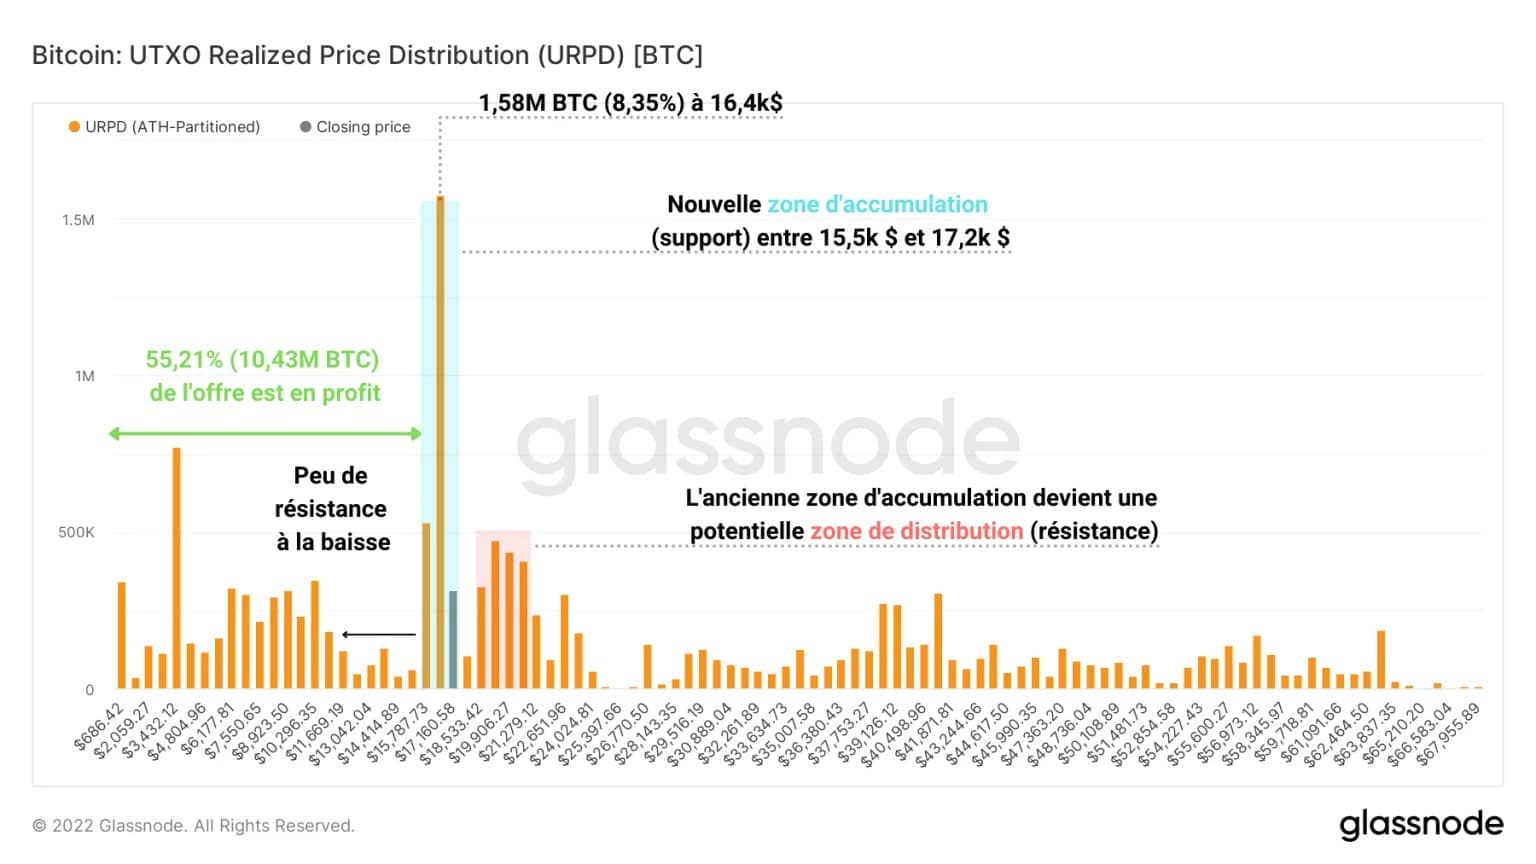
Figure 4: UTXO Realised Price Distribution (13 December 2022)
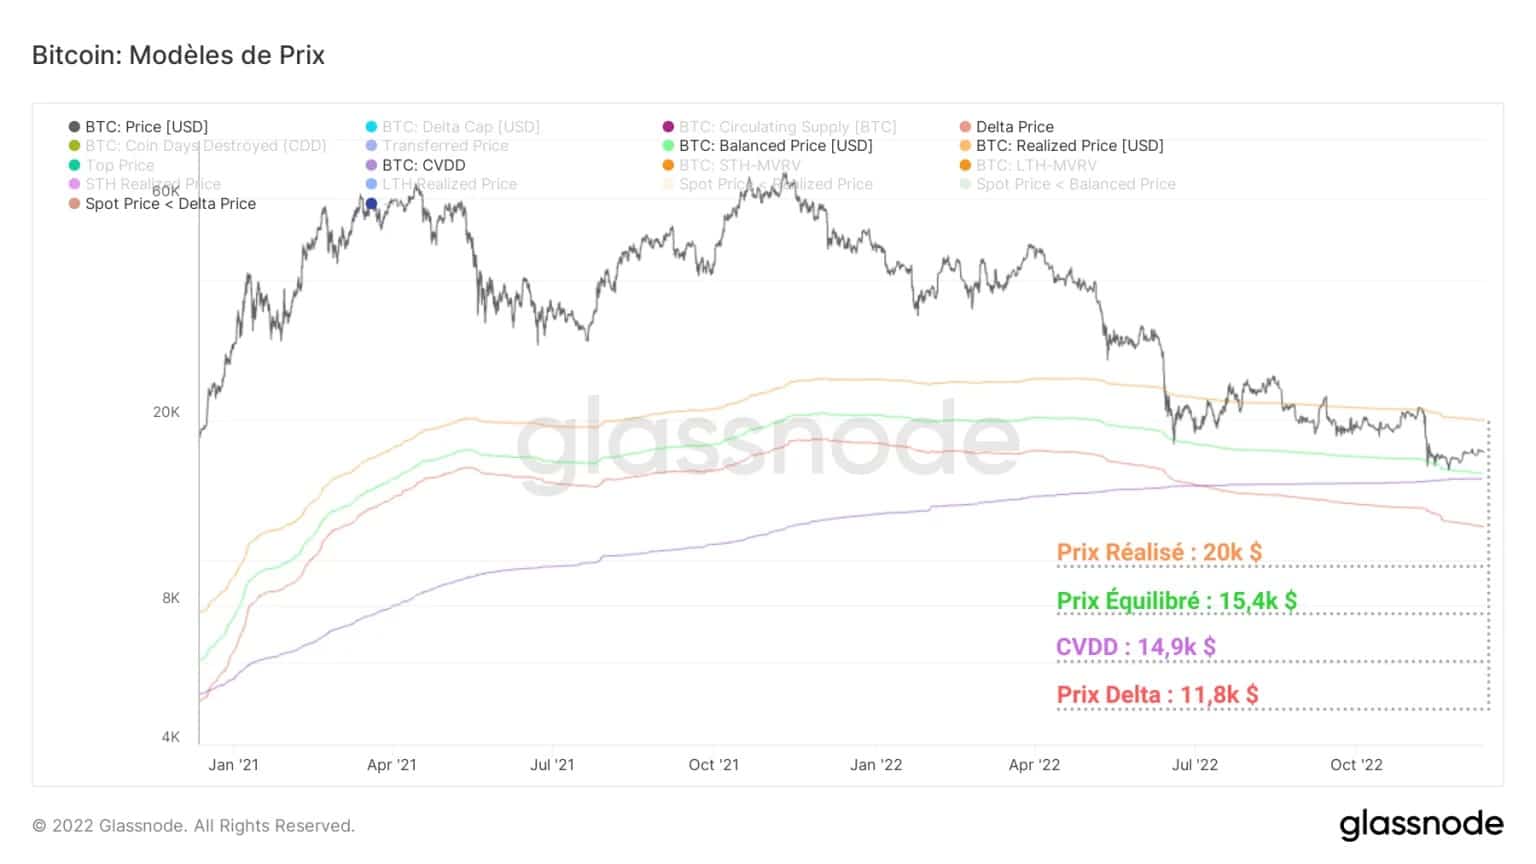
Figure 5: Realised Price, Balanced Price, CVDD and Delta Price
Holders who have accumulated in this price range are now incubating a small gain, bringing the supply into a profitable state around 55.21%
Bitcoin support and resistance to watch
After identifying a new potential support zone for the BTC price, with the lower bound around $15,500 to $16,000, we can look at the on-chain price patterns presented a month ago to establish areas of interest for participants.
Overall, the observation remains essentially the same: the BTC price, which has been in an undervalued zone since it fell below the realised price (orange), is moving above the balanced price (green), which served as support when the $18,000 mark was broken.
With a convergence of the CVDD (purple), the balanced price and the new accumulation zone mentioned above, it seems that the price range between $15,000 and $16,000 could provide robust support in the event of a fall in the spot price.
If, however, this price zone were to be invalidated on the downside, the delta price (in red), located near $12,000, represents the ultimate support that has coincided with the final wicks of all previous down cycles.
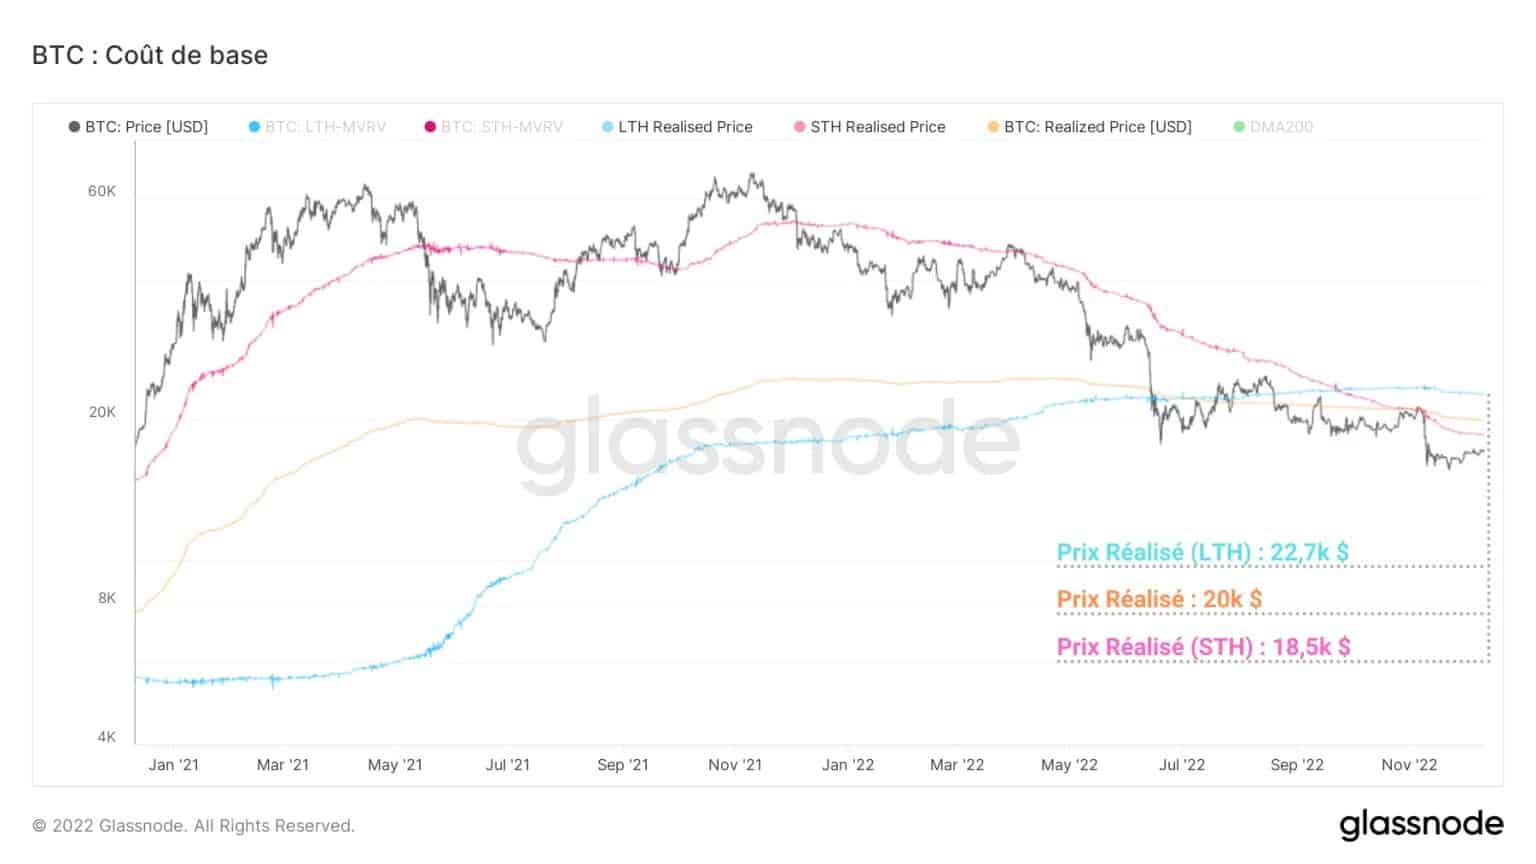
Figure 6: Realised Market Price and Entities (STH/LTH)
Looking at the optimistic scenario of a bullish recovery, the resistance levels that could hinder the BTC price are:
- The realised price of STH ($18,500): coinciding with the former accumulation zone, this price level represents a supply zone where many holders could sell as soon as the profitability of their position is neutral again;
- The realised price (~$20,000): representing the cost base of the average investor, this price model marks the boundary between undervaluation and overvaluation of the BTC spot price;
- The LTH realised price ($22,700): measuring the cost base of long-term holders, this indicator is the last threshold that the price will need to clear to signal a return to profitability for all cohorts of BTC holders.
Summary of this on-chain analysis of BTC
In sum, this week’s data tells us that a new bearish redistribution of supply has taken place following the break of the $18,000 support.
A new accumulation zone, located at the $16,000 level, is currently concentrating nearly 8% of the supply in circulation and constitutes, with the convergence of the balanced price and the CVDD towards $15,000, a second bearish market floor whose robustness remains to be tested.
Conversely, the former demand zone ($18,000 – $20,000) now coincides with the cost base of short-term holders and represents a potential barrier to a bullish recovery in the BTC price.