
Following the insolvency signals and then the proven bankruptcy of the FTX exchange, the price of Bitcoin (BTC) entered and then invalidated the former bear market low around $18,000. The cohort of long-term holders has been notably responsive, shedding nearly 60,000 BTC over the past week.
Bitcoin invalidates $18,000 support
Following signals of insolvency and then bankruptcy from the FTX exchange, the price of Bitcoin (BTC) penetrated and then invalidated the former bear market floor around $18,000.
Plunging a large base of holders into a state of latent loss, the price drop caused a wave of panic that pushed BTC to the $16,000 level, where the Balanced Price sits, which had already served as support for the June 2022 price drop.
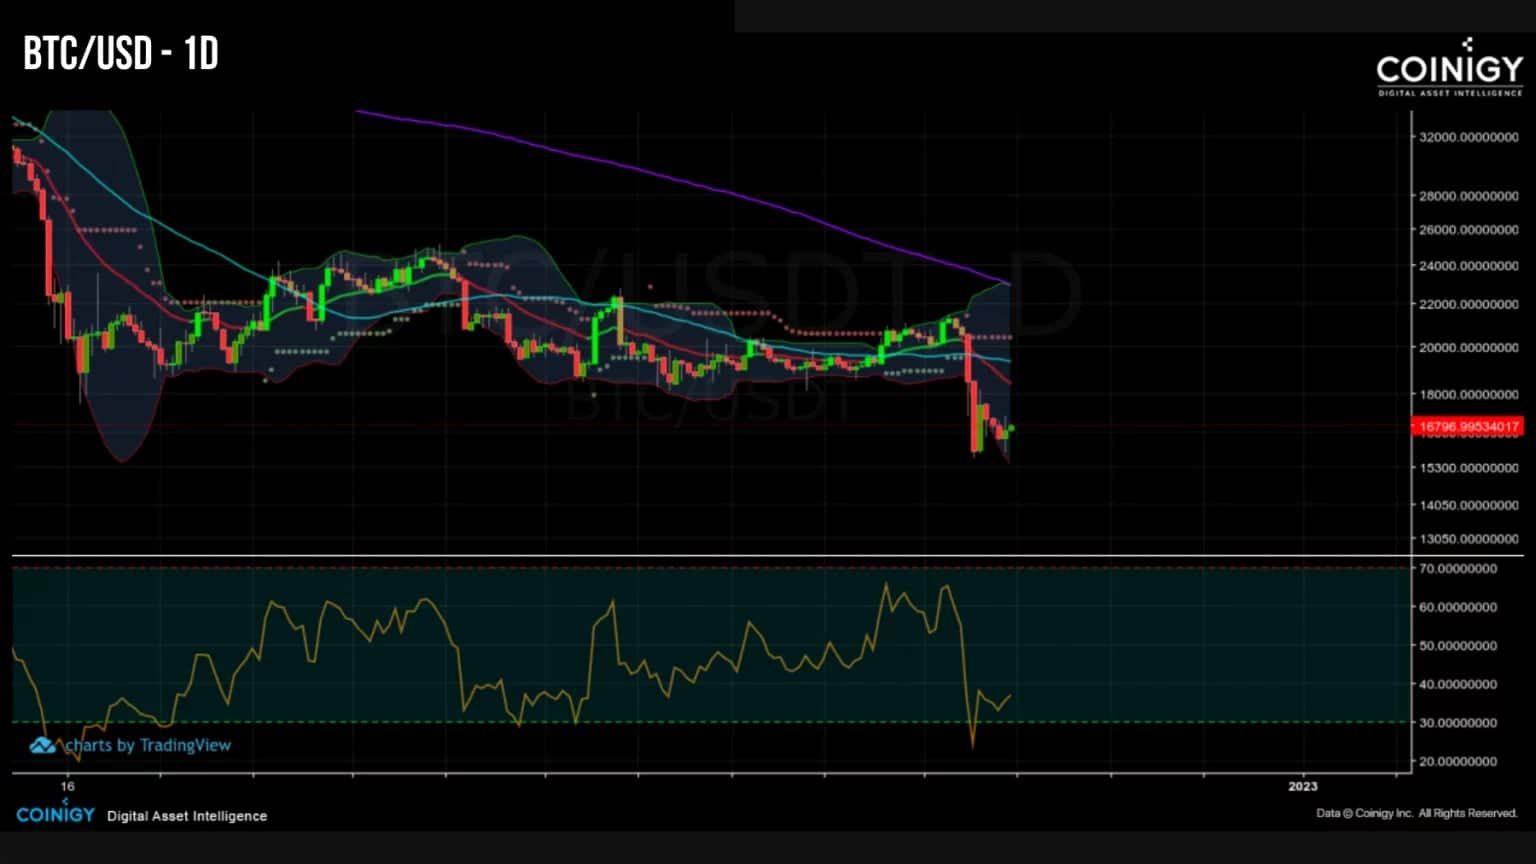
Figure 1: Daily BTC price
The long-term holder cohort has shown notable responsiveness to the capitulation events of May and June 2022, shedding nearly 60,000 BTC over the past week.
With a loss realisation of close to -50%, this group, despite being known for its price insensitivity, has caused the 4th largest wave of UTXO rejuvenation of the current bear cycle.
BTC bounces back to balanced price
Over time, the BTC price has historically encountered three distinct on-chain support levels:
- The Realized Price (in yellow), which aggregates the price of all UTXO circulating on the network at their last movement;
- The Balanced Price (green) calculates the difference between the realised price and the transferred price (price weighted according to the Days of Pieces Destroyed). It can be seen as a form of ‘fair value’ pricing model, capturing the difference between what has been paid (realised), and what has been spent (transferred);
- The Delta Price (in purple) is a hybrid ‘half-fundamental, half-technical’ price model, calculated as the difference between the realised price and the average price at all times.
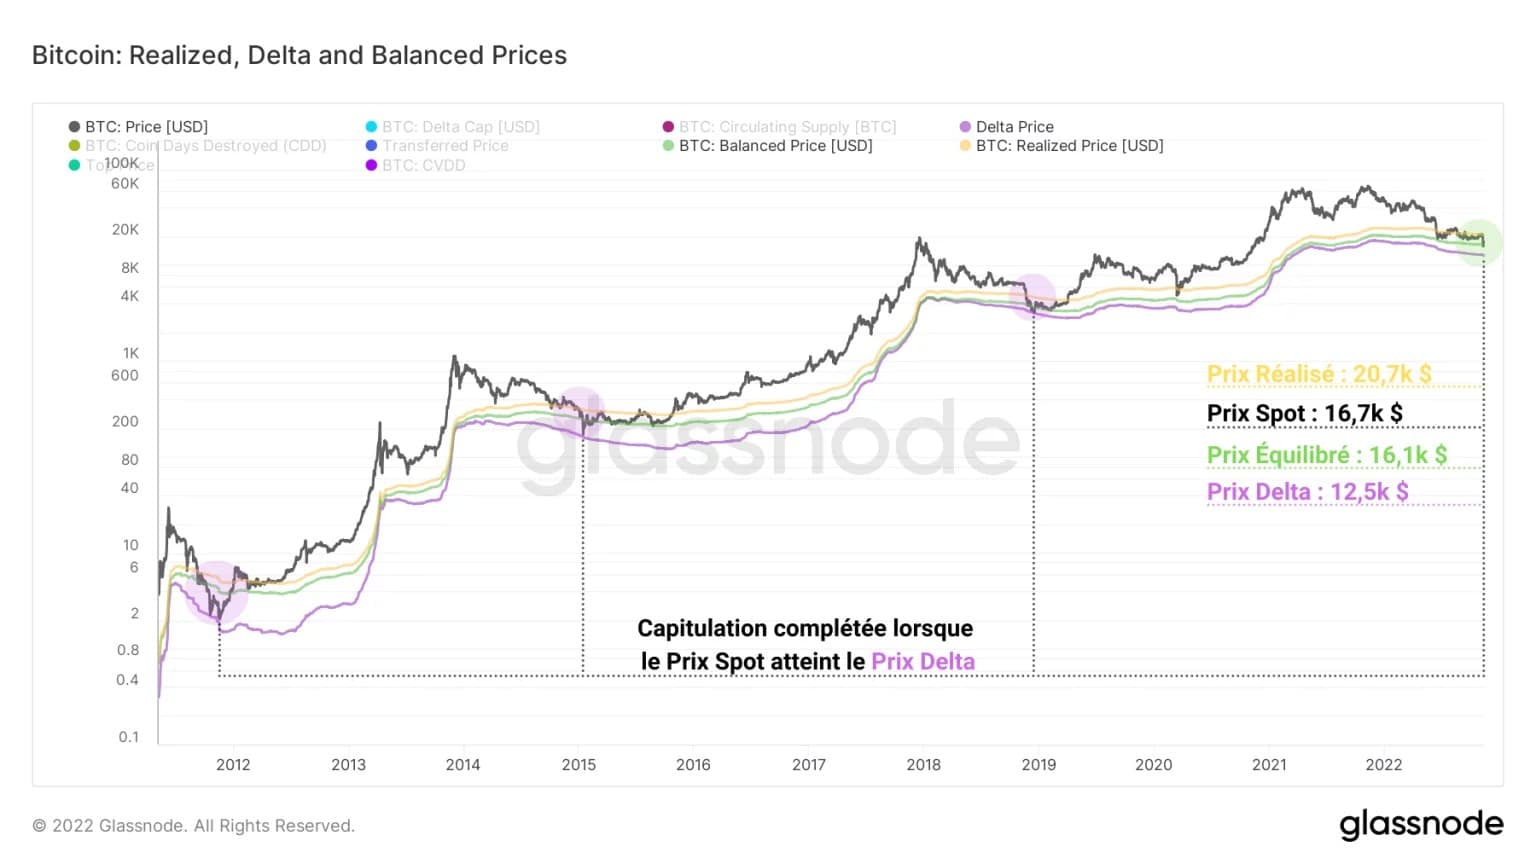
Figure 2: Spot, Realised, Balanced and Delta prices
In previous cycles, most of the floor formation process took place between the Realized and the Balanced price, while the lows were all established by a volatile wick reaching the Delta price.
Currently, we can note that the spot price is bouncing for a second time off the Balanced Price, following a first test in June 2022, at the former $18,000 support.
Significant spending of former UTXO
While the loss of the $18,000 support facilitated the redistribution of many BTC, it is pertinent to highlight the significant rejuvenation phase that coincided with this event.
Indeed, a peak of nearly 2.4 million destroyed Coin Days (CDs) was recorded over the past week, indicating that many long-held positions have been spent.
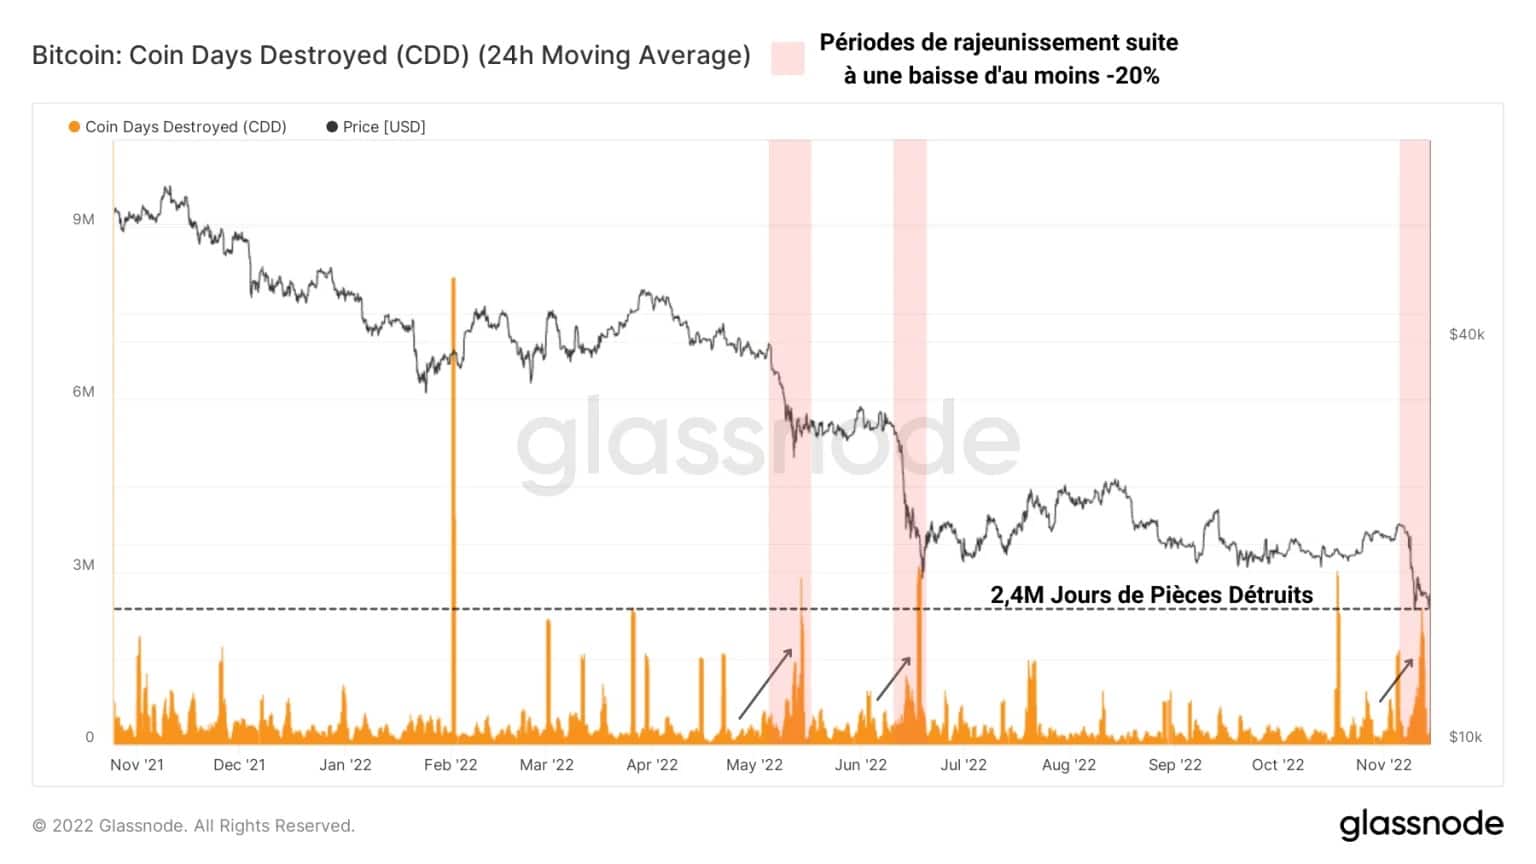
Figure 3: Coin Days Destroyed
This period of rejuvenation concurrent with a drop of at least 20% in the price of BTC is reminiscent of the bloody declines of May and June 2022 and indicates that the price drop has not only impacted short-term holders, but the market as a whole.
By separating the volume of spending in a given period by age bands, we can observe the relative spending behaviour of young coins (less than 6 months old) and old coins (more than 6 months old)
Thus, the following graph measures the relative share of spending volume associated with older coins, held by long-term holders.
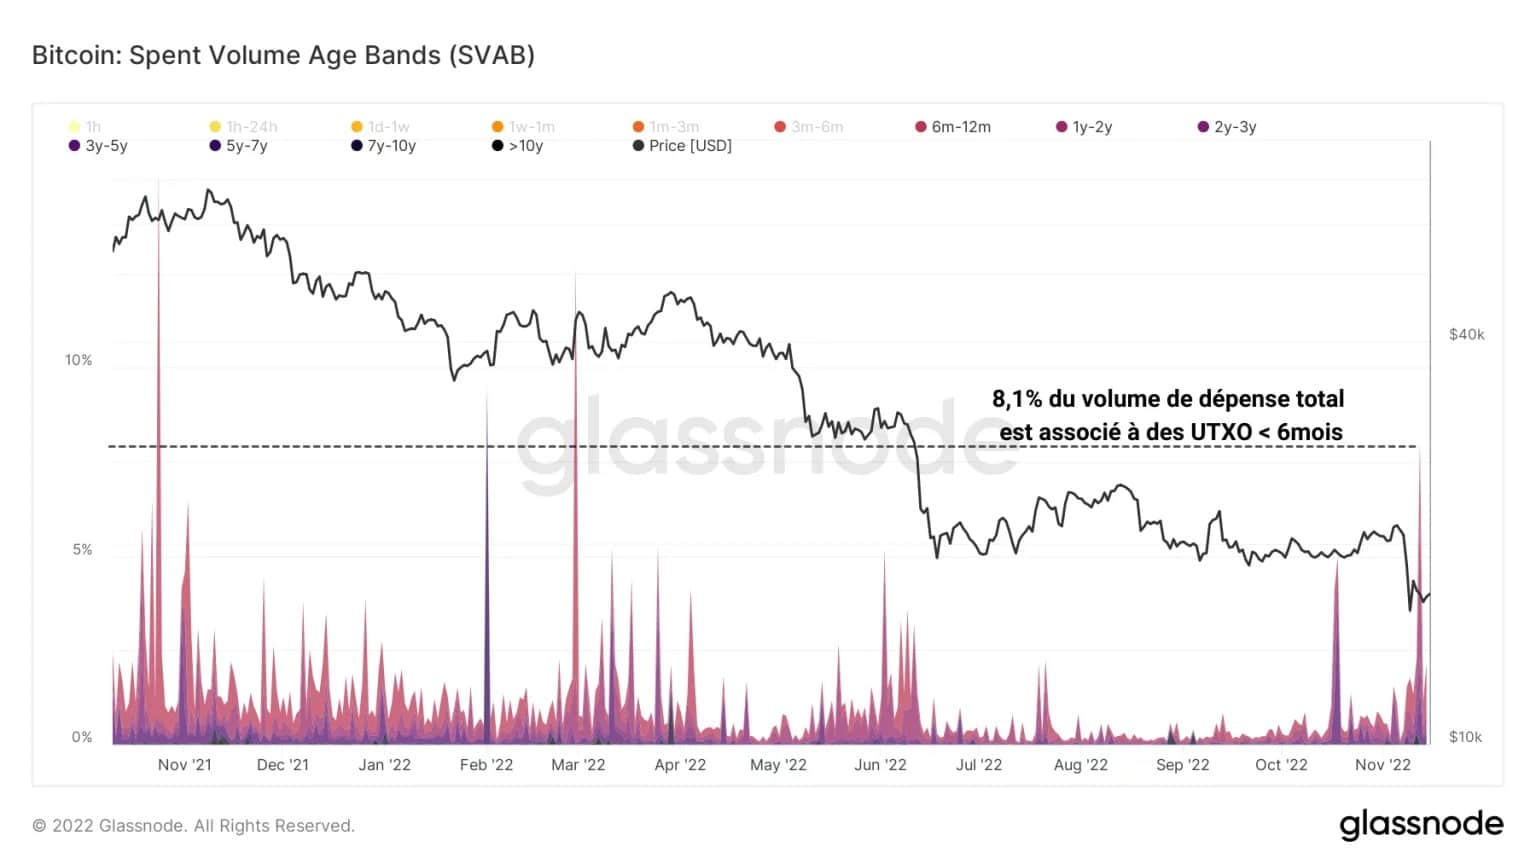
Figure 4: Age bands of BTC volume spent (older than 6 months)
It appears then that the loss of $18,000 support has caused the 4th largest wave of UTXO rejuvenation of the current bear cycle, in terms of relative weight.
This means that some long-term holders have participated in the redistribution dynamic in a supportive manner and have indeed yielded to selling pressure.
For a better understanding and appreciation of on-chain analysis, check out our podcast on the subject:
Long-term holders are easing off
By measuring the supply held by the long-term investor (LTH) cohort, we can highlight the spending behaviour we have just identified.
The following graph shows the supply of LTHs (orange), as well as the daily variation of this measure (purple). Here, a decline of nearly 60,000 BTC, starting on October 7 and continuing to this day is clearly identifiable.
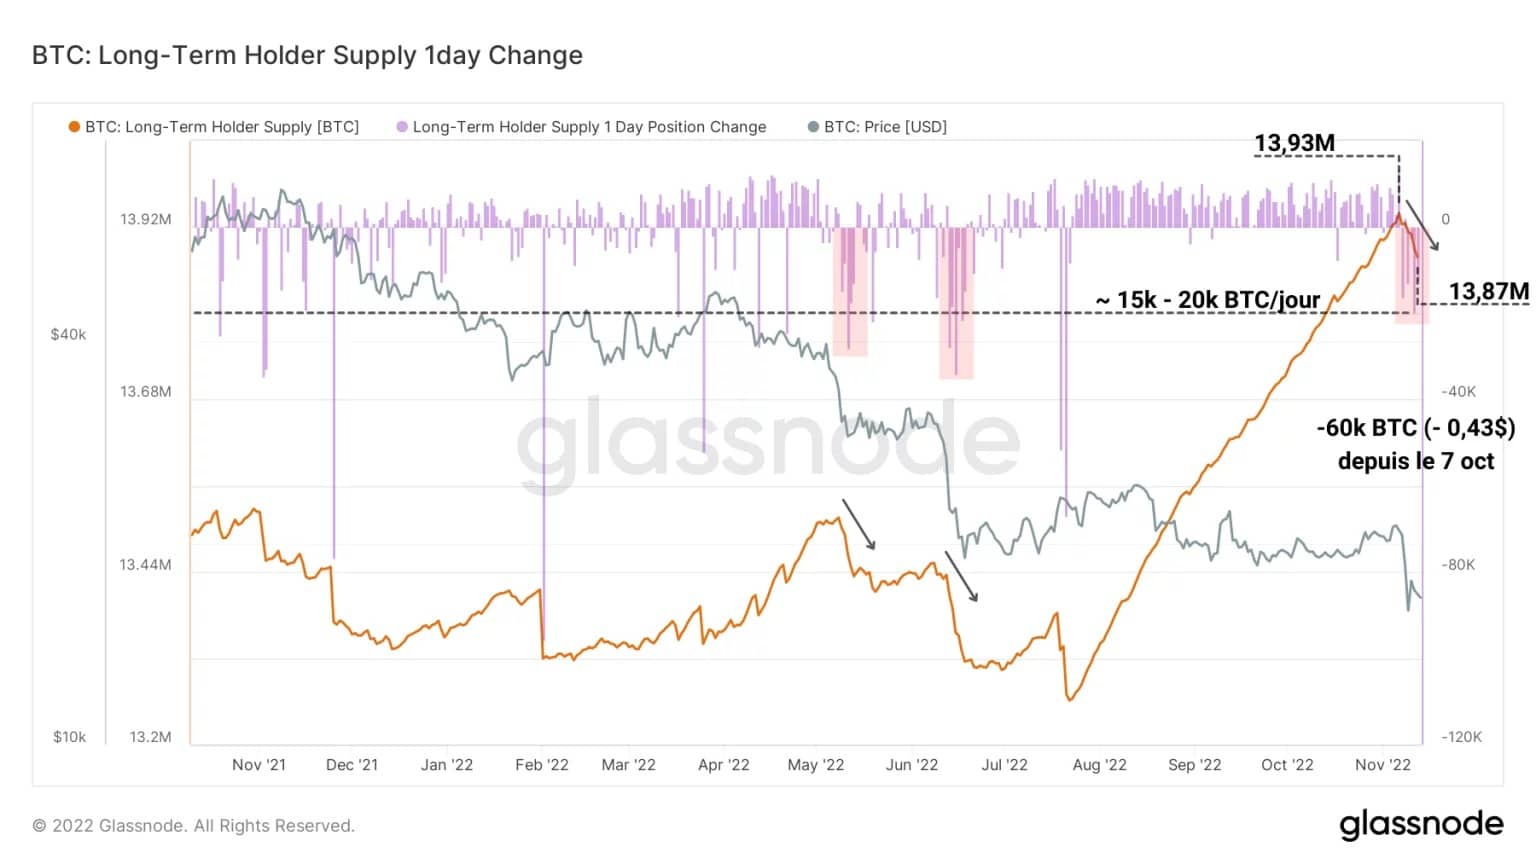
Figure 5: Long term holder supply and daily variation
Furthermore, it appears that outflows from LTH wallets have been occurring at a rate of approximately 15,000 BTC to 20,000 BTC per day, which is still a lower flow than during the price capitulation events of May and June 2022.
In sum, this cohort of holders liquidated around 0.43% of their holdings during the recent decline, a less pronounced phase of offloading that indicates that, despite the selling pressure, LTHs are not inclined to part with their BTC at these low price levels.
Finally, it appears that, compared to previous bear cycles, the long-term investor cohort is currently holding a lower volume of losing supply, both on a relative and absolute basis.
Indeed, nearly 42.8% of the 5.95 million BTC held by LTHs is currently in an unrealized loss position, representing approximately 2.54 million BTC.
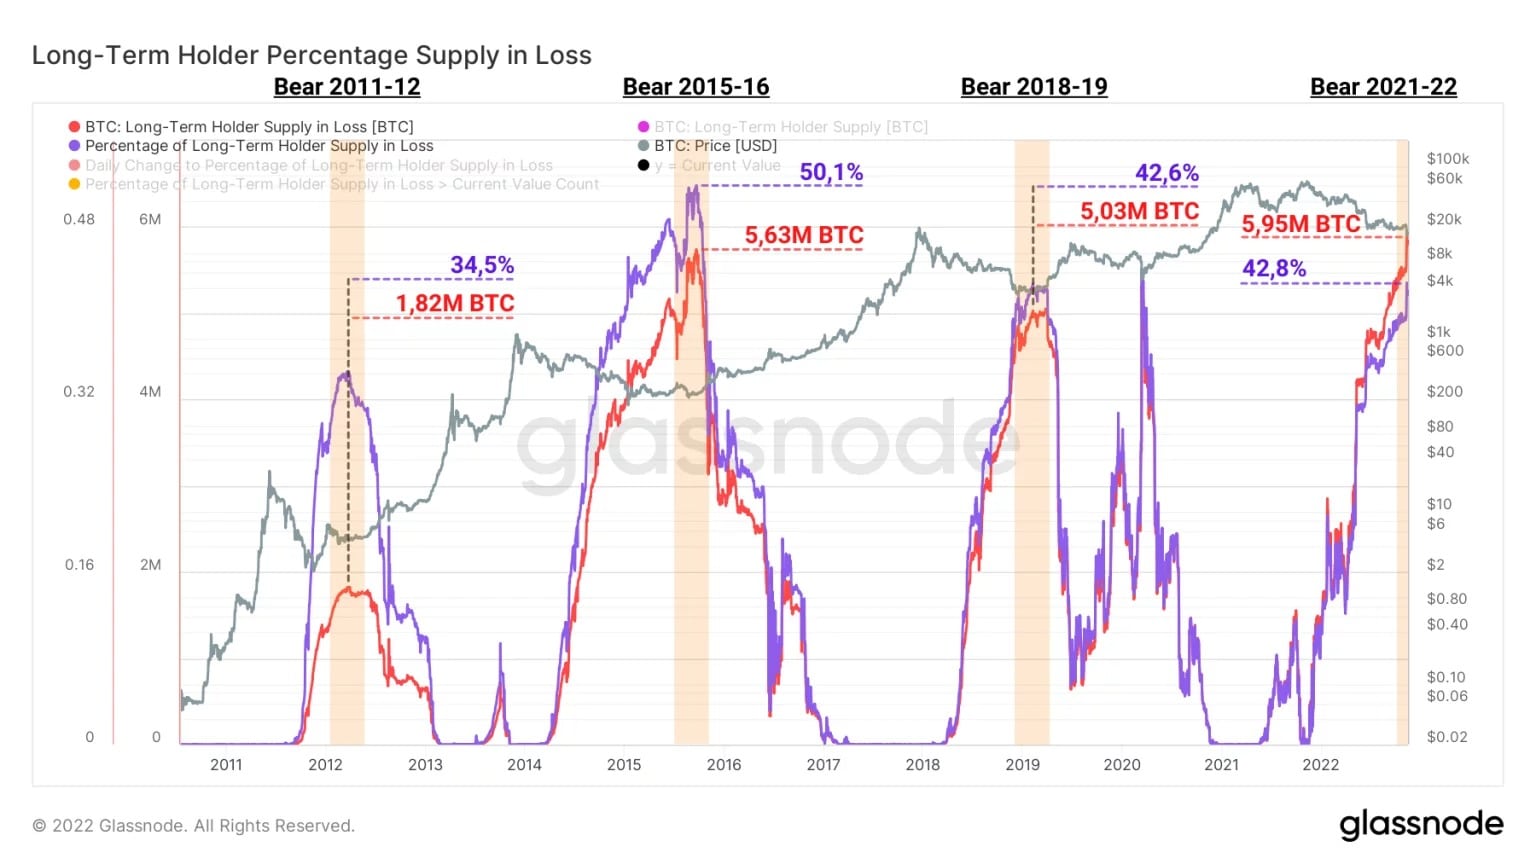
Figure 6: Long term holder supply at loss (absolute and relative values)
During the bear market of 2015 – 2016, the supply held at a loss by this cohort had reached an all-time high of 2.82 million BTC.
This gradual improvement in the long-term profitability of BTC over the last few bear cycles can be explained in part by the increasing likelihood of older coins being held through the bear market (HODLing behaviour and loss of access to wallets).
Summary of this on-chain analysis
In sum, this week’s data indicates that, following the invalidation of the $18,000 floor, the price drop caused the redistribution of over 60,000 BTC.
The spot price has once again reached the equilibrium price, which serves as the historical on-chain support for BTC declines during bear markets, with the delta price as the last bastion.
With a significant portion of the last seven days’ spending volume associated with UTXO older than 6 months, it appears that the drop in the spot price towards the $16,000 level has pushed some long-term holders (LTH) to sell.
Indeed, nearly 60,000 BTC, or almost 10% of the total redistribution volume, have exited LTH portfolios, albeit at a lower pace and magnitude than during the capitulation events of May and June 2022, and with a return of around -50%.