
In terms of volumes, June saw the worst performance for NFTs since the beginning of the summer of 2021. While January saw record highs, activity in the sector has since fallen off sharply. But this trend is not completely correlated to the crypto market.
NFTs see volumes fall
While non-fungible tokens (NFTs) saw their volumes soar earlier this year, the trend has since reversed. This is especially so as June recorded its worst performance since the beginning of the summer of 2021:
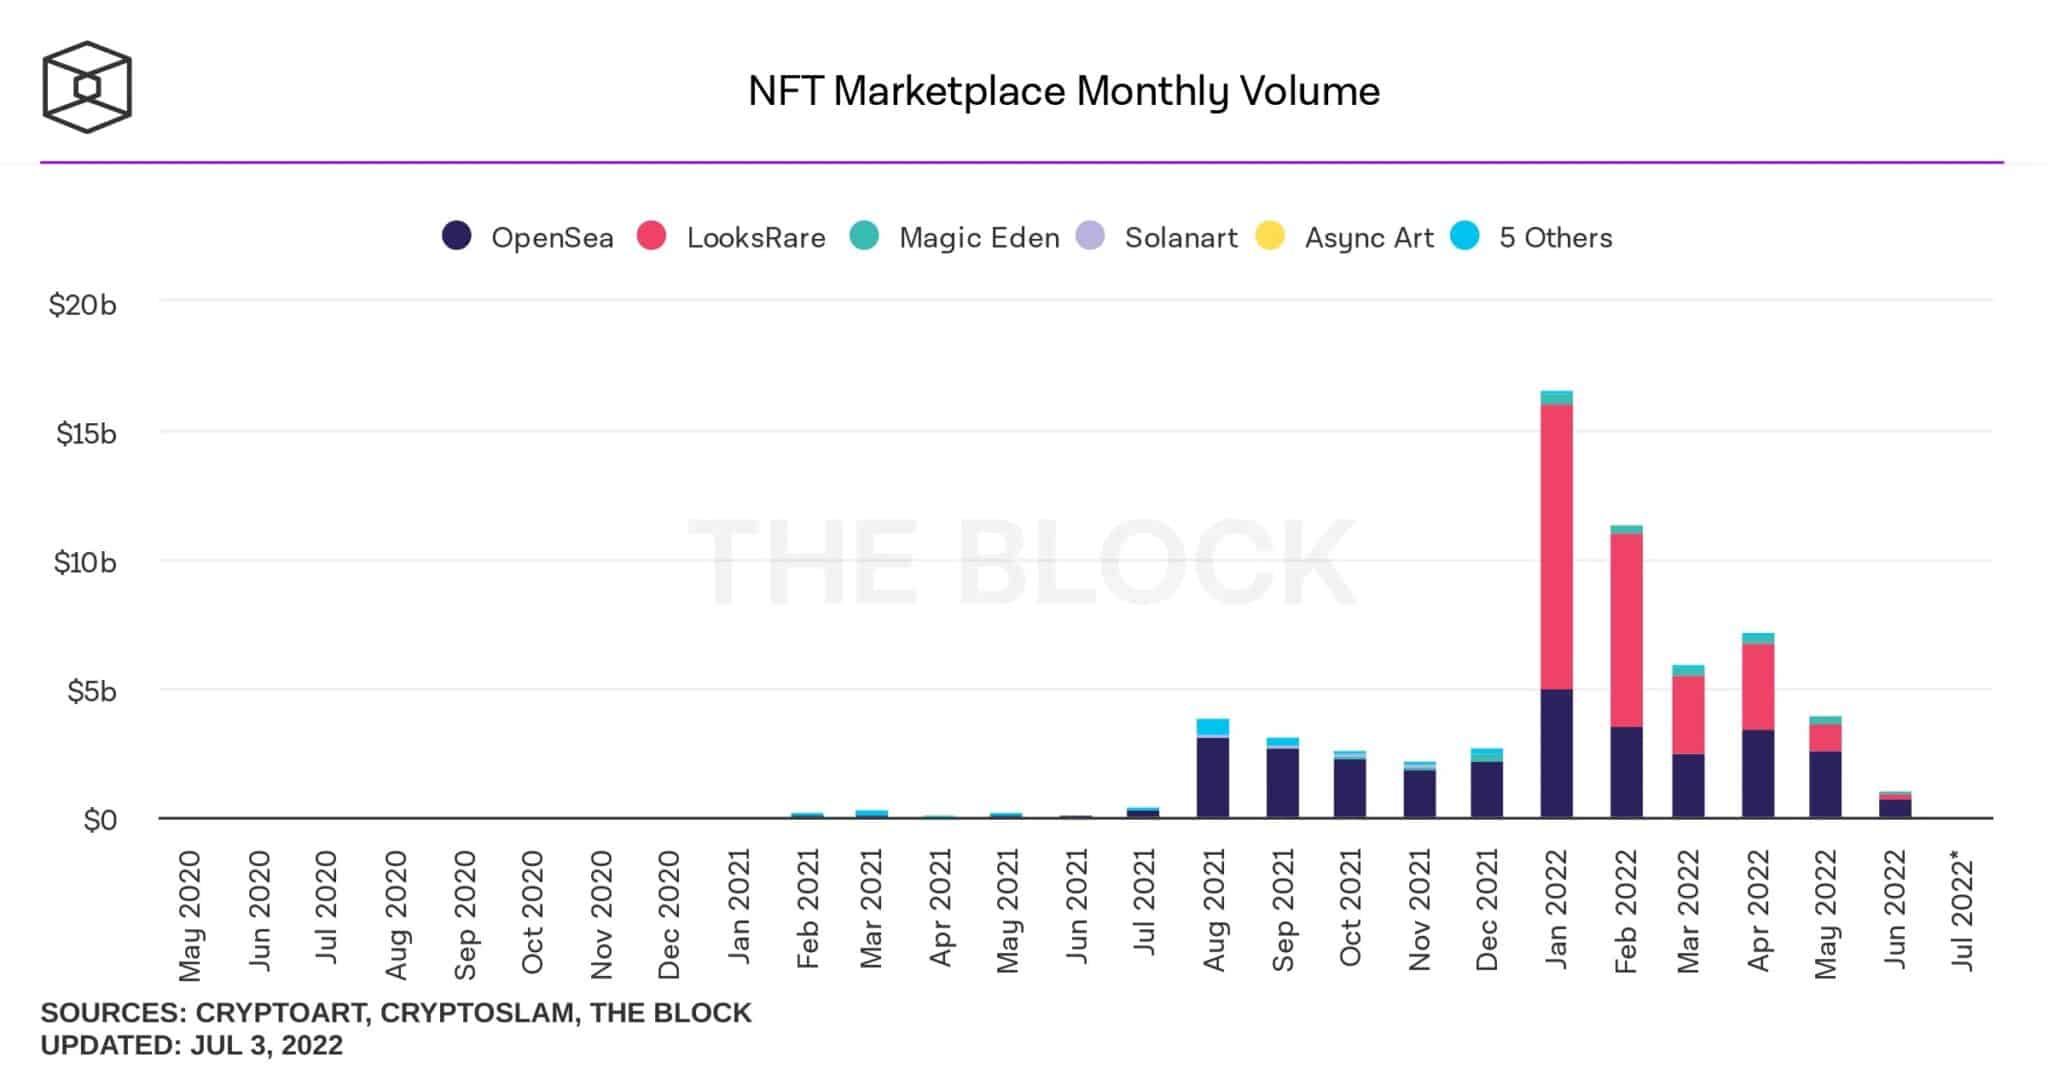
Figure 1: Volumes on NTTs
While June ended with a total volume of $1.04 billion, the January high peaked at $16.57 billion. For a more rational comparison, May recorded $4 billion. But in the space of one month, the volume still fell by 74%.
This downward trend can also be seen between the two main competitors, OpenSea and LooksRare:
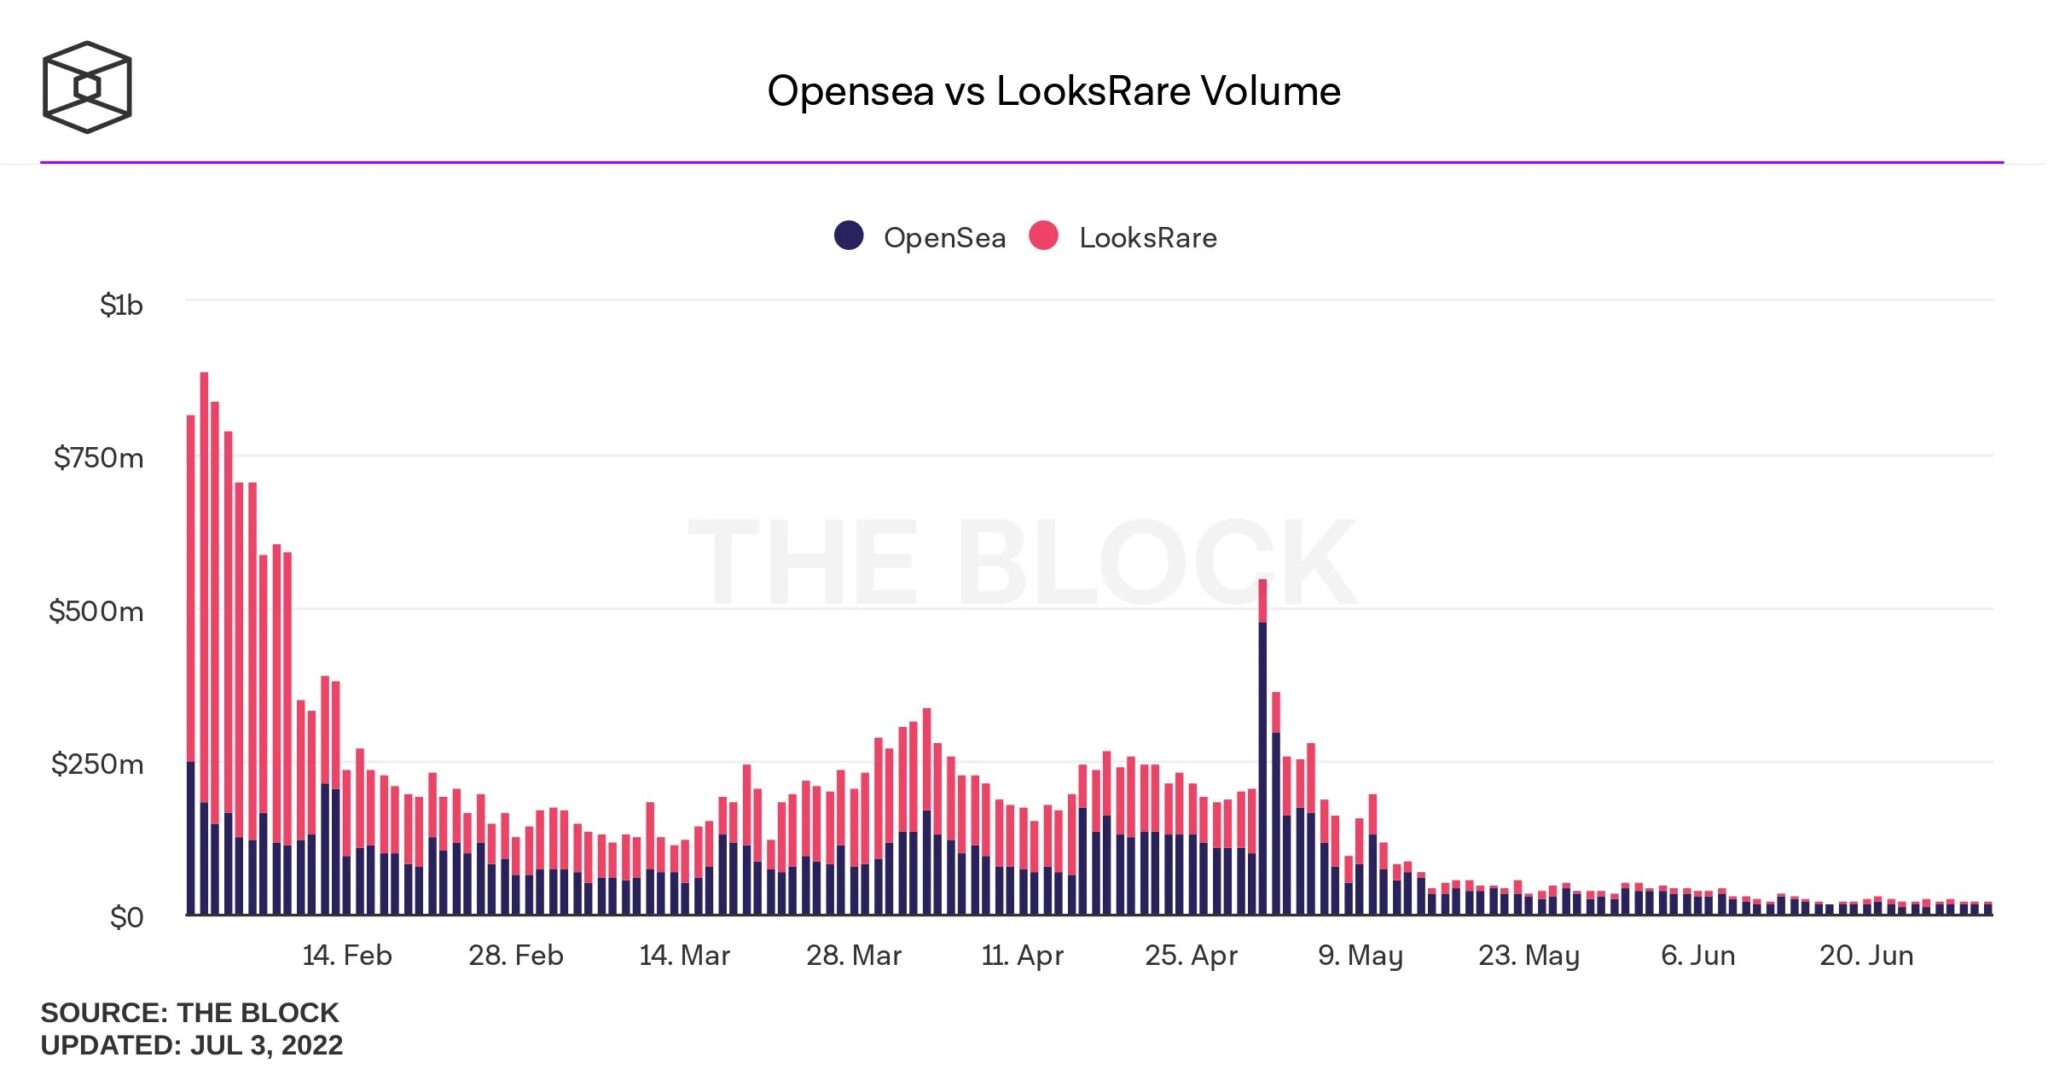
Figure 2: Comparison of volumes between OpenSea and LooksRare
If we cross-check the data in figures 1 and 2, we realise that the fall is even more severe for LooksRare. While the latter, which was aiming to dethrone OpenSea, represented the majority of volumes in the first quarter, its fall is more violent.
Taking the day of February 2, 2022 as an example, LooksRare generated $703.1 million in volume, compared to $182.58 million for OpenSea. As of June 30, OpenSea generated $15.59 million in volume while LooksRare was at $5.52 million.
Comparing these two extremes, if they are comparable at all, we can see that even if the fall is significant and widespread, it is all the more severe for the outsider. Indeed, the latter sees its volume divided by 127.4 over the two days compared, while this coefficient is 11.7 for OpenSea.
The impact on Ethereum (ETH)
If we focus on the Ethereum (ETH) blockchain, OpenSea remains the largest consumer of daily gas. The size of volumes on the popular NFT marketplace is in fact the barometer of transaction prices on Ethereum.
However, that didn’t stop the network from seeing the average cost of a transaction hit its lowest since December 12, 2020 on Saturday. Back then, the average price recorded $1.62 compared to $1.69 this weekend:
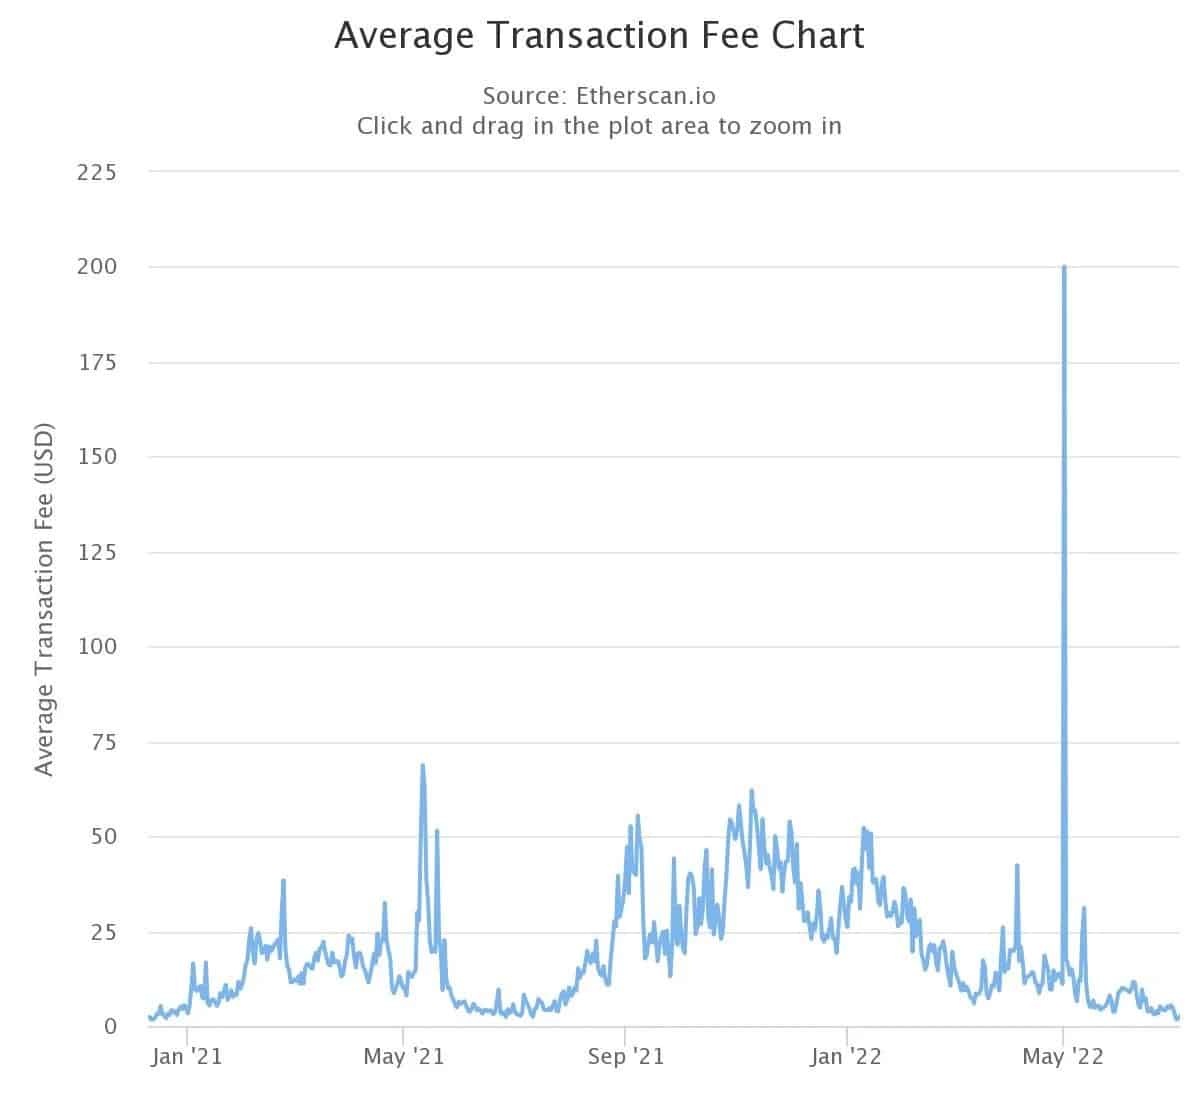
Figure 3: Average price of a transaction on Ethereum
Of course, the health of the NFT market is not the only reason for the drop in fees. This trend is part of an overall drop in network usage. Nevertheless, this decrease in volumes still impacts the price of gas on Ethereum.
In order to understand OpenSea’s gas consumption, we need to study the protocols used by the platform. Since the deployment of Seaport in mid-June, OpenSea has typically charged between 200 and 400 ETH per day:
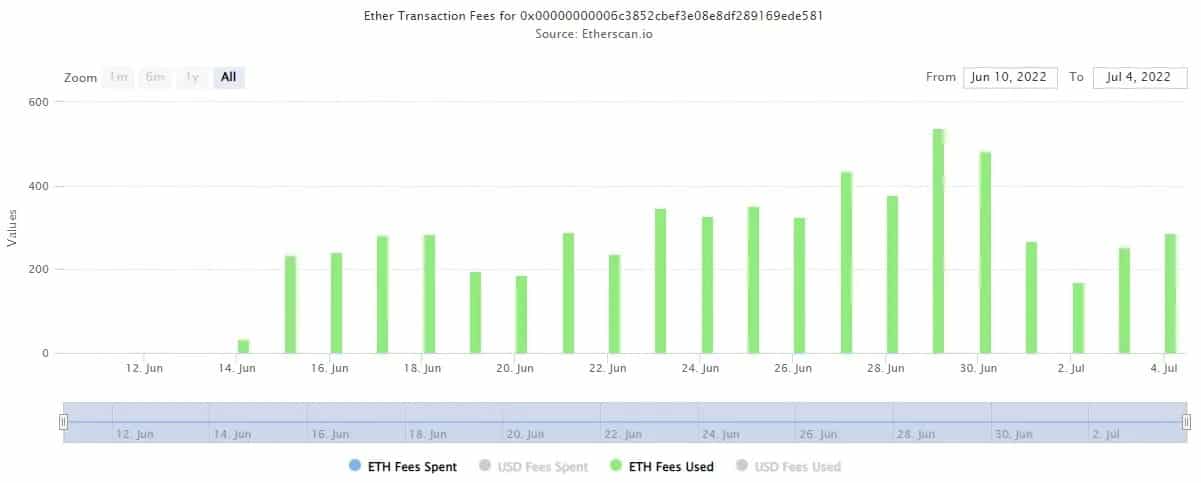
Figure 4: Charges consumed by OpenSea’s Seaport
If we compare this trend to Wyvern, OpenSea’s former smart contract, we can see the full extent of the decline in activity. On Wyvern V2, active from March to June this year, OpenSea was generating between 300 and 1000 ETH in fees per day. But the drop is even more marked when comparing the current period to when the application was running on Wyvern V1.
As the graph below shows, the entire month of January saw days with more than 1,000 ETH in fees and sometimes more than 2,000:
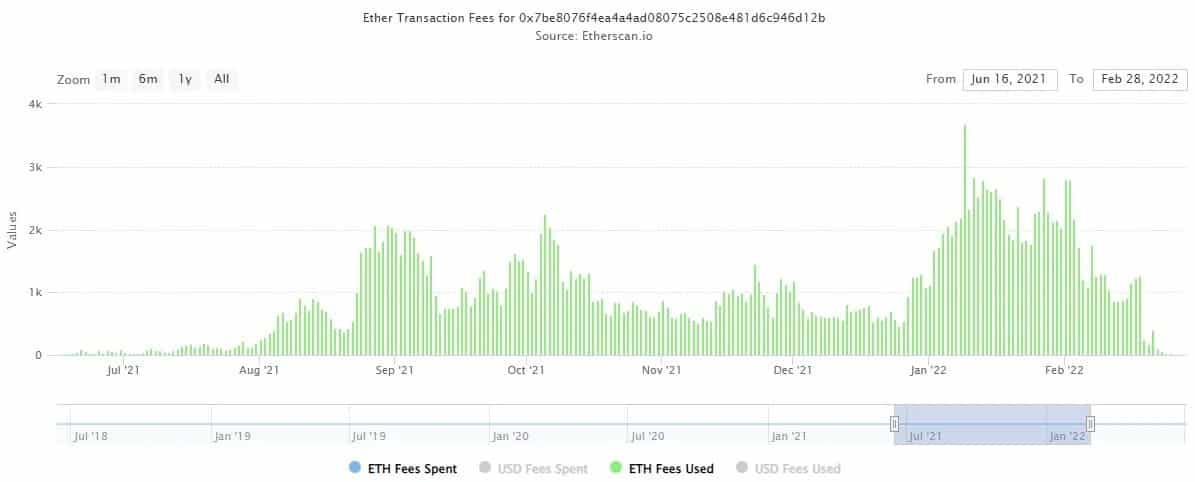
Figure 5: Transaction fees generated by the OpenSea Wyvern V1 protocol
Data from the various smart contracts used by OpenSea therefore corroborates the general decline in activity in the NFT sector.
The behaviour of prices
With the drop in volumes recorded by NFTs, one might think that their prices have collapsed. While the trend is indeed down, it is not comparable to the crypto market as a whole.
For the Bored Ape Yatch Club (BAYC) collection, for example, average selling prices are down 30-35% from a high in late April. This high was due to the arrival of the Otherside metaverse:
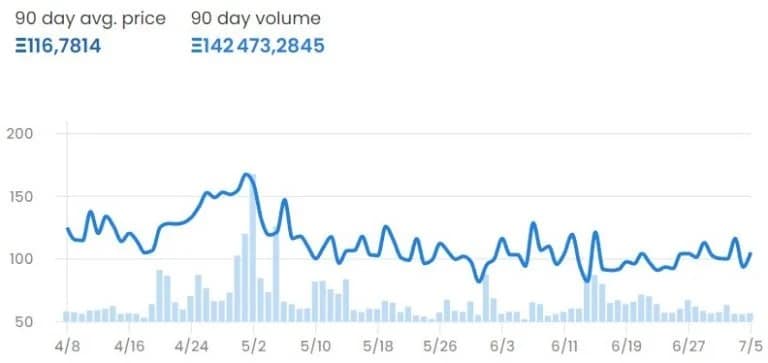
Figure 6: Average selling price of a BAYC NFT in ETH
Overall, lower volumes will lead to lower liquidity. An NFT will then be more difficult to sell, but it will not necessarily be sold for less.
On the other hand, it seems difficult to give a general price trend for this asset class. And for good reason, their value depends directly on the popularity of a project and the community that supports it. In this respect, price behaviour is more disparate than in crypto-currencies, where Bitcoin (BTC) is the trend.
However, there is no doubt that the slowdown in activity is helping to purge the market of non-value added projects.