
Evolving very quietly since the high volatility events of June, BTC is now close to record low profitability levels. A phase of redistribution is taking place as the losses made by long-term investors as their profitability falls pushes them to sell. Onchain analysis of the situation
Bitcoin stumbles near its local floor
Bitcoin (BTC) price bounces near the $19k low bound and appears to be lateralizing, with volatility dropping drastically over the past week.
Having traded very quietly since the high volatility events of June, BTC is now close to historically low levels of profitability, generating investment opportunities with asymmetrical long-term earnings expectations.
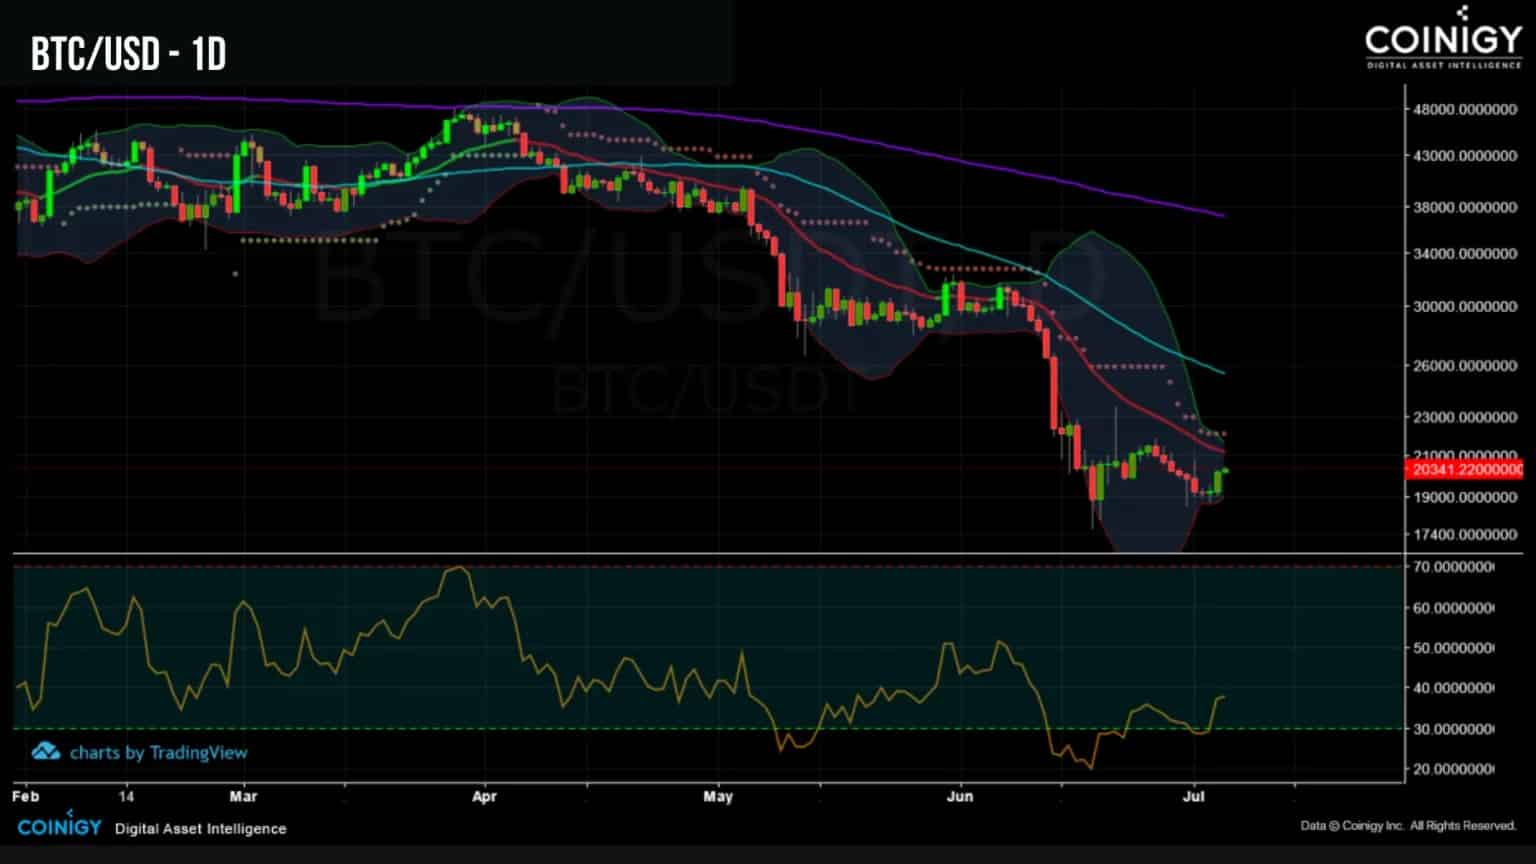
Figure 1: Daily Bitcoin (BTC) price
This week we will be evaluating:
- the overall profitability of the market;
- the spending behaviour of investors in the short and long term;
- the transition of the market into the final redistribution phase.
The whole market plunged into loss
The Bitcoin market is in a state of general loss for the fifth time in its history, as indicated by the BTC realized price metric.
This metric measures the price of BTC at creation of a UTXO and serves as a proxy for the market’s profitability diagnosis. Representing the price paid to purchase a fraction of BTC, this metric symbolises the aggregate cost base of the market.
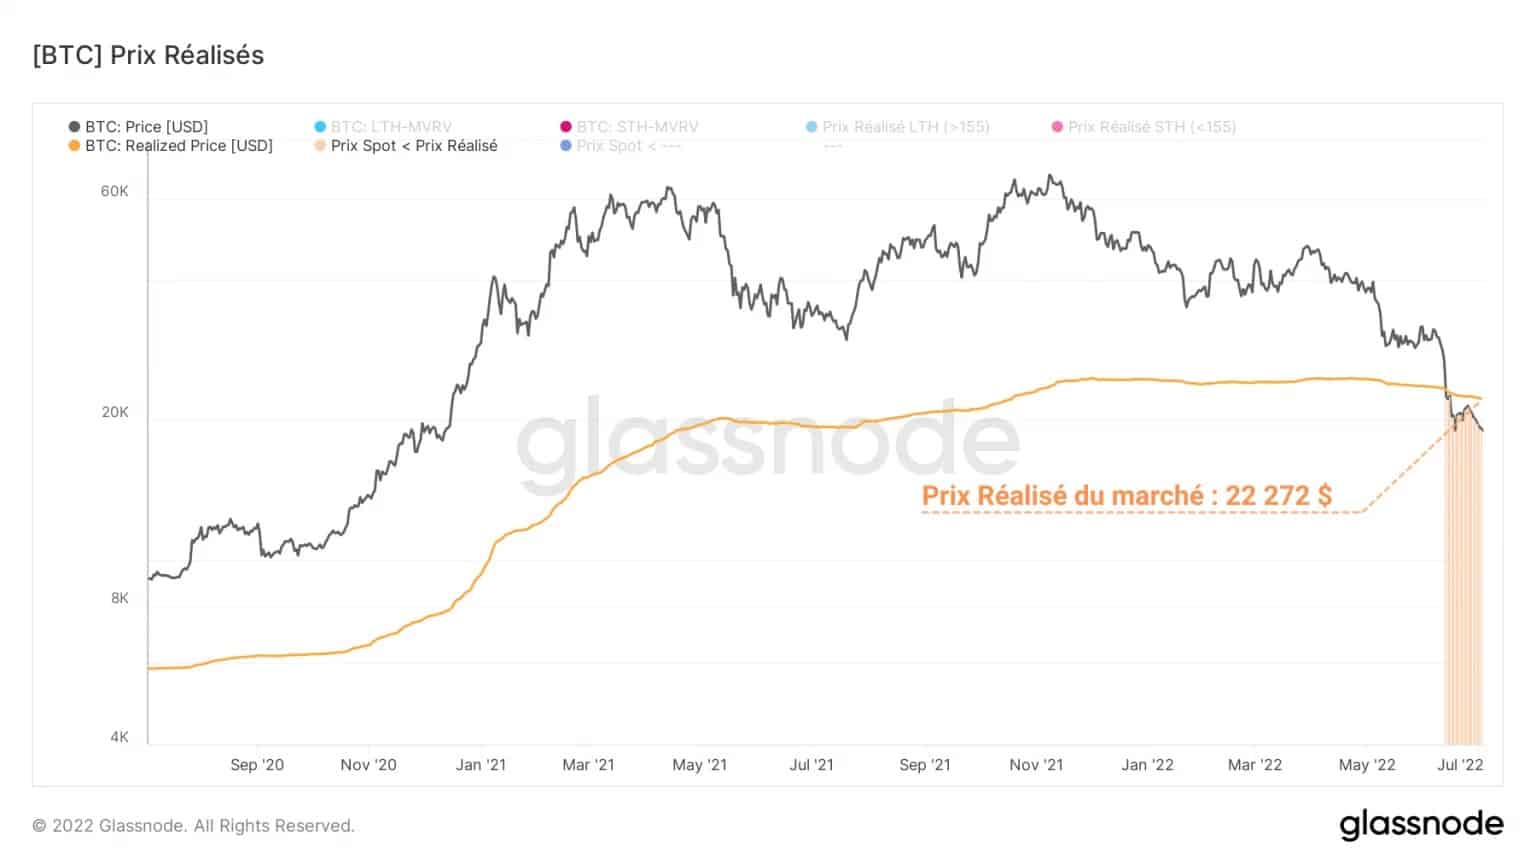
Figure 2: Realised Price
With the spot price currently below the realised price, this indicates that, as a whole, participants have paid more for their satoshis than their current value.
A similar look can be taken at the cohort of short-term investors (STH), holding positions for less than 155 days. Offering a short-term signal of market profitability, the STH cost basis is a powerful directional indicator when interacting with the spot price.
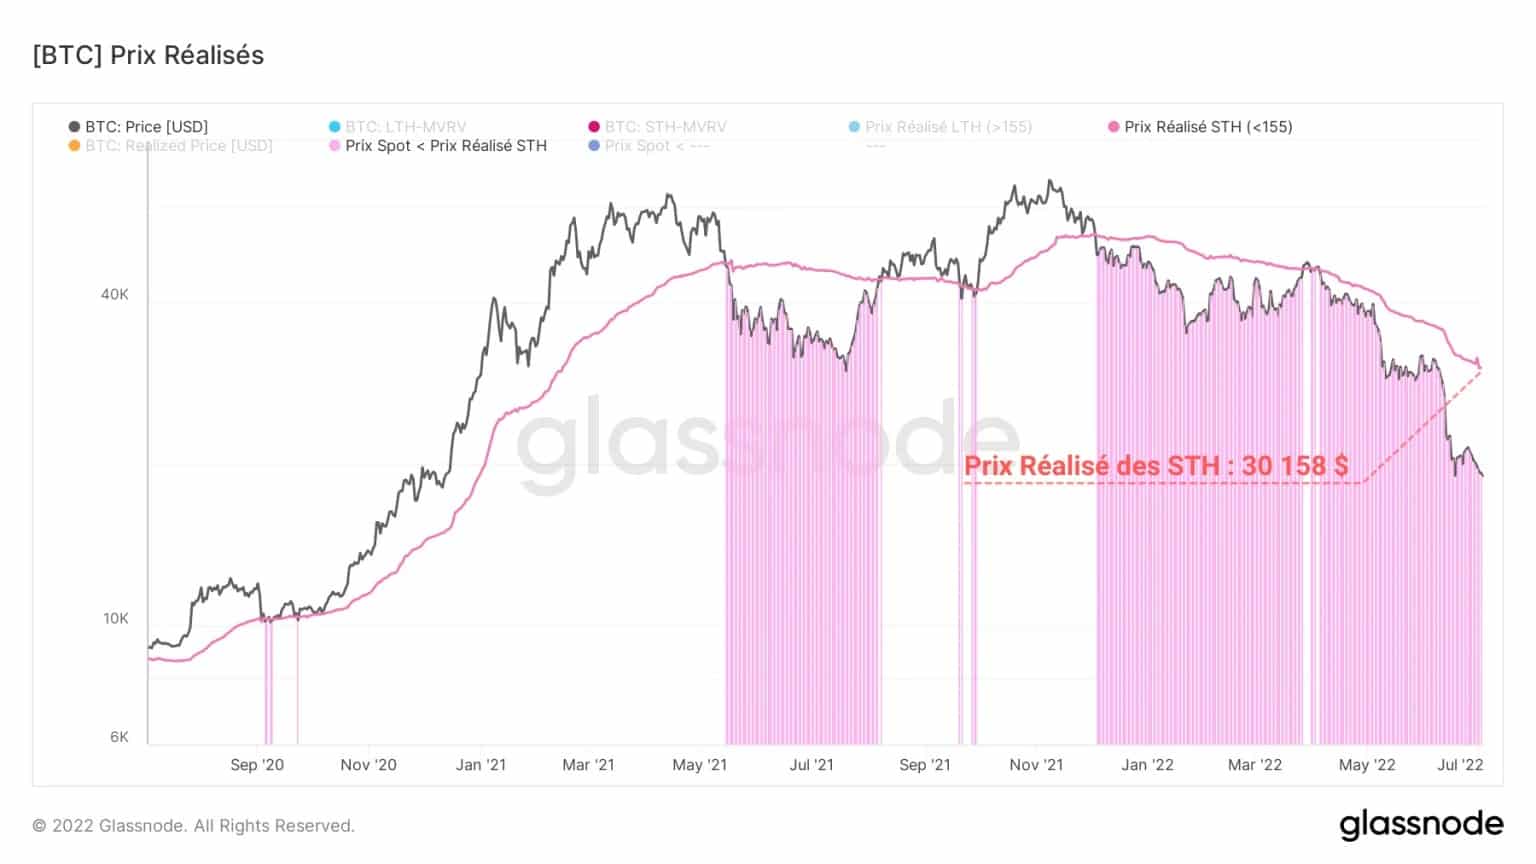
Figure 3: Realised price of short-term investors
Evolving below the market price since the sharp drop in December 2021 (not counting a slight breather at the end of March), this metric tells us that the average STH currently holds a loss position of more than 50%. This condition has made these players assiduous contributors to the selling pressure established over the past 8 months.
Not to be outdone, despite their ability to firmly hold positions ranging from 155 days to several years, is the cohort of long-term investors (LTH).
Indeed, two days after the realised price fell below the spot price, the LTH realised price suffered the same fate, plunging this cohort into a state of latent loss.
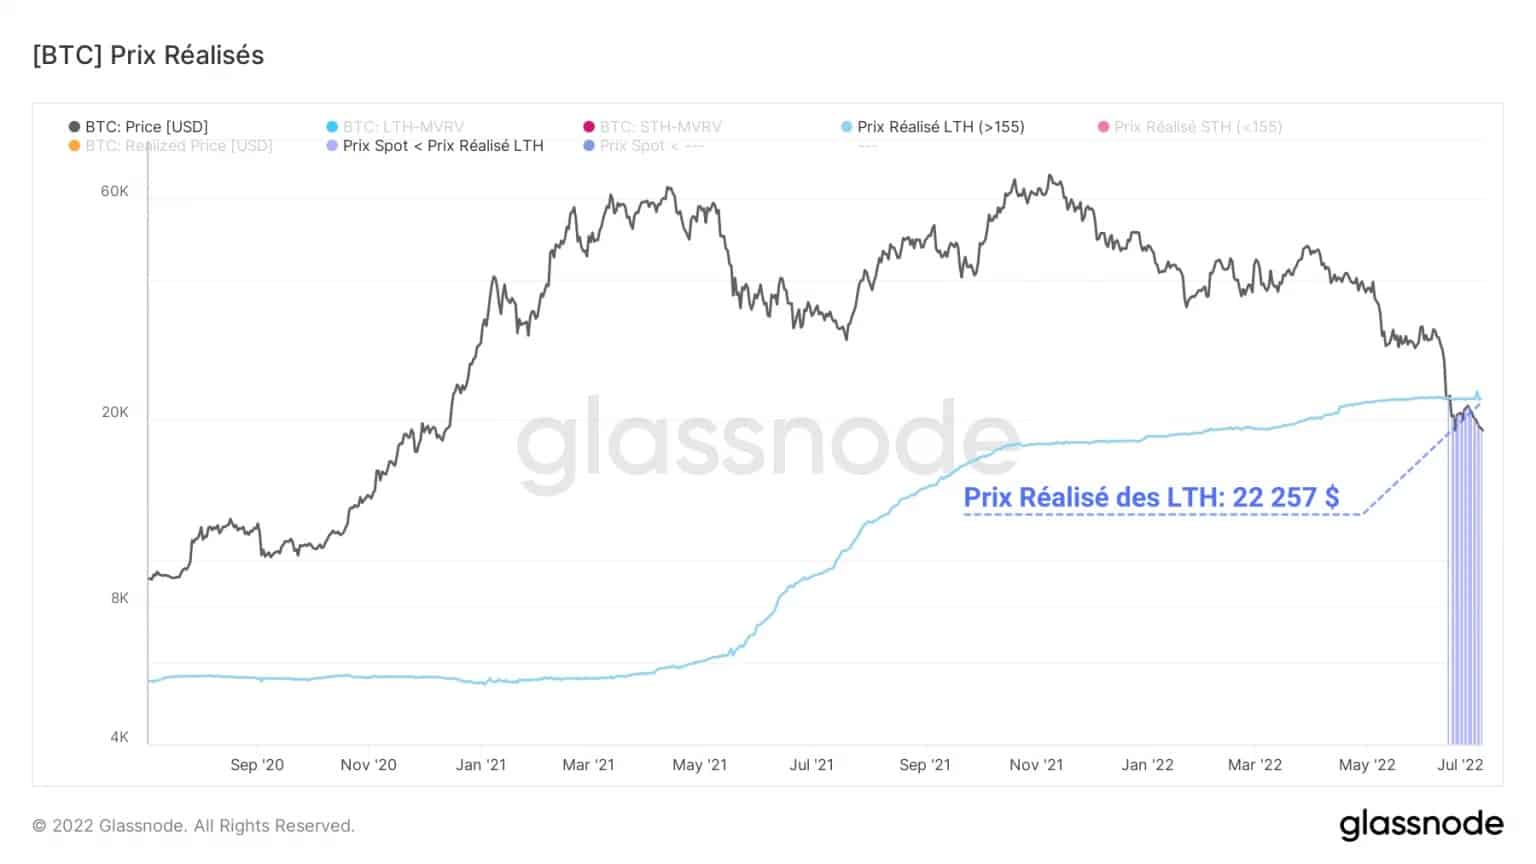
Figure 4: Realised price of long-term investors
To date, the average LTH is down 14% on its positions. This loss of profitability has caused some of the cohort to make losses by selling coins accumulated during the 2020 – 2021 bull run.
Significant realised losses
In response to this loss of overall profitability, coupled with a strained global macroeconomic environment, participants have realised increasing losses since December 2021.
The aSOPR, calculating the ratio between the buying and selling price of a UTXO, measures the aggregate percentage of profit/loss induced by sales.
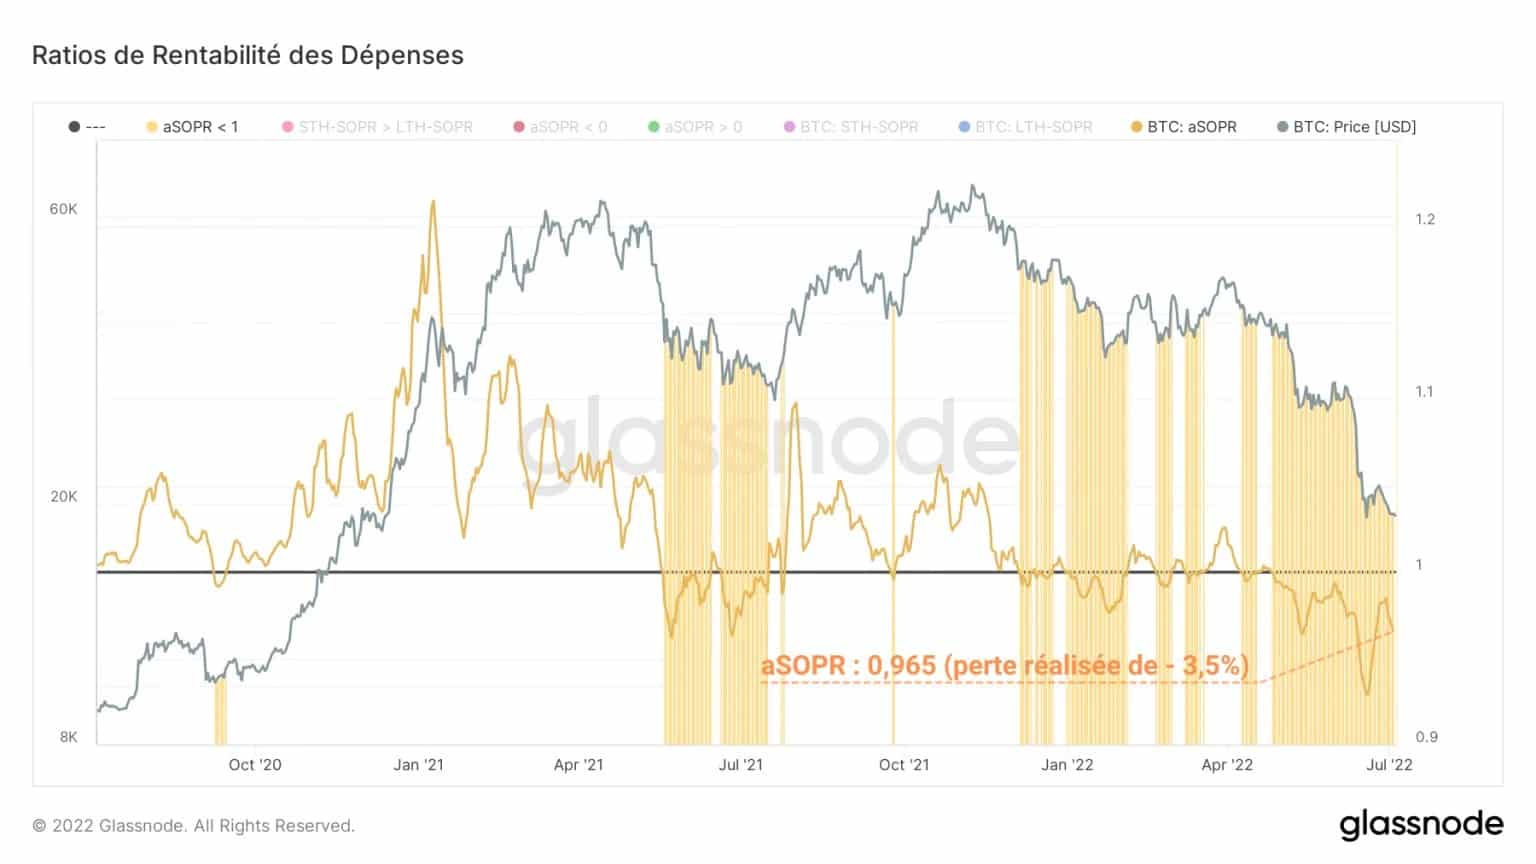
Figure 5: aSOPR
After falling below the neutral zone (aSOPR = 1) for a prolonged period in May and reaching a low of 0.928, the metric now registers a value of 0.965. This signals that the aggregate daily losses realised by the market are in the region of -3.5%.
The long term investor cohort has released powerful losses, typical of the extremes of profitability achieved by this cohort of 155+ day old coins.
Driven by the invalidation of the symbolic $20k level, the losses realised by these entities rose rapidly, reaching a ratio of 0.611.
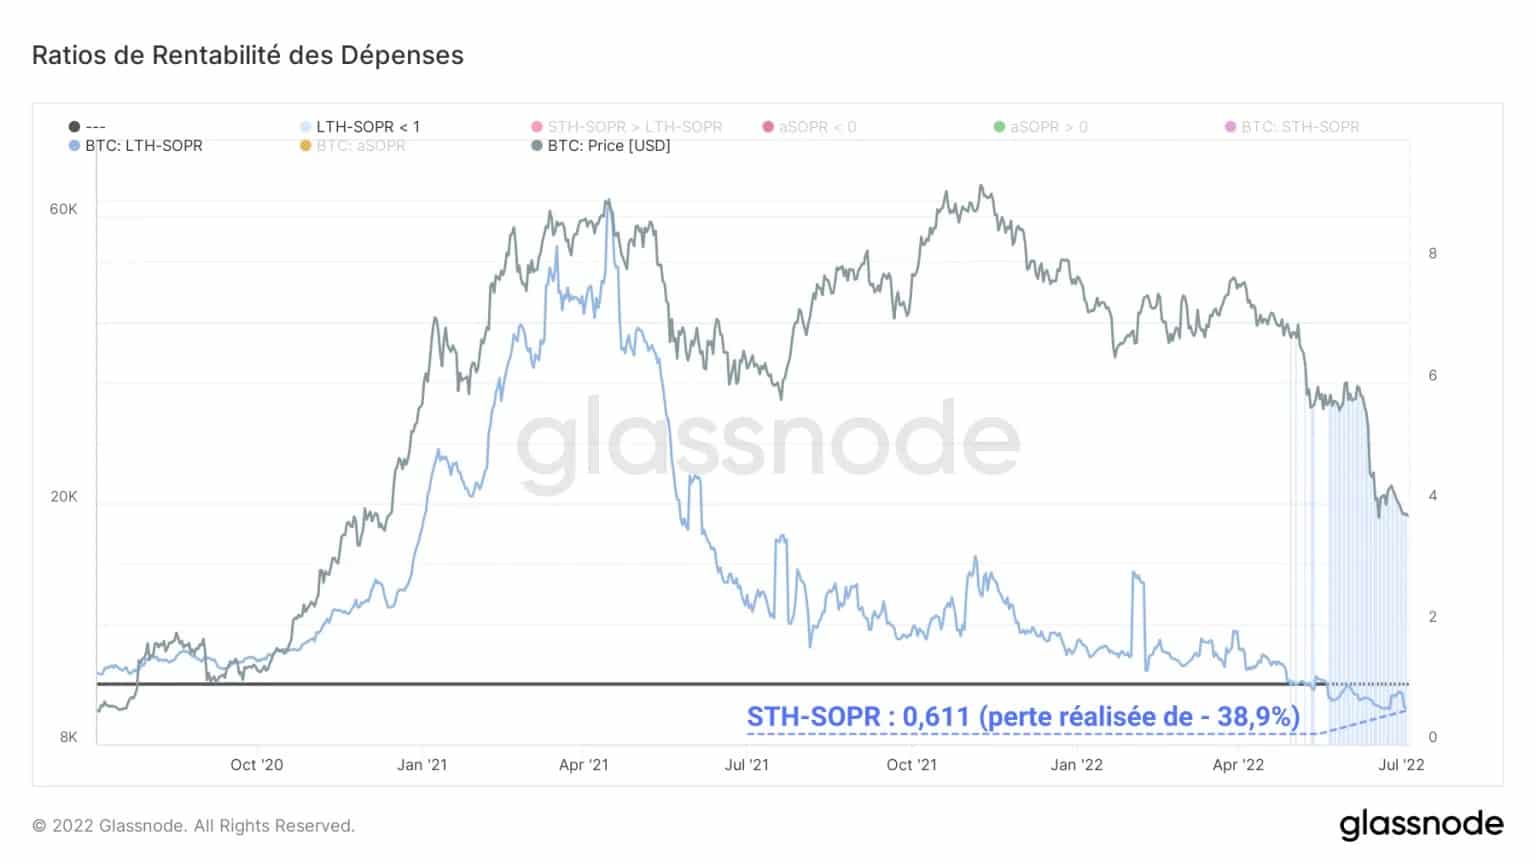
Figure 6: STH-SOPR
This indicates that the average loss realised by a LTH is close to -40% and represents the lowest value of the current bear cycle.
This high level of loss is explained by early BTC purchases from some LTHs at the start of the price drop in November-December, now redistributed in pain.
Historical redistribution zones
An asymmetry in the magnitude of loss taking between STHs and LTHs during bear markets identifies periods when LTHs make more painful losses than their short term counterparts.
These periods (red) mark the beginning of large-scale redistribution phases of outstanding supply, unfolding as investors give in to selling pressure.
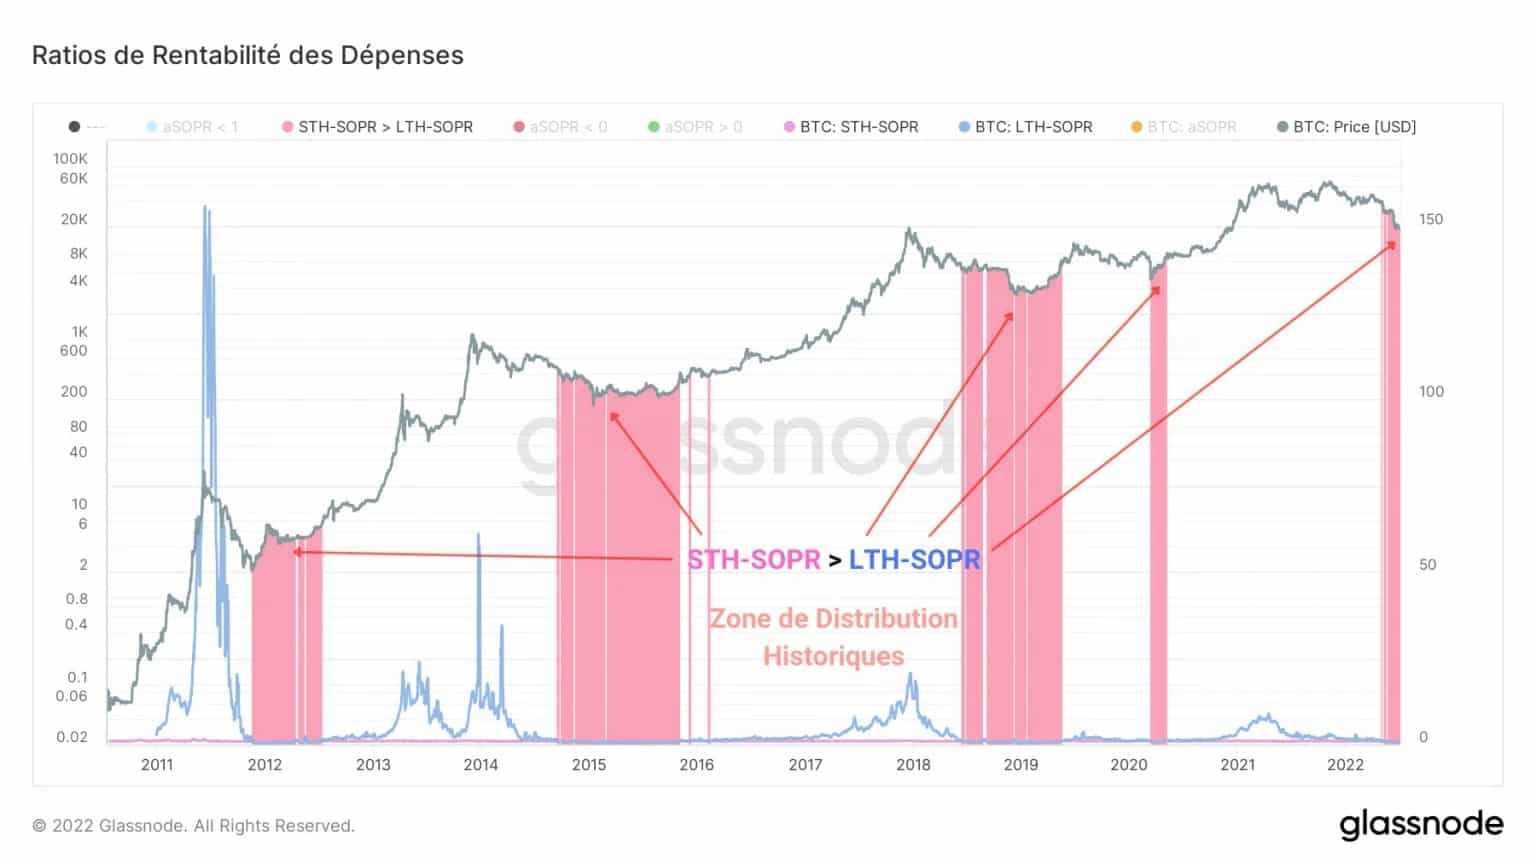
Figure 7: Areas of capital redistribution in bear markets
These moments preceded the darkest hours of the 2015 -16 and 2018 – 2019 bear markets and signaled attractive long-term accumulation areas.
In the current bear cycle, this period occurred as early as the beginning of May and preceded a price drop of over 50%.
Summary of this onchain analysis
In sum, this week’s data confirms the entry of this bearish cycle into the final redistribution phase.
The entire market, as well as the cohorts of short and long term investors are in a state of considerable latent loss on their positions.
This loss of profitability leads to increased selling pressure, which causes participants to realise substantial losses, selling their offer to the most resilient investors.
This phase of redistribution takes hold as the losses realised by LTHs are qualitatively stronger than those of STHs and signals a generational buying opportunity.