
The use and issuance of the cryptocurrency Ether used by the Ethereum network ecosystem make this crypto a particularly unique case. Today, we analyse the distribution and evolution of ETH supply before and after the Merge in order to answer a crucial question: how many Ethers (ETH) are available for purchase?
ETHER (ETH) at the crossroads
While the eyes of investors are on BTC and its reaction to the $30,000 level, the ETH price is forming a similar long-term trend reversal pattern.
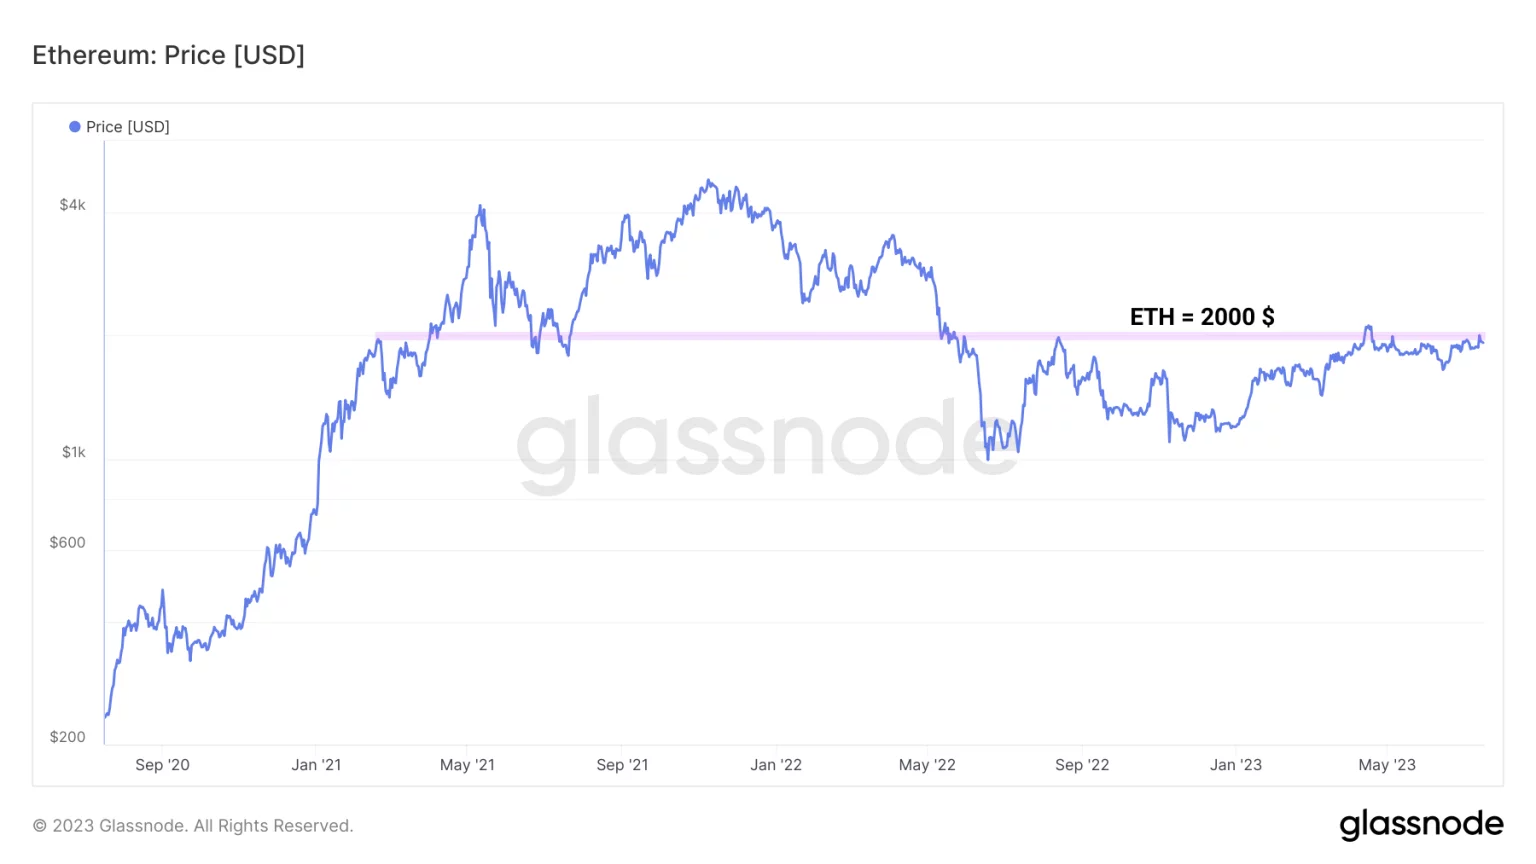
Figure 1: ETH daily price
The dynamics of issuing new ethers (ETH) and its use within Ethereum make this cryptocurrency unique.
As the ETH price looks set to break through the symbolic $2,000 level, we analyse the distribution of ETH supply and its post-merge dynamics in order to answer a crucial question: how many ETH are available to buy?
Distribution of ETH supply
Following the Merge, the distribution of ETH supply has changed significantly, with a large transfer of ETH leaving exchanges and smart contracts to be staked within the Ethereum network’s Proof of Stake (PoS) consensus algorithm.
Currently, the supply of ETH in circulation is distributed as follows:
- Exchanges: 15,117,742 ETH (12.7%)
- Smart Contracts: 36,712,057 ETH (30.9%)
- Staking: 26,716,238 ETH (22.3%)
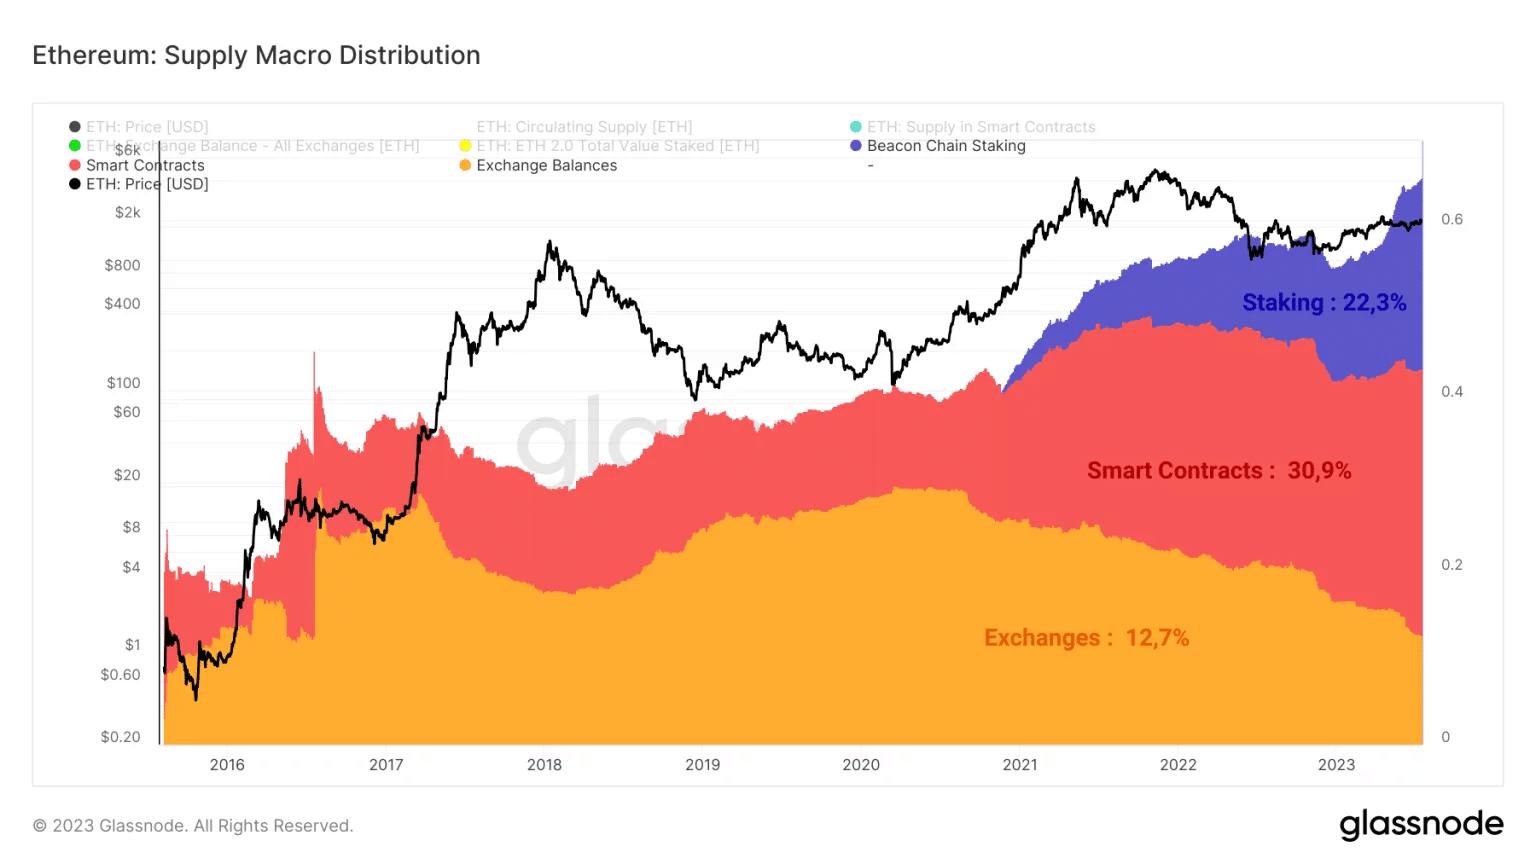
Figure 2: Breakdown of ETH supply
The remainder of the supply (41,260,356 ETH, or 34.1%) is mainly held on ETH addresses with no defined use.
This distribution indicates that more than half of the ETH in circulation (Smart Contracts + Staking) are currently being used within the decentralised economy of the Ethereum network, which is a remarkable usage rate.
In addition, we are seeing long-term growth in the supply of ETH used within the various smart contracts that comprise DeFi, loan markets, GameFi and NFTs.
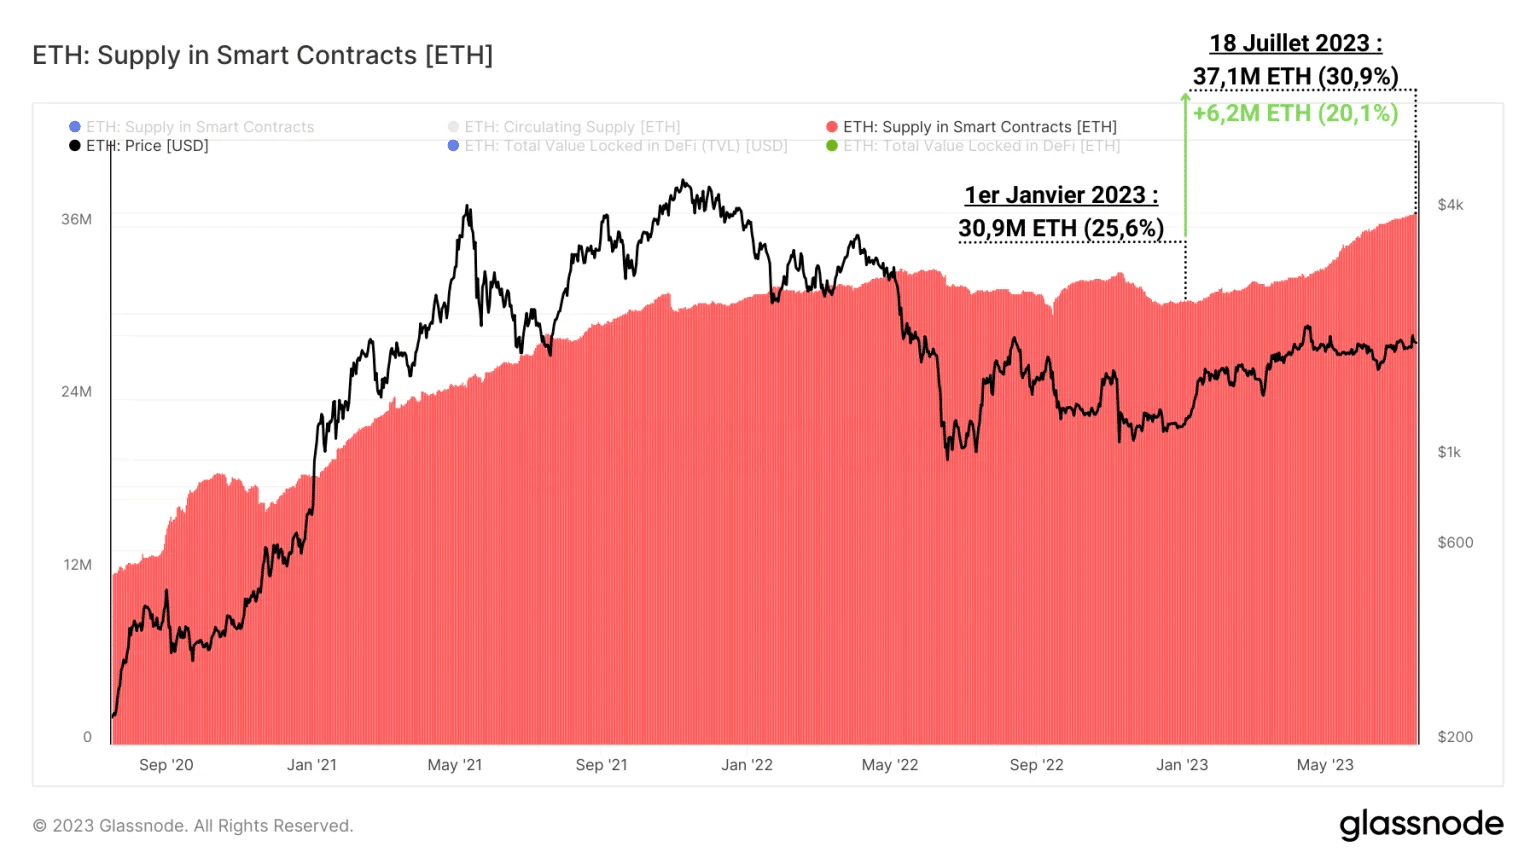
Figure 3: ETH supply in Smart Contracts
Overall, this measure increases during ETH bull markets as users and investors reduce their risk aversion and send ETH to decentralised protocols offering innovation and attractive returns.
The opposite occurs during bear markets, when participants leave smart contracts for:
- limit the risk of liquidations linked to the high volatility of altcoins;
- Pass their capital into stablecoins;
- sell ETH.
What’s more, we’ve seen a significant influx of ETH since the start of 2023, with a 20% increase and a total of over 37 million ETH in smart contracts.
Post-merge dynamics of ETH supply
Concerning the dynamics of ETH issuance, we can now separate the period 2021 – 2023 into three distinct periods.
- The Proof of Work period (Pre EIP-1599 ), with an inflation rate close to +4.5%;
- The Proof of Work + Burn period (August 2021 – Sept 2022), with an inflation rate of between +3.4% and +1.4%;
- The Proof of Stake + Burn period (Post Merge), with an inflation rate between +0.3% and -8.4%.
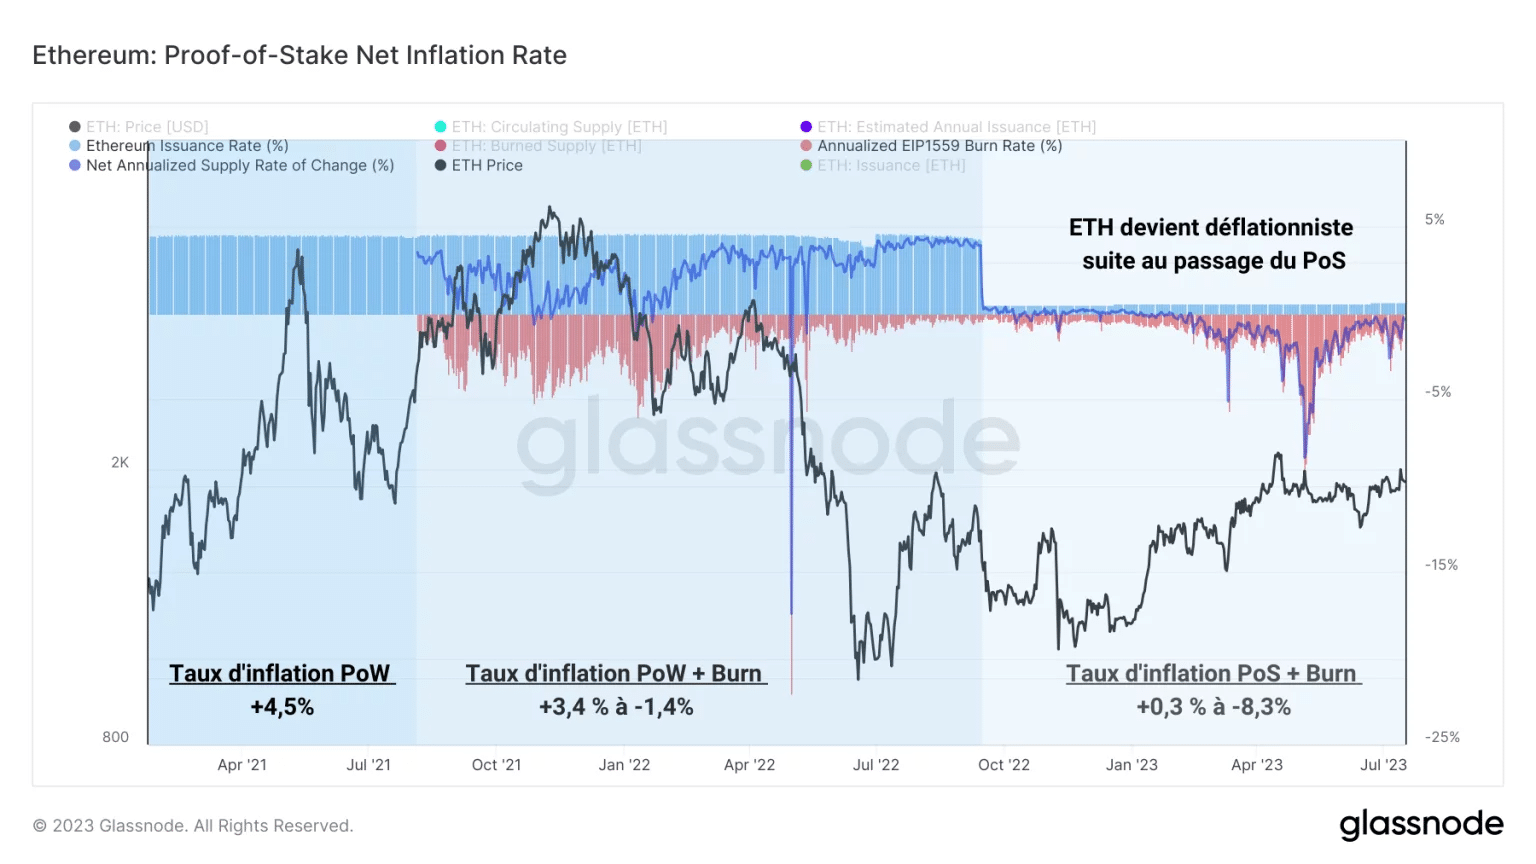
Figure 4: ETH inflation rate
The change in the ETH inflation rate between 2021 and 2023 indicates that, following the switch from the PoW to the PoS, the ETH’s monetary dynamics have become deflationary.
Apart from the fact that this is a feat of computer engineering, the main effect of this change in monetary policy is to make it possible to reduce the supply of ether in circulation.
Measuring the net change in supply in circulation (issuance – burn) since the Merge in September 2022, it appears that this measure is tending to reduce the supply of ETH.
For nearly 766,000 ETH issued, more than 1.3 million ETH were burnt, resulting in a net drop of more than 600,000 ETH in supply in circulation.
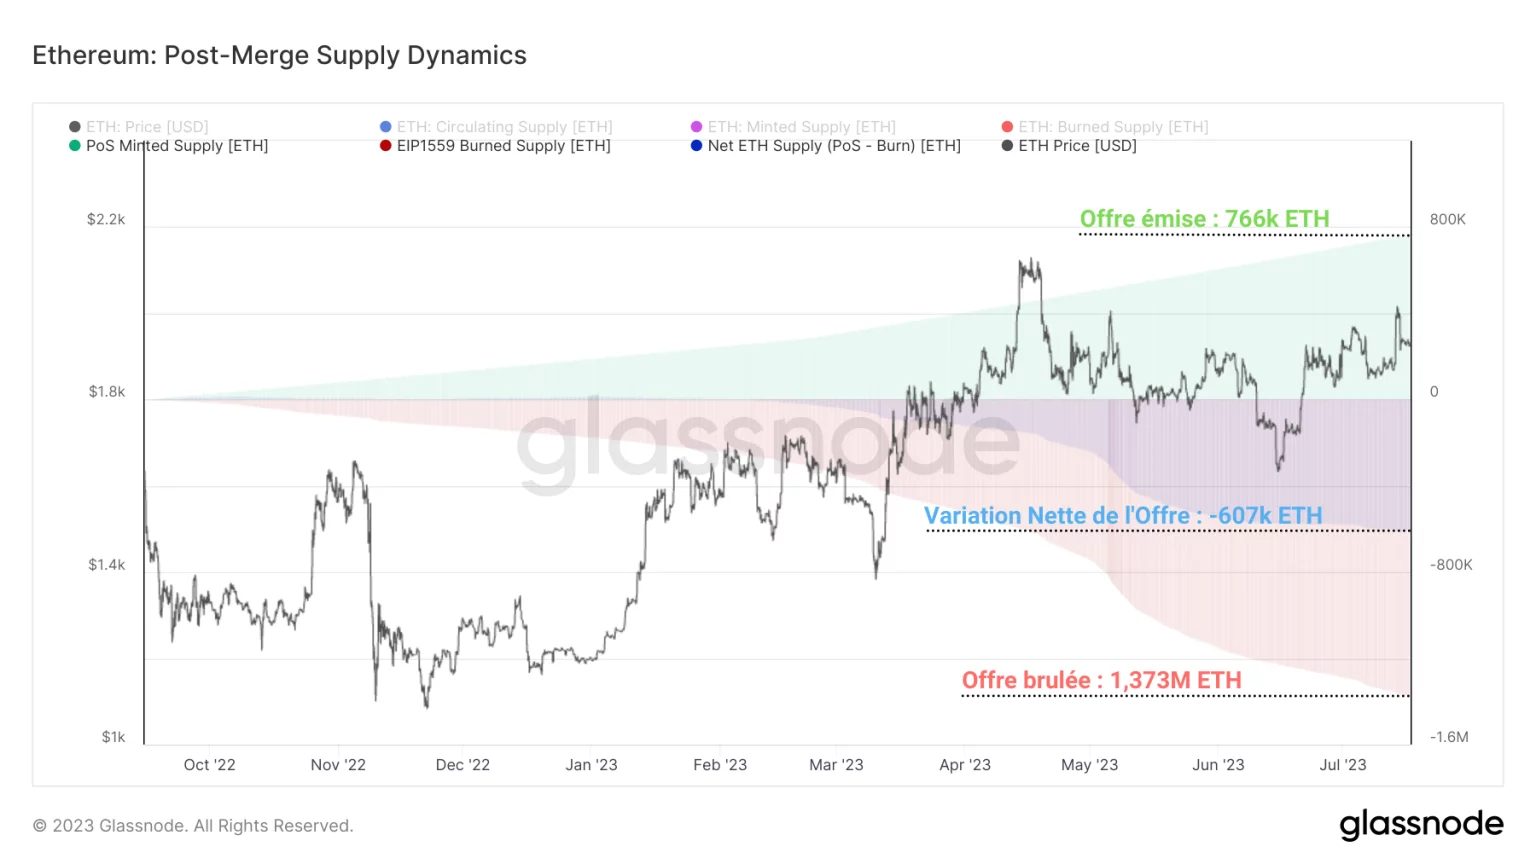
Figure 5: Net change in ETH supply
The ETH burn rate, ensured by EIP-1559, clearly leads to a fall in ETH supply, which is seen as a very positive fact by some ETH investors.
Based on the laws of supply and demand, they theorise that a reduction in supply within a context of rising demand causes a supply shock, pushing up ETH prices exponentially.
That said, while a 600,000 ETH reduction in supply in just 11 months may seem significant, it needs to be put into a wider context.
If we compare this reduction to the total supply in circulation, it only represents a slight – 0.51% decline in ETH supply.
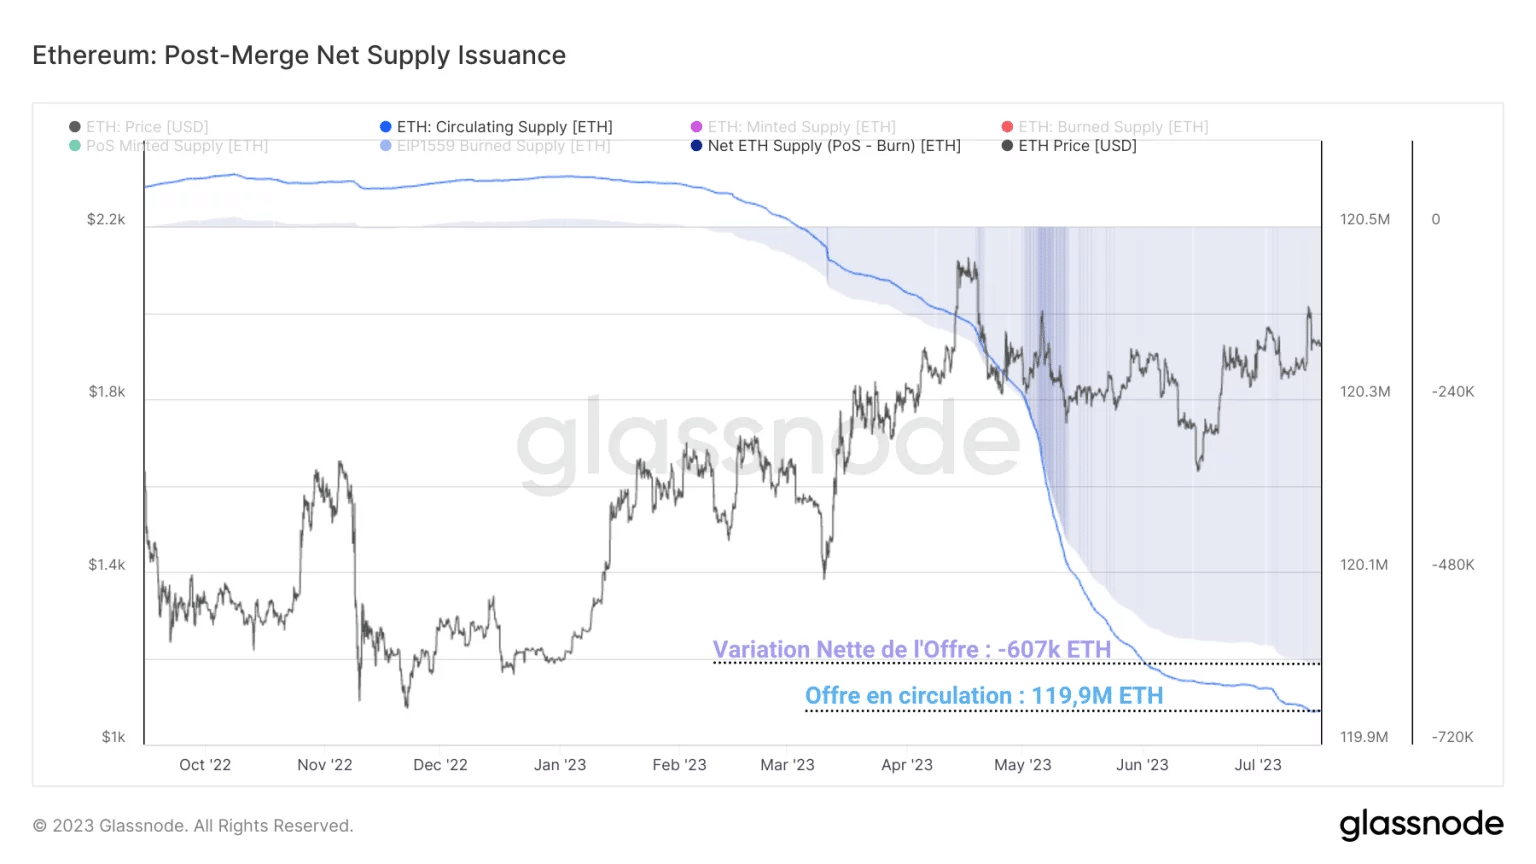
Figure 6: Net change in ETH supply (as a percentage of total supply)
Although this value may be a very strong signal for some, it remains quite negligible compared with the ETH supply that is still available.
To date, it seems difficult to say that the ongoing deflation of Ether will have a palpable effect on prices.
However, the change in monetary issuance brought about by the Merge and EIP-1559 is still recent, and the dynamics of ETH supply will need to be monitored over the long term in order to study the potential effects of this innovation.
Finally, if the deflationary behaviour of supply is still negligible, then it is relatively simple to answer our question: how many ETH are available for purchase?
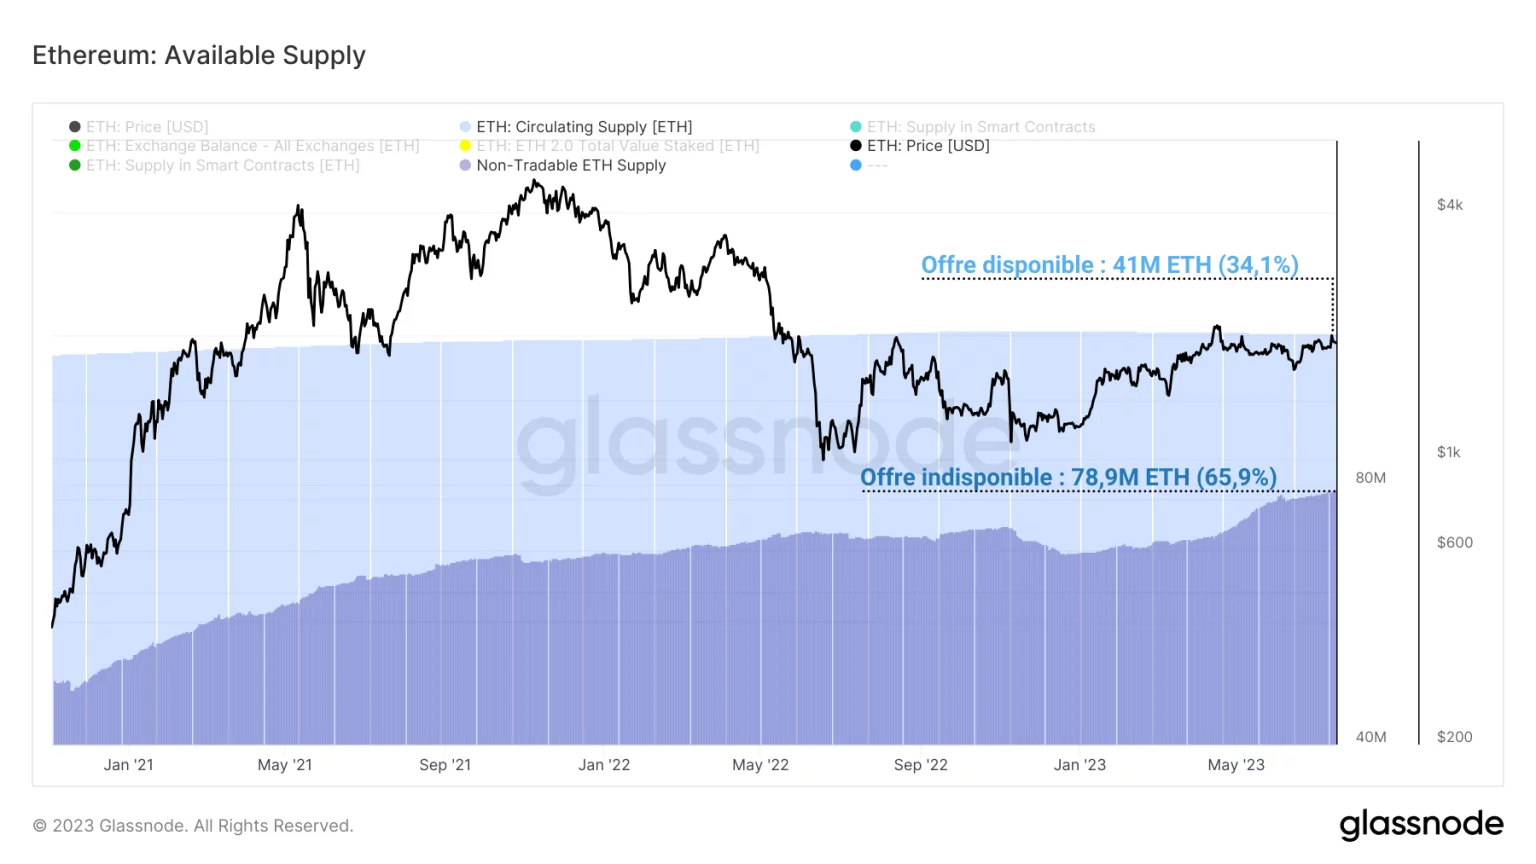
Figure 7: ETH supply available for purchase
Separating the ETH immobilised by staking and those used in smart contracts, it seems that the ETH potentially available for purchase are those stored on exchanges and those with no defined use.
Only 56 million ETH (46.9%) are sufficiently liquid to be traded by potential investors.
It should be noted, however, that these figures are given for information purposes only, as they can vary very quickly depending on the context (e.g. the number of ETH in smart contracts, which can fall rapidly).
Summary of this on-chain analysis of Ethereum
The distribution of Ether supply indicates that more than half of the ETH in circulation (Smart Contracts + Staking) are currently being used within the decentralised economy of the Ethereum network, which is a remarkable usage rate.
The reduction in supply in circulation caused by the deflationary dynamics of ETH represents only a slight decline of -0.51% in ETH supply, which is negligible, and it seems difficult to assert that the ongoing deflation of ETH can have a palpable effect on prices.
Finally, it seems that the ETH that are sufficiently liquid to be traded by potential investors are those stored on exchanges and those that have no defined use, which represent nearly 56 million ETH, or 46.9% of the supply in circulation.