
Fundamental pressure on the crypto market is back near its peak with the ecosystem-specific Silvergate affair combined with macroeconomic fundamentals also at their peak in terms of stress. As for the technical situation, the bitcoin price is now close to the medium-term tipping point.
Fundamental pressure reaches its maximum level on Bitcoin
Weeks have been going by and looking the same for the crypto market since mid-February, with a gradual fading of the bullish rally in place since the beginning of the year as bearish fundamentals combine.
The market is doing its best to absorb the daily blows, whether they come directly from the ecosystem with the Silvergate affair or are rooted in the general economic framework and conventional market finance.
It all started three weeks ago with updated inflation data for the US and Europe. Inflation rebounded for the month of January and has overstretched monetary policy expectations. If we take the case of the first of these, the US Federal Reserve (FED), the market is now projecting a Terminal rate of 5.75% with a postponement of the pivot (starting point of a downward interest rate trend) to the beginning of 2024.
Of course, all these expectations are reviewed regularly and the next US inflation report (next Tuesday) could provide some breathing space if the inflation rate were to surprise us by resuming its decline.
Finally, market bond rates continue to rise. In particular, the cost of money in the short term, which is making new multi-year records and is back to its highest level in 2007, i.e. before the subprime crisis.
Macroeconomic indicators are therefore in bright red, as illustrated by the extreme inversion of the US yield curve this week, a highly relevant barometer of the likelihood of a recession this year.
Short term interest rates are indeed well above the long end of the yield curve, let’s face it, without a rapid decline in inflation coming in the next few weeks, the global-macro framework will not allow BTC to overcome any technical resistance.
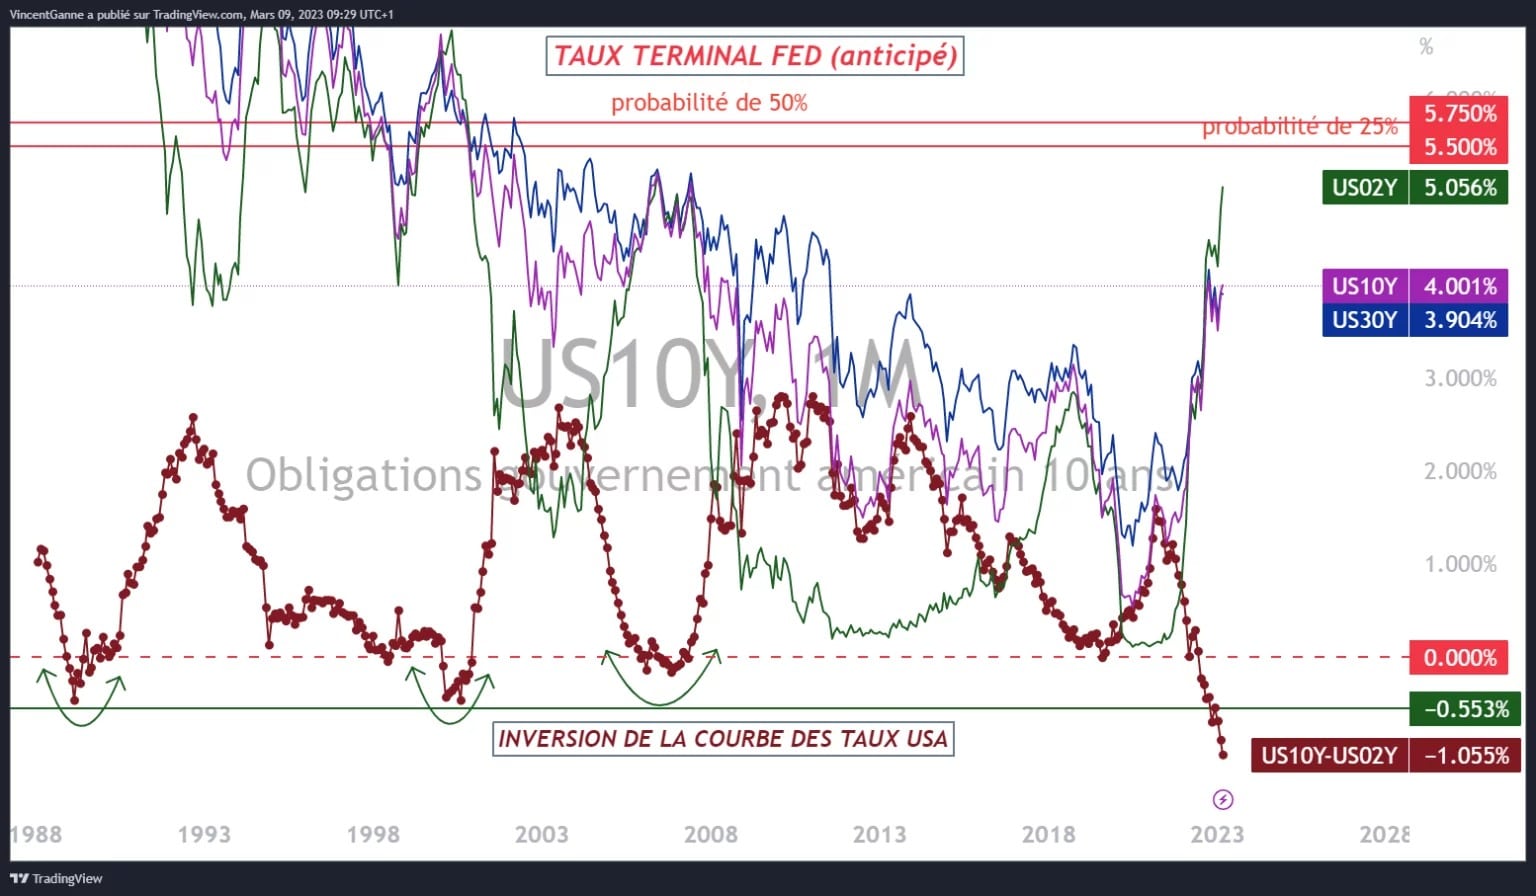
Chart that reveals the following information: US bond interest rates, the expected Terminal Rate for the US Federal Reserve (FED) and the inversion of the US yield curve.
Bitcoin on the border between bull and bear market
Let’s get back to technical considerations for BTC which is undergoing a slow slide after failing to touch the extreme technical resistance of $25,200 (remember my famous chartist “lead cover”).
The bitcoin price is now close to the medium-term chartist swing zone, i.e. the one that will order the trend for the next 4-8 weeks. This graphic border between the world of bullish recovery and the return of the bear market is again defined by the $19,800/$21,200 price zone, with the “eternal ex-ATH” still not far away to make a statement.
The market will make its choice between the time you read this and the end of next week.
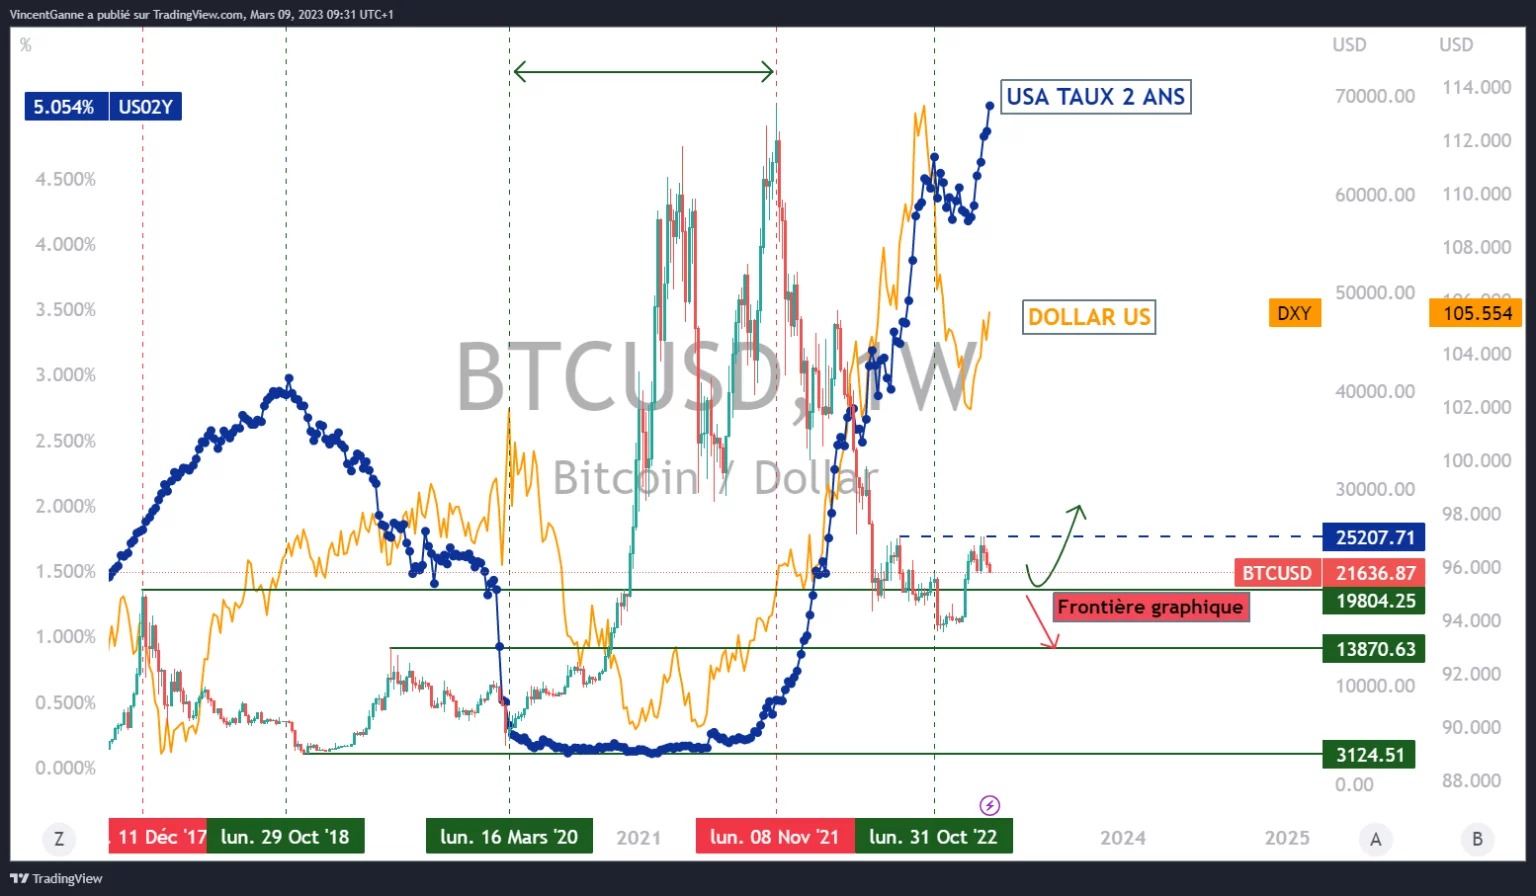
Chart that exposes the weekly Japanese candles of the bitcoin price with an arithmetic price scale