
As it breaks out of the range established at the beginning of the year, the price of Bitcoin (BTC) is showing encouraging signs of reversal. However, isn’t it too early to declare victory and consider this rise 100% reliable and sustainable? The current market structure seems to indicate that not all the ingredients for a smooth reversal are present. On-chain analysis of the situation
Bitcoin takes a breath of fresh air
The price of Bitcoin (BTC) is showing encouraging signs of a trend reversal. Following a sixth successful test, BTC is breaking through the $44,500 resistance and heading towards the next key level: the $50,000 level.
After more than two months of consolidation, the market appears to be resuming an uptrend. It remains to be seen whether the current market structure favours this bias and whether participants are willing to realize their gains within a potential uptrend.
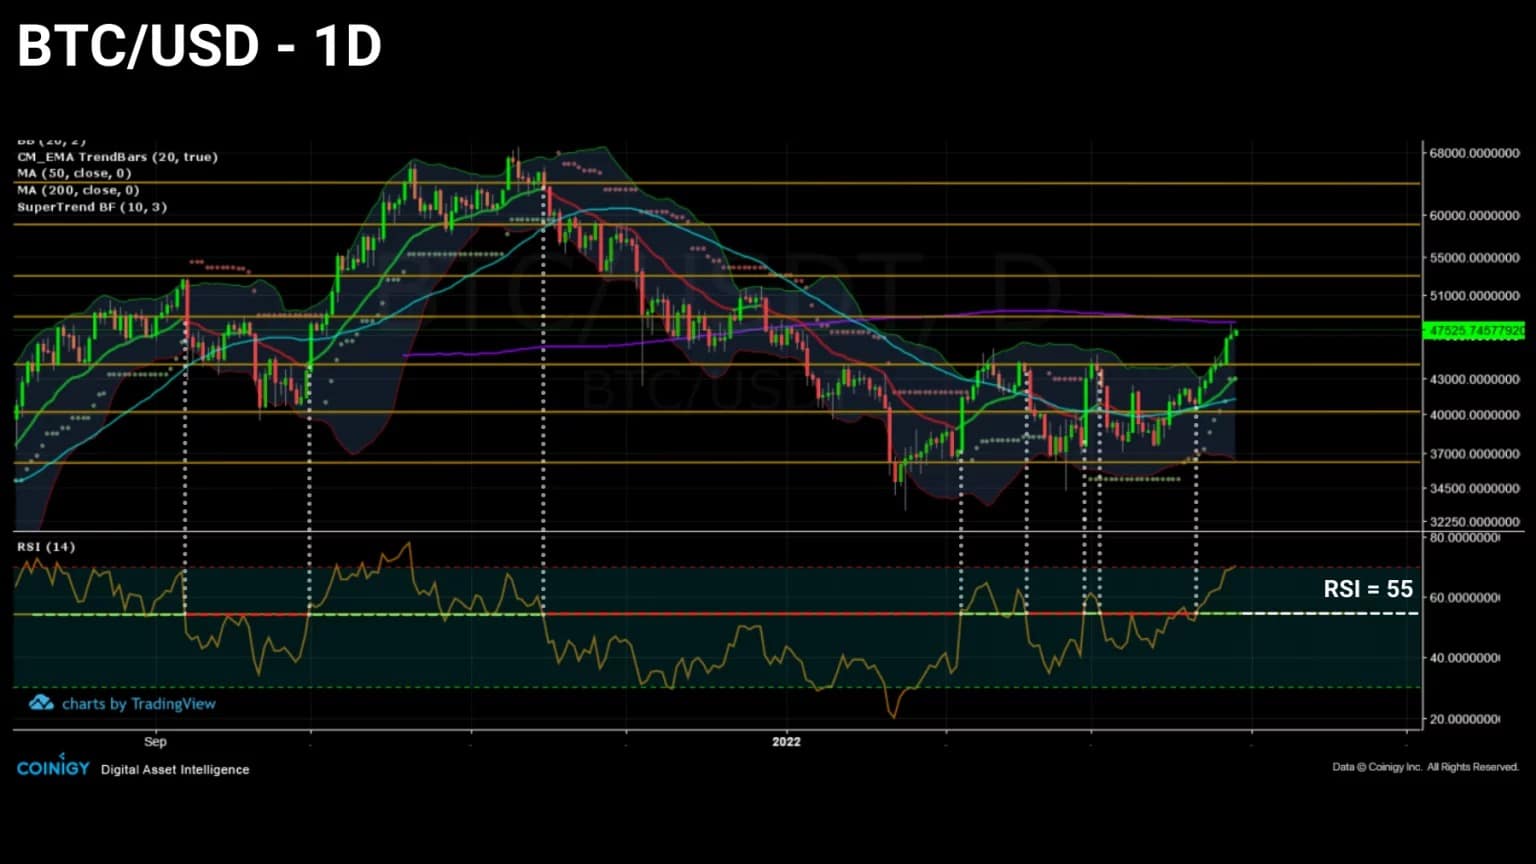
Figure 1: Daily Bitcoin (BTC) price
This week, we’ll be looking at the market from three different angles to see if the conditions are there for a sustainable rally to resume:
- The destruction of Token Days (TDs). By studying the spending or saving behaviour of BTC maturing on the blockchain, we will gain insight into the commitment of long-term investors (LTH).
- LTH positioning. Observing the buying/selling behaviour of long-term investors and their profitability level allows us to gauge the probability of a bullish distribution phase occurring.
- Derivative market bias. Analysing the evolution of risk-taking and the fluctuations of capital allocated to financial derivatives informs us about the psychological bias of speculators and the durability of the trend in the making.
Insufficient rejuvenation of BTC
In order to identify a viable uptrend, observing the destruction rate of Token Days (TDs) provides us with important information.
Indeed, it is common to observe the formation of peaks in the destruction of increasing JJs during strong bullish phases, while bearish phases are characterised by weak episodes of destruction, except during capitulations of large amplitudes.
Before going any further, let’s quickly recall how the JJ creation / destruction process works. Token days are a measure of bitcoin’s economic activity, giving importance to BTCs in proportion to their state of dormancy and maturation.
Every 24 hours, a dormant UTxO will accumulate a “token day”. When it is finally spent, its accumulated JJ count is reset to zero, or “destroyed”.
Thus, the number of JJs destroyed in a given period is a function of the number of tokens spent multiplied by the life of those coins:
- One UTXO of 2 BTC inactive for 100 days accumulates 200 JJ ;
- A UTXO of 0.5 BTC inactive for 100 days accumulates 50 D;
One UTXO of 10 BTC inactive for 6 hours (0.25 days) carries 2.5 DD.
The graph below represents the JJs destroyed by not taking into account transfers between addresses of the same entity, so as not to interpret an internal transfer as a potential sale.
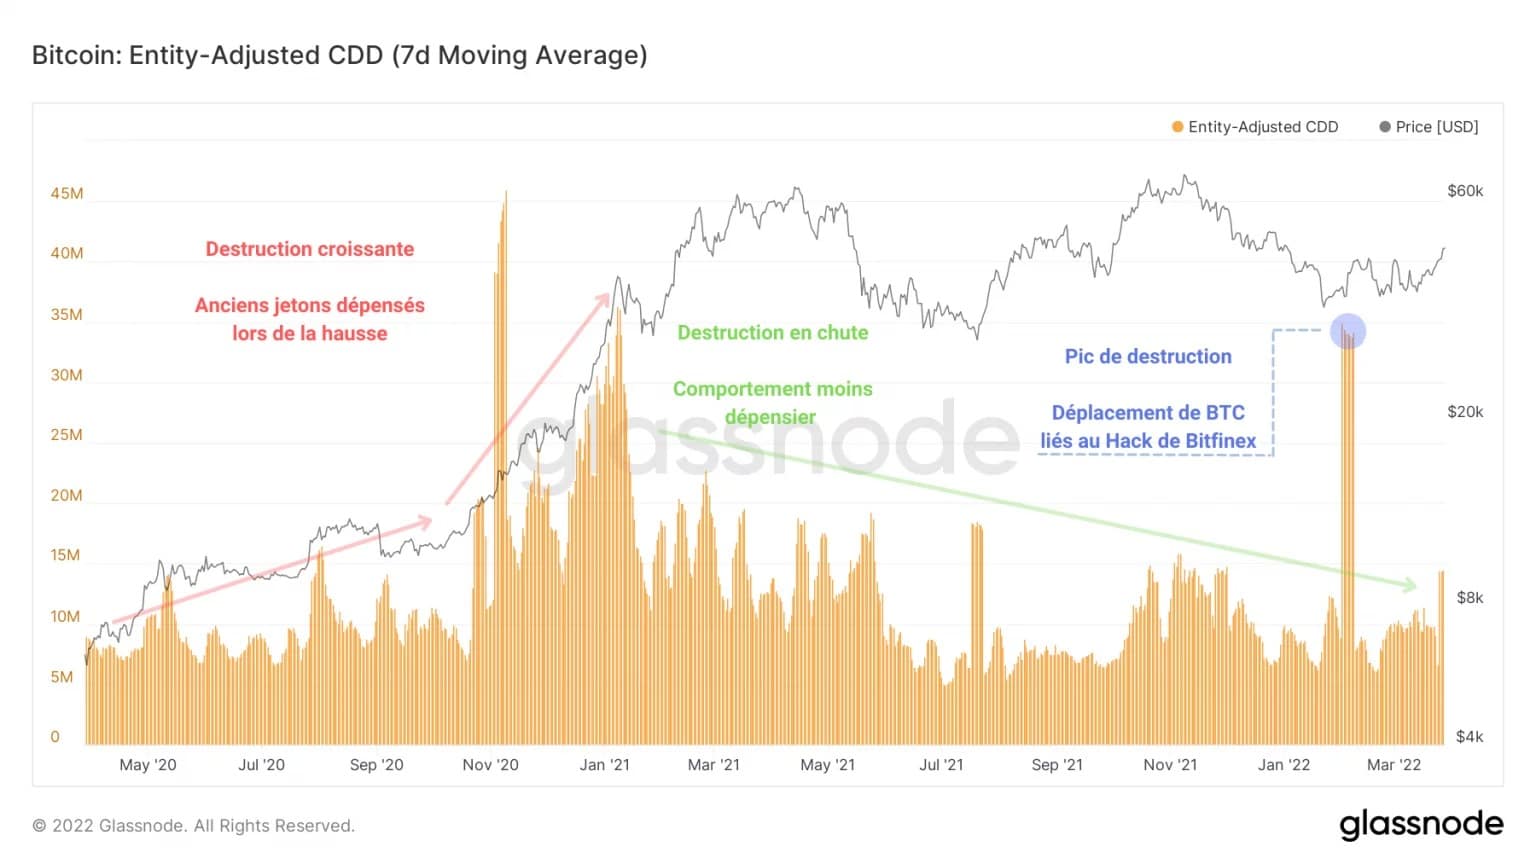
Figure 2: Destroyed tokens
We can then distinguish two trends: an increase in destroyed JJs in 2020 and early 2021, followed by a continuous decrease in the destroyed JJ count, from February 2021 until today.
These two opposing behaviours are indicative of two complementary paradigms: spending or profit-taking (red) during booms and saving, accumulating and – in rare cases – taking losses (green) during corrections.
As it stands, no significant destruction spike has occurred, indicating that seasoned investors, accumulating BTC in anticipation of a powerful rally, have not yet begun their bullish distribution process.
The destruction spike on 1 February 2022 was triggered by the movement of funds from the Bitfinex hack in 2017 and, while it shows the effectiveness of on-chain analysis in terms of heuristics, cannot be associated with observable market participant behaviour.
This second chart groups spent BTC into different degrees according to their age and represents them by coloured bands as a proportion of total chips moved. In short, it measures the level of age of spending and its share of the total spending volume.
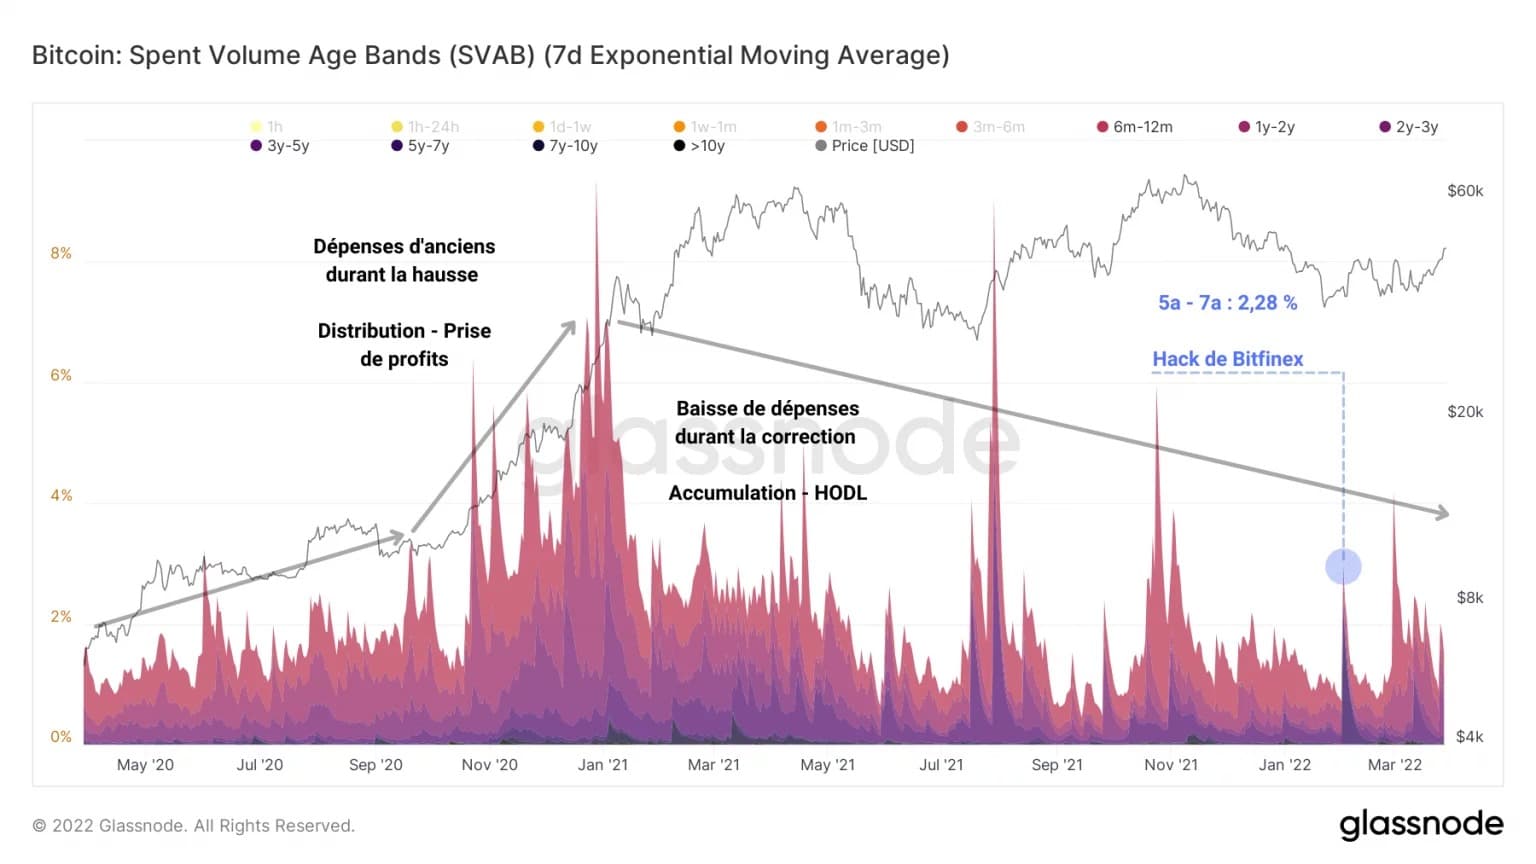
Figure 3: Age band of spending volume
We can see a similarity with the previous chart: both in terms of quantity and volume, the spending of old BTC is slowing down and does not show any signs of turning around.
This observation allows us to go further and state that the correction, from November 2021 to March 2022, will have allowed the number of mature BTC to fall, but also that this period has given rise to a very strong accumulation.
Indeed, liveliness, a measure of the rejuvenation and maturation of BTC, indicates a clear dominance of maturation during this period as it did during the correction following the May capitulation.
Liveliness is calculated as the ratio of cumulative JJs destroyed to the cumulative sum of all JJs ever accumulated by the network and provides insight into changes in HODLing’s behaviour, helping to identify accumulation or distribution patterns of long-term investors.
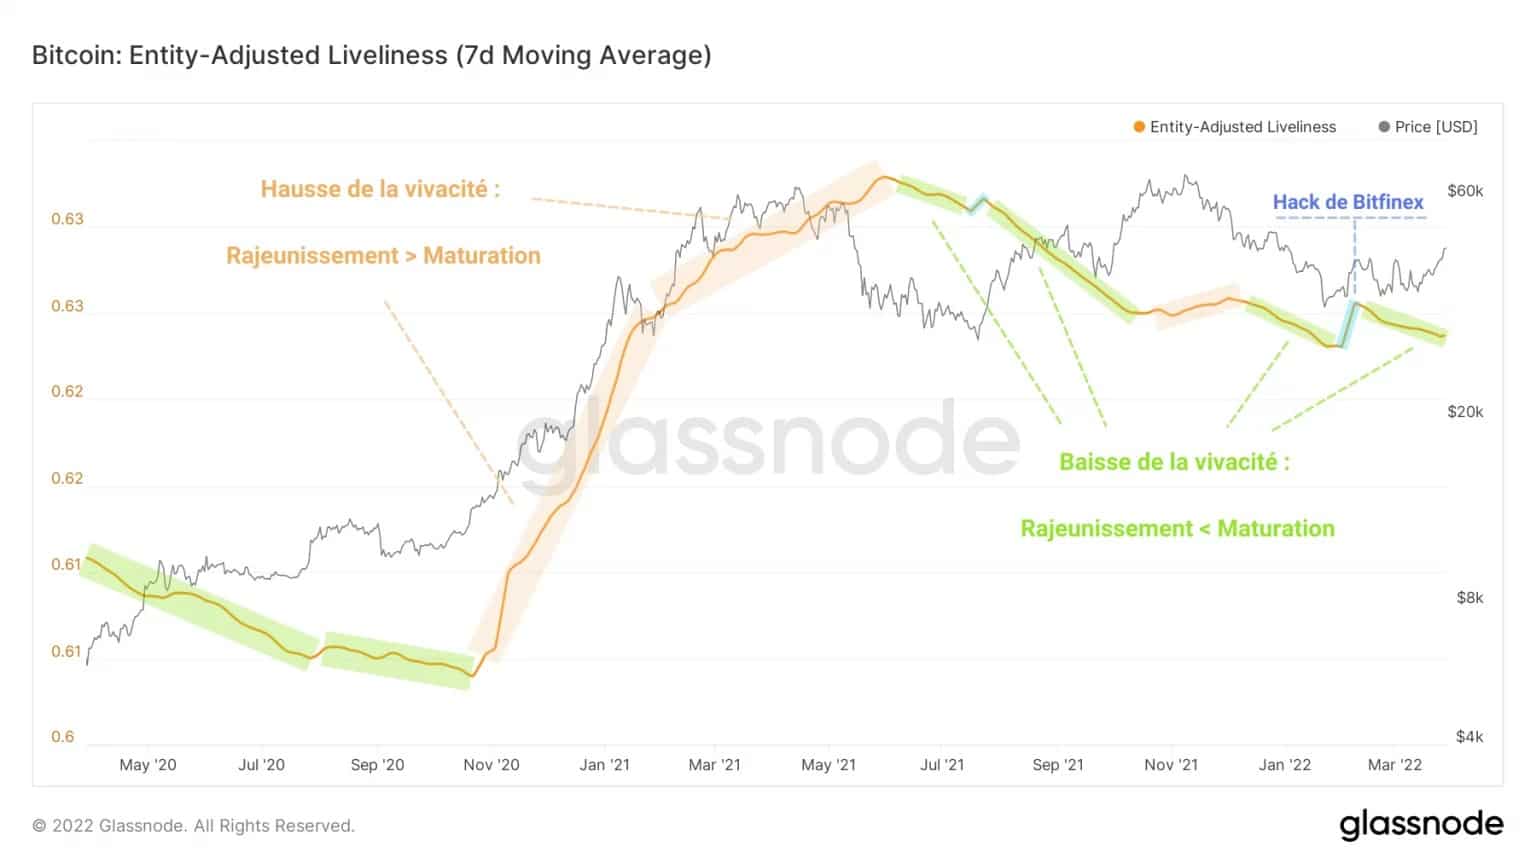
Figure 4: Liveliness
In fact, it appears from the gradual drop in liveliness that more BTC are entering a mature state than are being rejuvenated, a sign that the market bias is not yet to the expense.
A final example of this process of saving and maturing BTC can be accessed via the study of HODL waves.
By selecting the bands of BTC that are at least one year old, a relatively coordinated global dynamic emerges that indicates an accumulation as well as a continuous maturation is underway since December 2021.
Based on these observations, it appears that long-term investor commitment, particularly through spending behaviour, is now insufficient to trigger a large-scale bullish distribution.
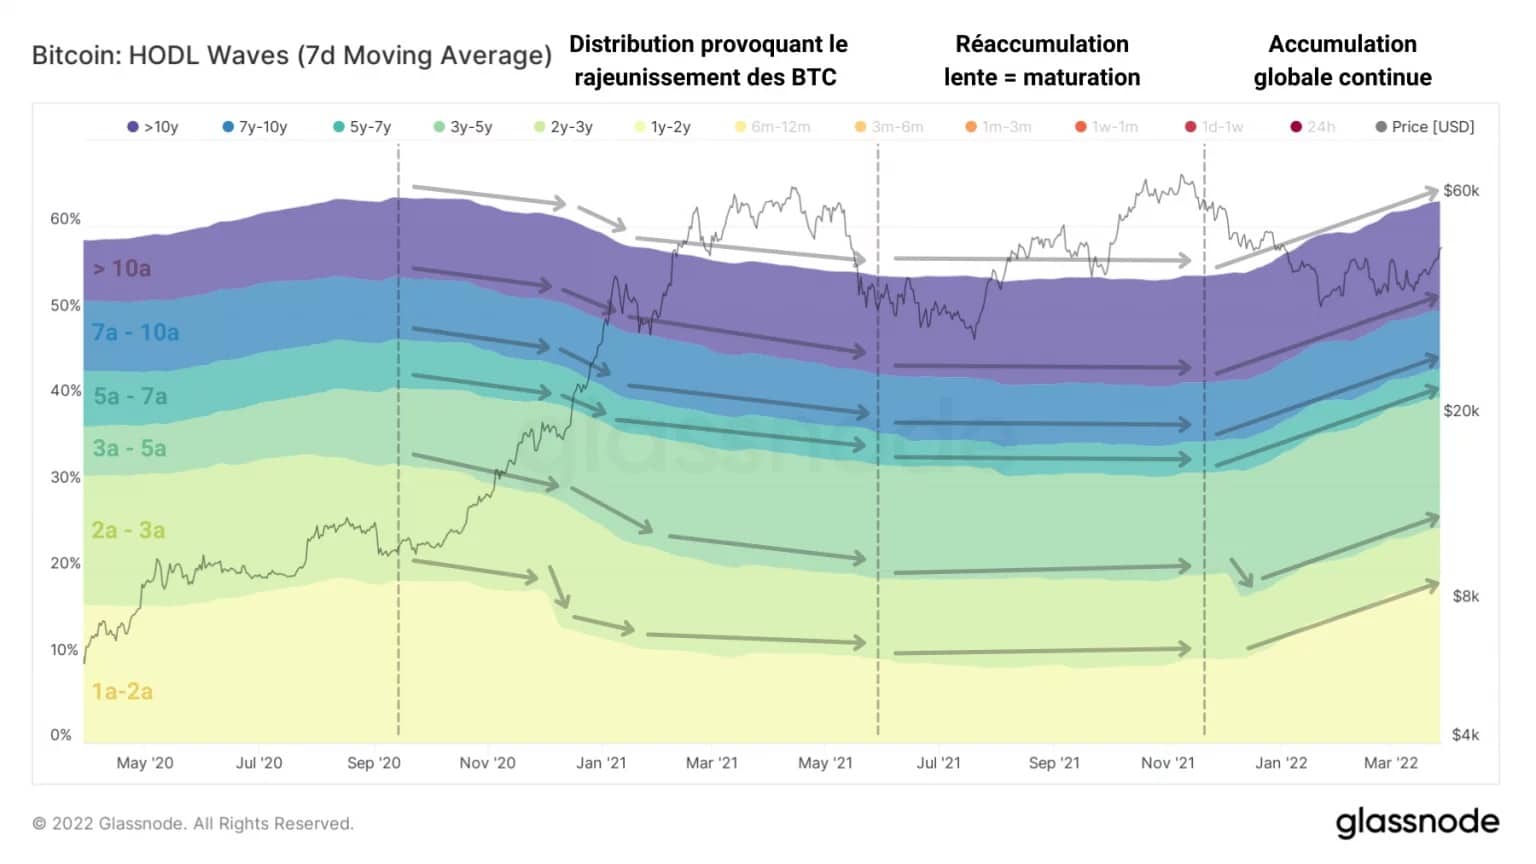
Figure 5: HODL waves of more than one year
A lack of coordination of HODL spending
If one considers the dynamics of the supply held by LTHs as a catalyst for their spending behaviour, the situation makes clear sense: accumulating 13.4 million BTC, the assets held by this cohort have been moving sideways since November 2021.
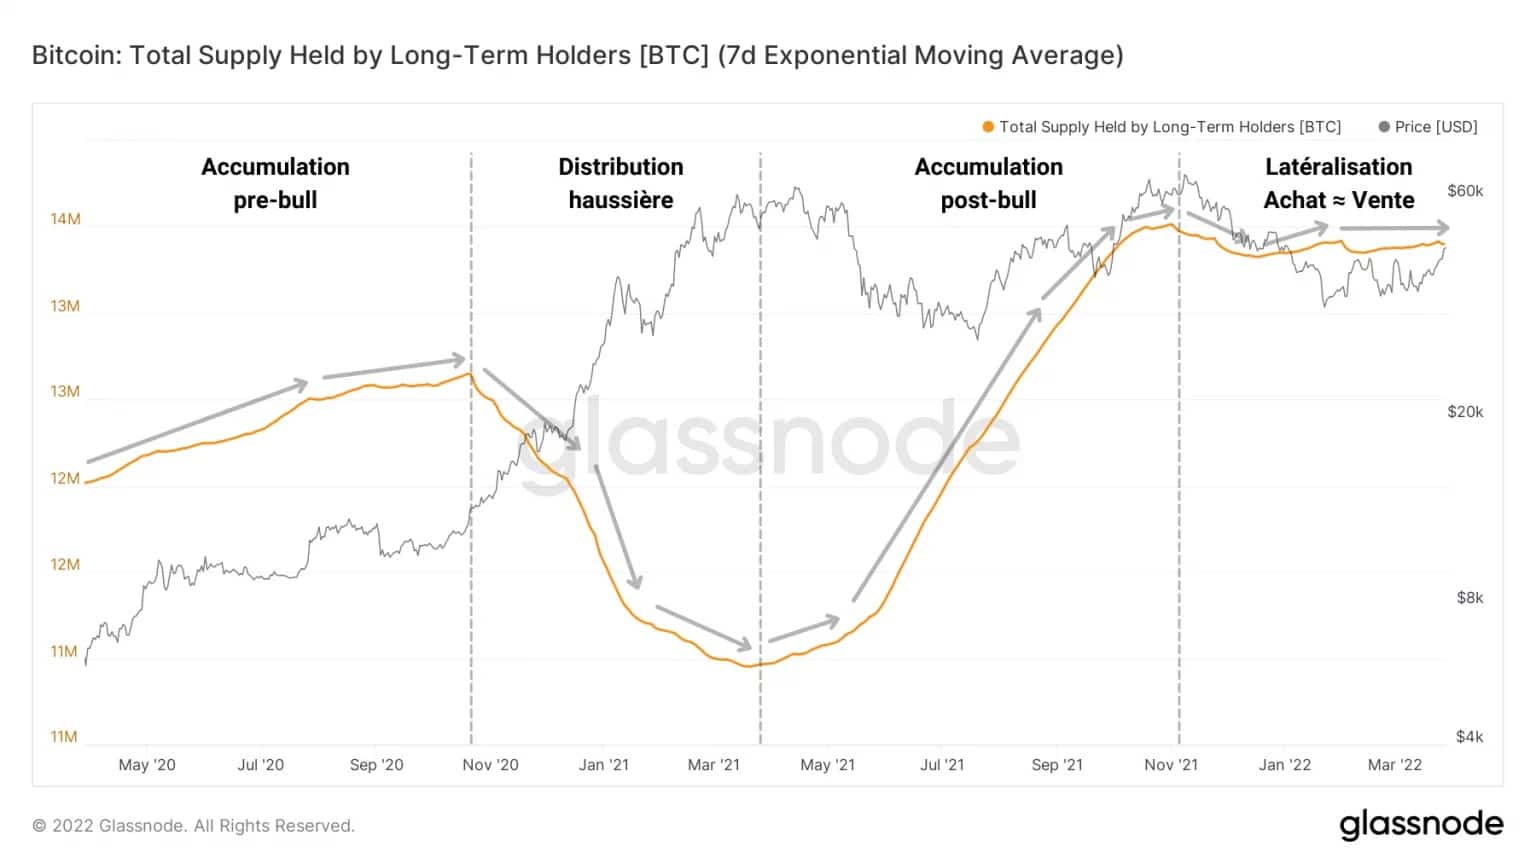
Figure 6: Supply held by long-term investors
Purchases almost perfectly balancing sales indicate that these entities have not yet entered into a coordinated distribution, probably waiting for higher prices in order to realise further profits.
Indeed, the change in the net position of LTHs shows us that, following a large distribution and then an intense accumulation, the variations in flows associated with this cohort gradually diminish, tending towards an equilibrium between supply and demand.
It appears that long-term investors are partly sellers and partly buyers, with no clear overall consensus on whether to save or spend their assets.
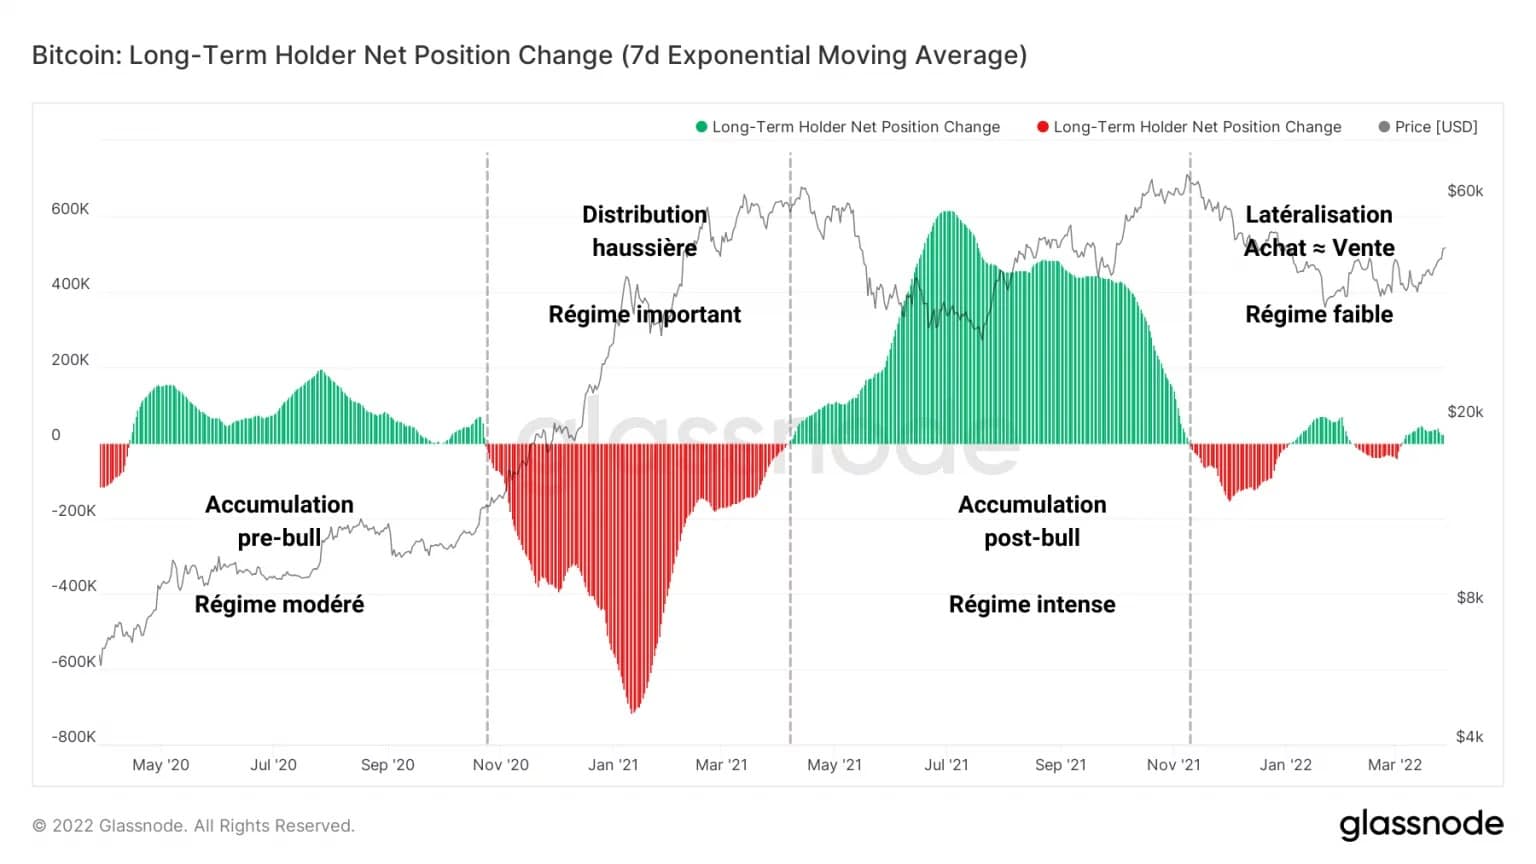
Figure 7: Change in net position of long-term investors
With 81.8% of the outstanding BTC supply under their umbrella, LTHs are largely holding these tokens at a profit, although about one-fifth of them still harbour latent losses.
Given that periods of bullish distribution accompanying BTC price appreciation occur when a large majority of LTHs are in a position to take profits, it is potentially too early to see this dynamic begin.
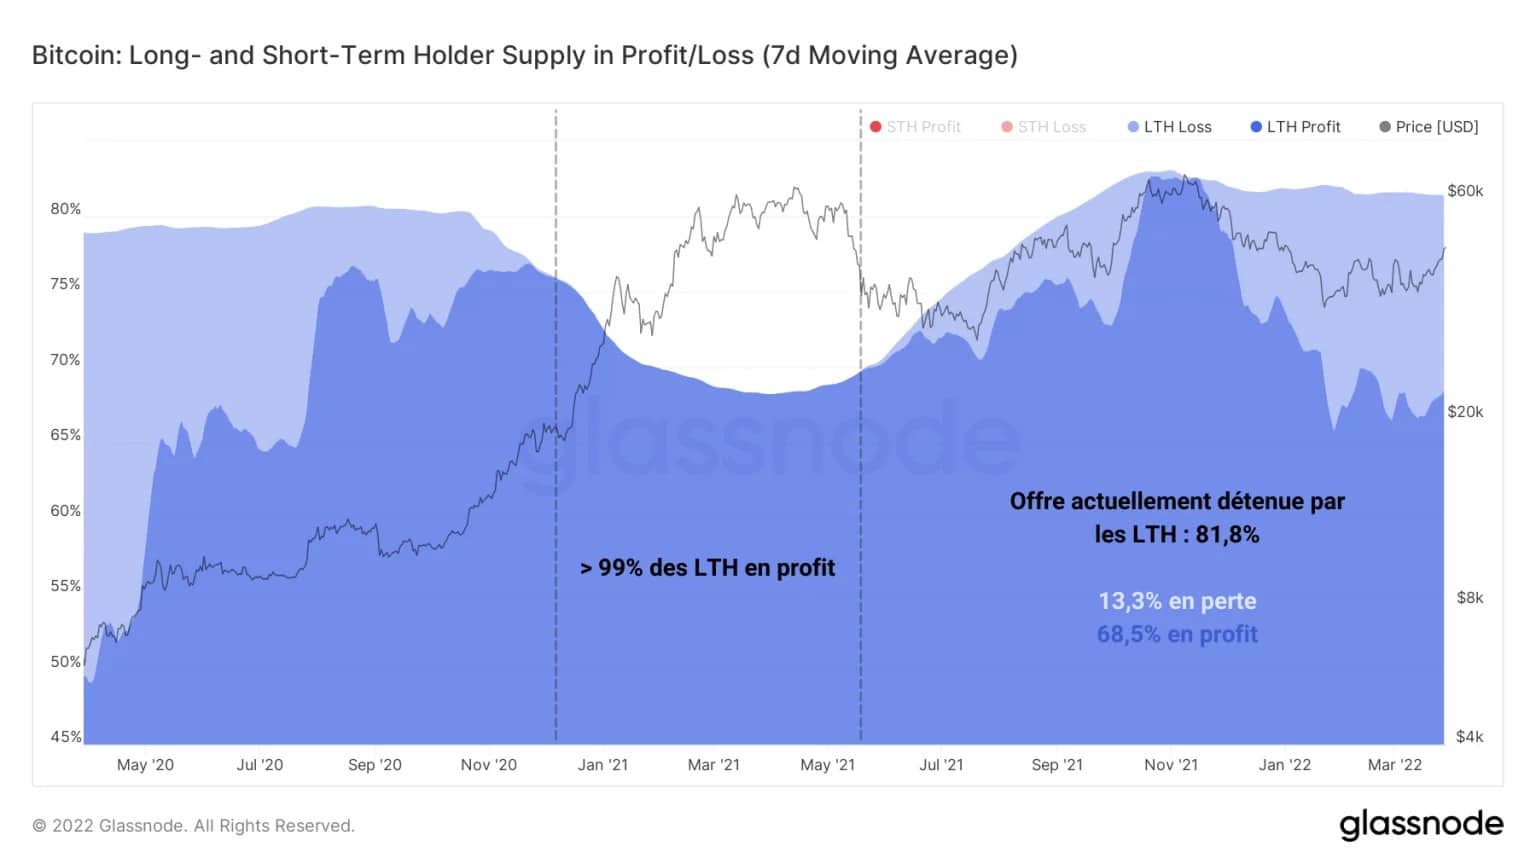
Figure 8: Supply held by long-term investors in profit/loss position
Given that periods of bullish distribution accompanying BTC price appreciation occur when a large majority of LTHs are in a position to take profits, it is potentially too early to see this dynamic begin.
A likely drag on these entities at present is therefore the lack of incentive to sell, either through a still-low price or the buying pressure absorbed by long-term investors still making losses.
Yet the aggregate cost base of LTHs, at just under $16,000, is currently low enough to give the entire cohort a latent profit of over 100%.
While this cohort does not currently appear to be behaving in a consistent and orderly fashion with respect to their spending, this is the chart to watch closely over the next few months for the beginnings of a bullish distribution.
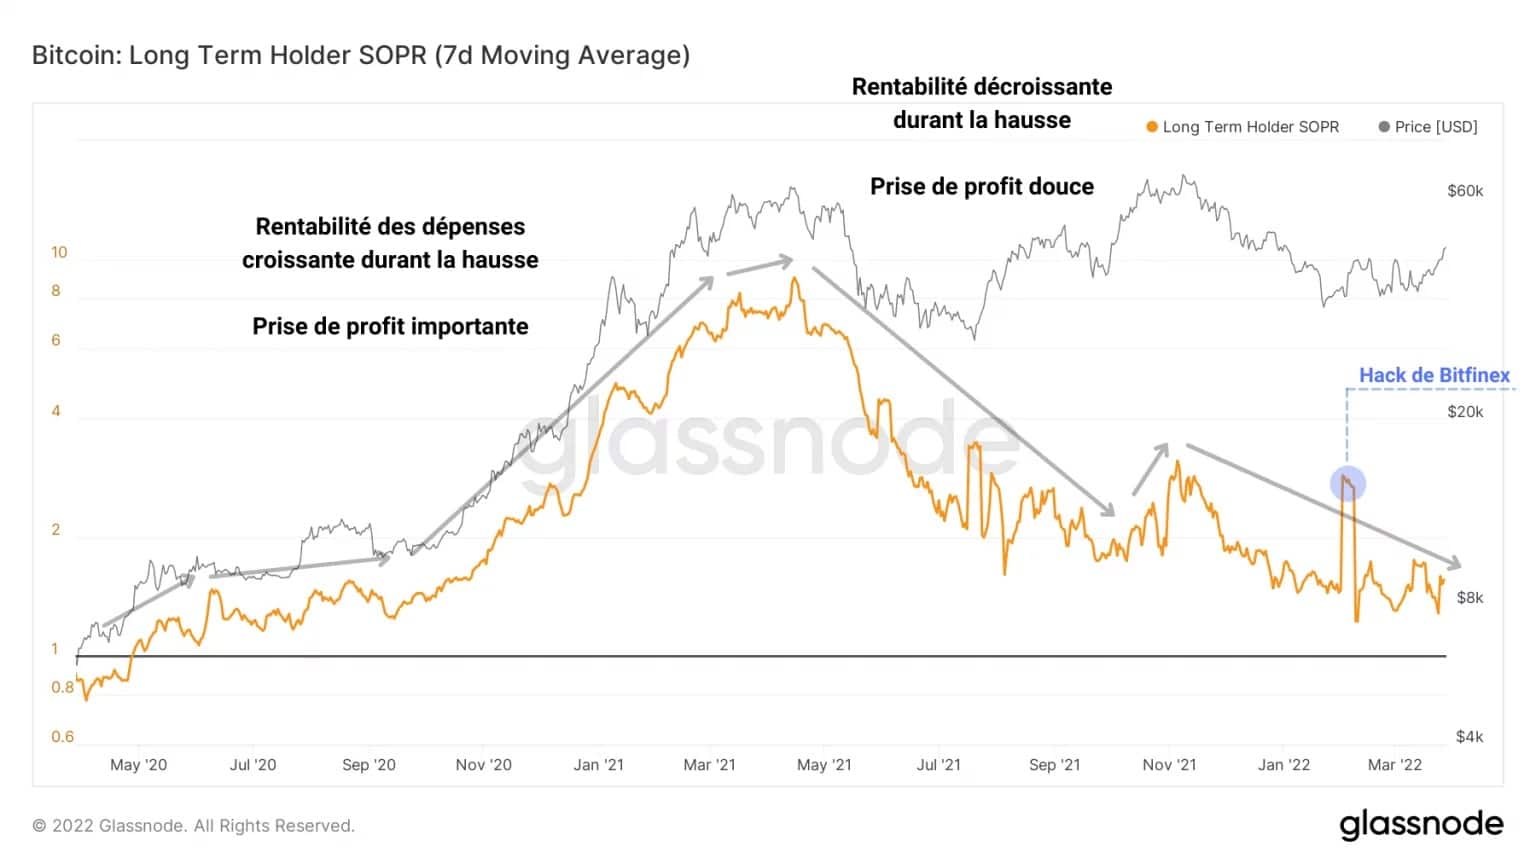
Figure 9: LTH SOPR
The LTH SOPR is described as the ratio of the purchase price to the selling price of 1 BTC over 155 days old.
Adopting a gradual upward trend from the break-even point (LTH-SOPR = 1) to profitability ratios exceeding 8, this metric tracks the evolution of the profitability of investors’ spending over the long term.
We can clearly see a dynamic of increasing profit taking from May 2020 to May 2021, followed by a gradual fall in spending profitability due to the fall in the BTC price.
Thus, in order to identify a new profit-taking phase within a reliable uptrend, we will need to observe:
- the fall in the percentage of LTH in a loss-making state;
- the fall in the holdings of the LTH cohort, accompanied by significant outflows;
- the increase in holdings of short-term investors (STH), ready to buy the tokens for sale;
- the increase in profitability of LTH spending as the BTC price reaches new highs.
Noticeable return to risk taking
Let’s turn to the derivatives markets. Exchanges offering futures and perpetual contracts now total over $27 billion despite low volumes.
If we look at the degree of leverage in the futures markets, we can see that open interest is steadily increasing, reaching 1.94% of bitcoin’s market capitalization.
Until 2021, leverage ratios above 2.0% of market capitalisation have historically been high-risk periods, often followed by a violent purge (short or long squeeze).
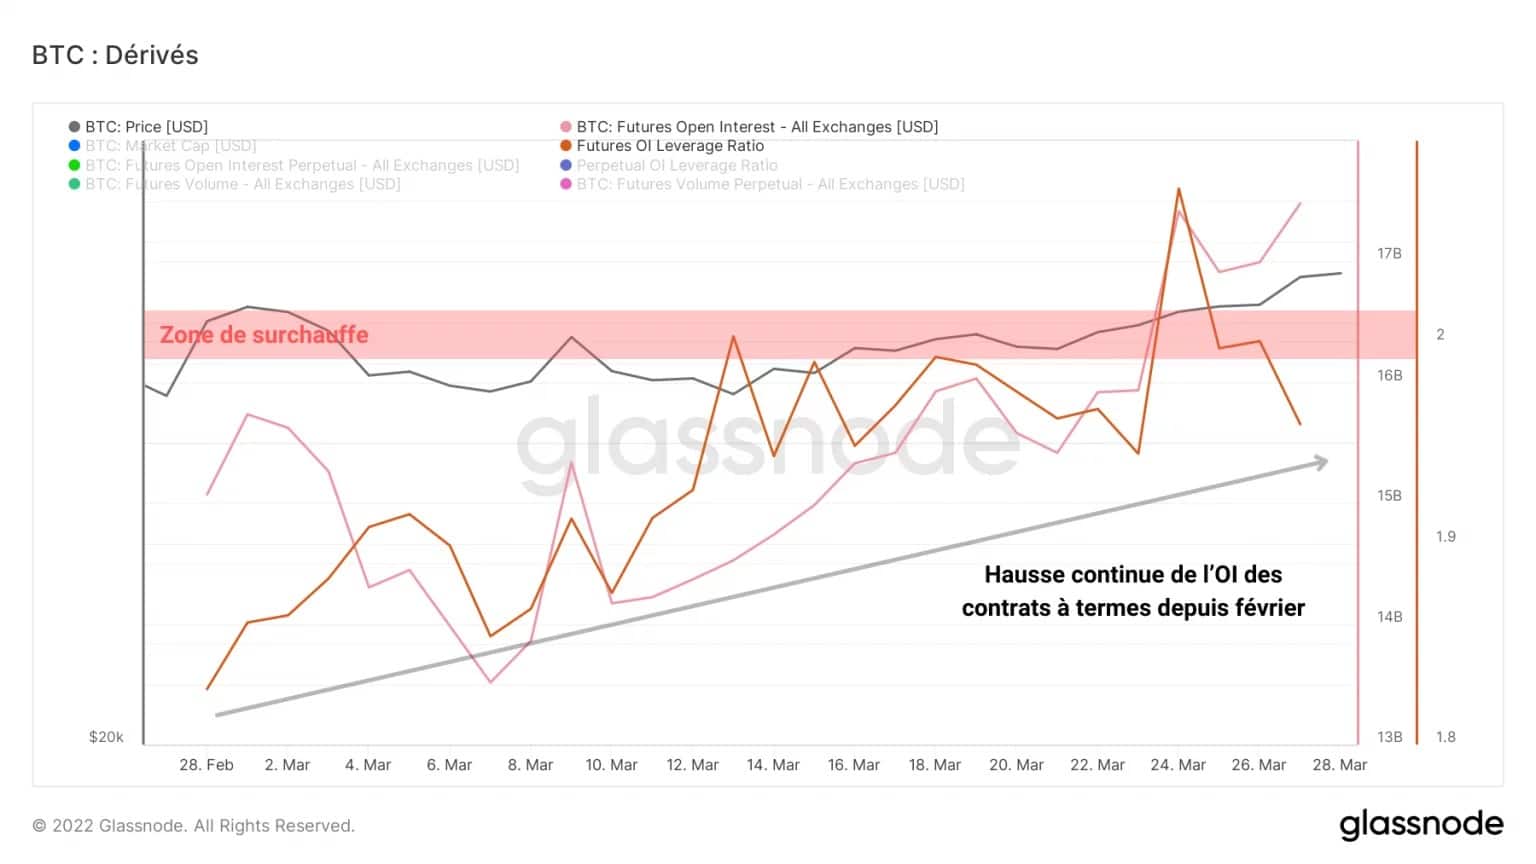
Figure 10: Open interest in futures contracts
Open interest in the perpetual futures market represents 1.28% of bitcoin’s market capitalization, an area associated with high levels of risk.
It also appears that the market is currently preferentially deploying capital into perpetual swaps, rather than expiring futures contracts.
Such interest levels make cascading liquidation scenarios plausible and bring high volatility to the market, irrespective of direction.
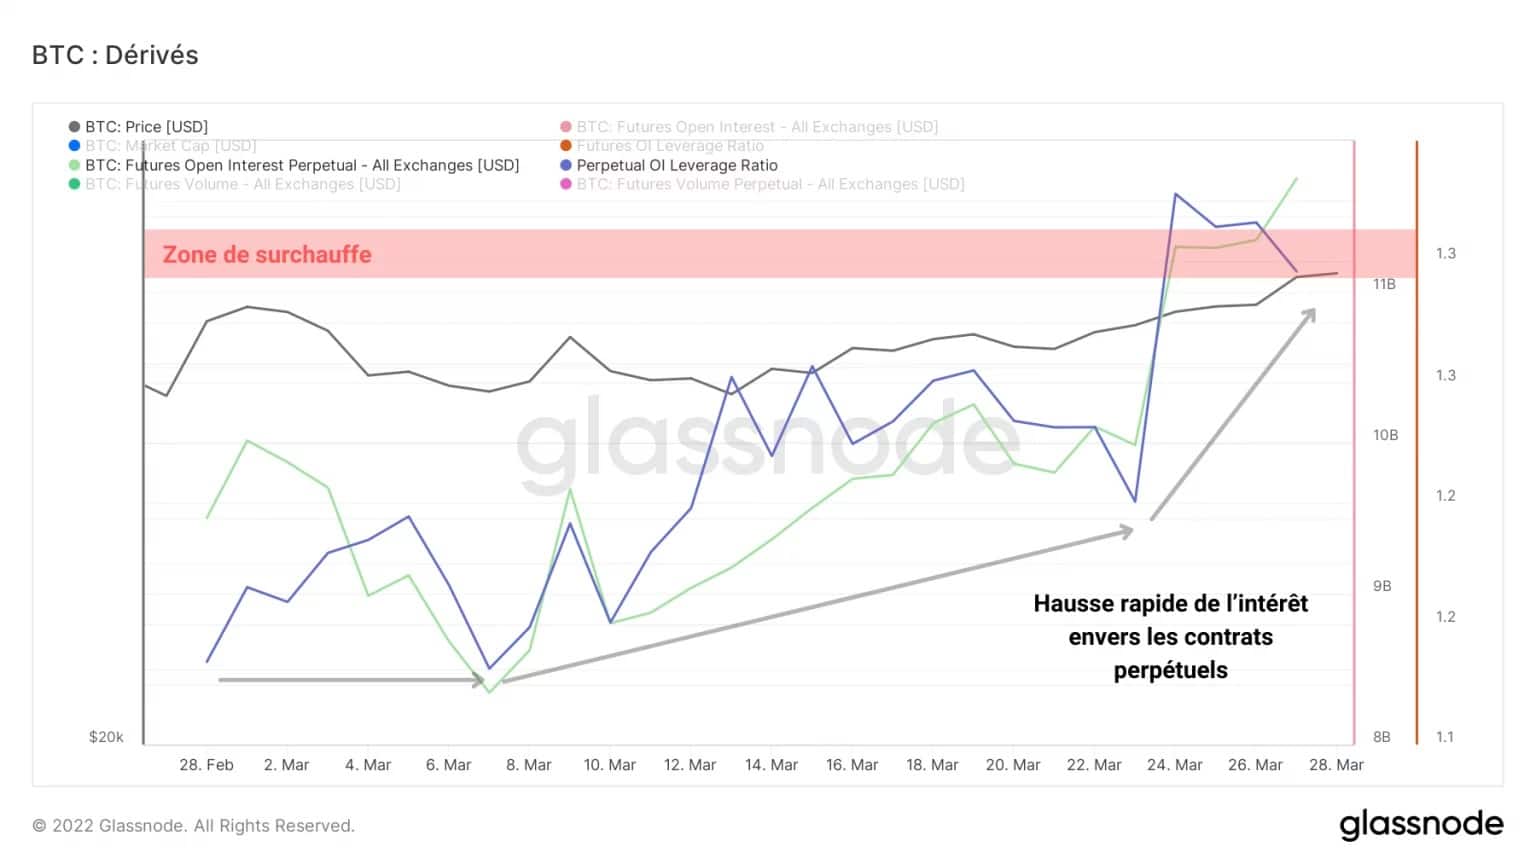
Figure 11: Open interest towards perpetual contracts
Countering this possibility, a review of trading volumes in dollar contracts indicates a steady decline since mid-March.
Although there is a lot of capital being deployed across the derivatives sector, there appears to be little activity at the moment. However, close attention will need to be paid to this area to detect any potential large movements.
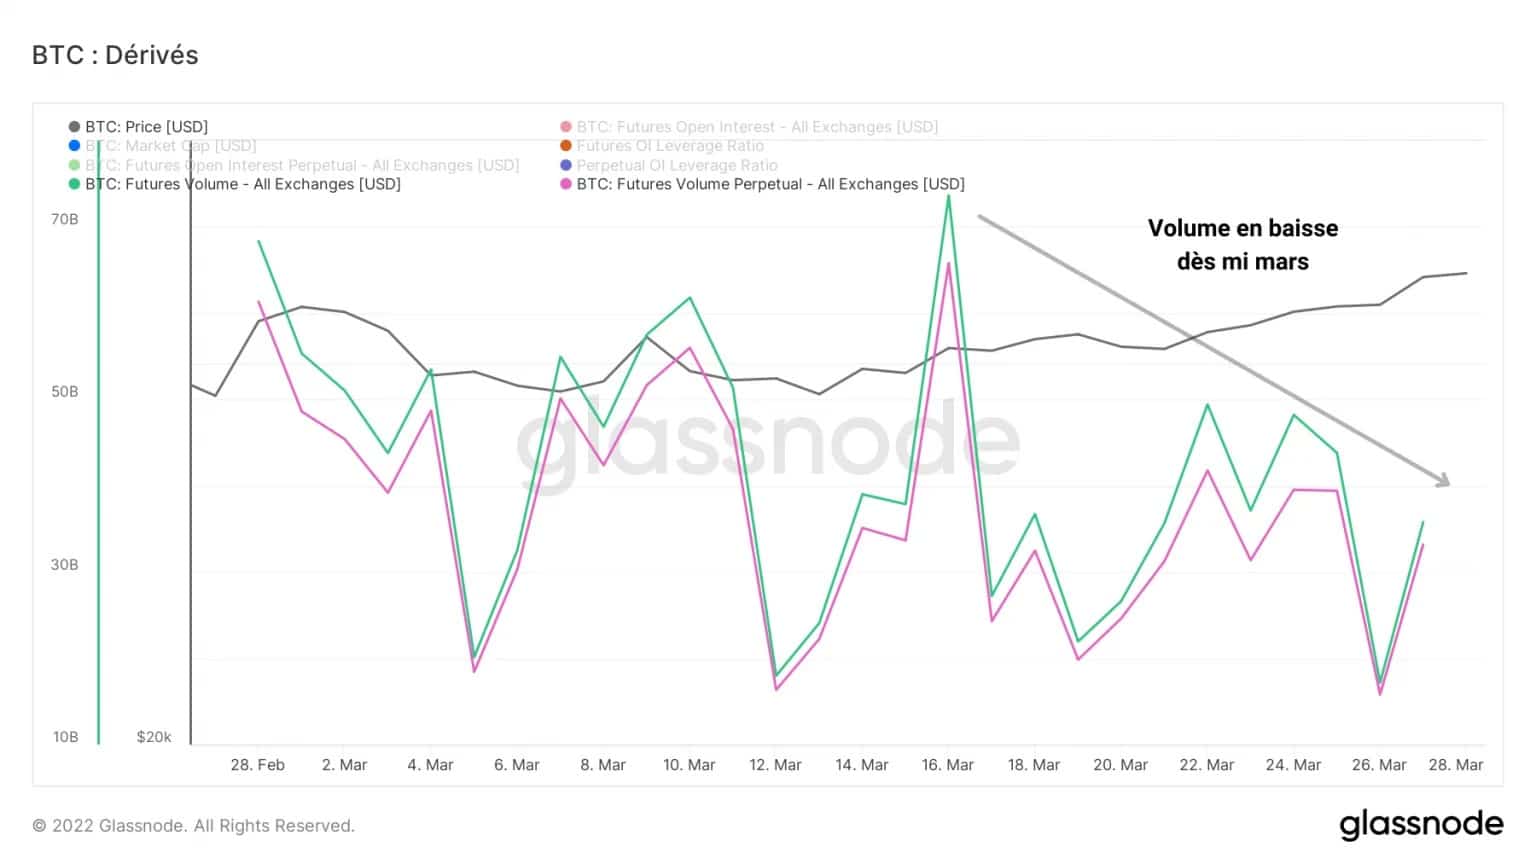
Figure 12: Futures and Perpetuals trading volume
Furthermore, the market seems to be reducing its use of leveraged borrowing collateralised to BTC. Choosing to favour borrowing financed by stablecoins, some speculators are limiting the risk exposure of their collateral in order to avoid margin calls.
This strategy demonstrates a degree of caution among participants and is potentially constructive for a healthy rally in the coming weeks.
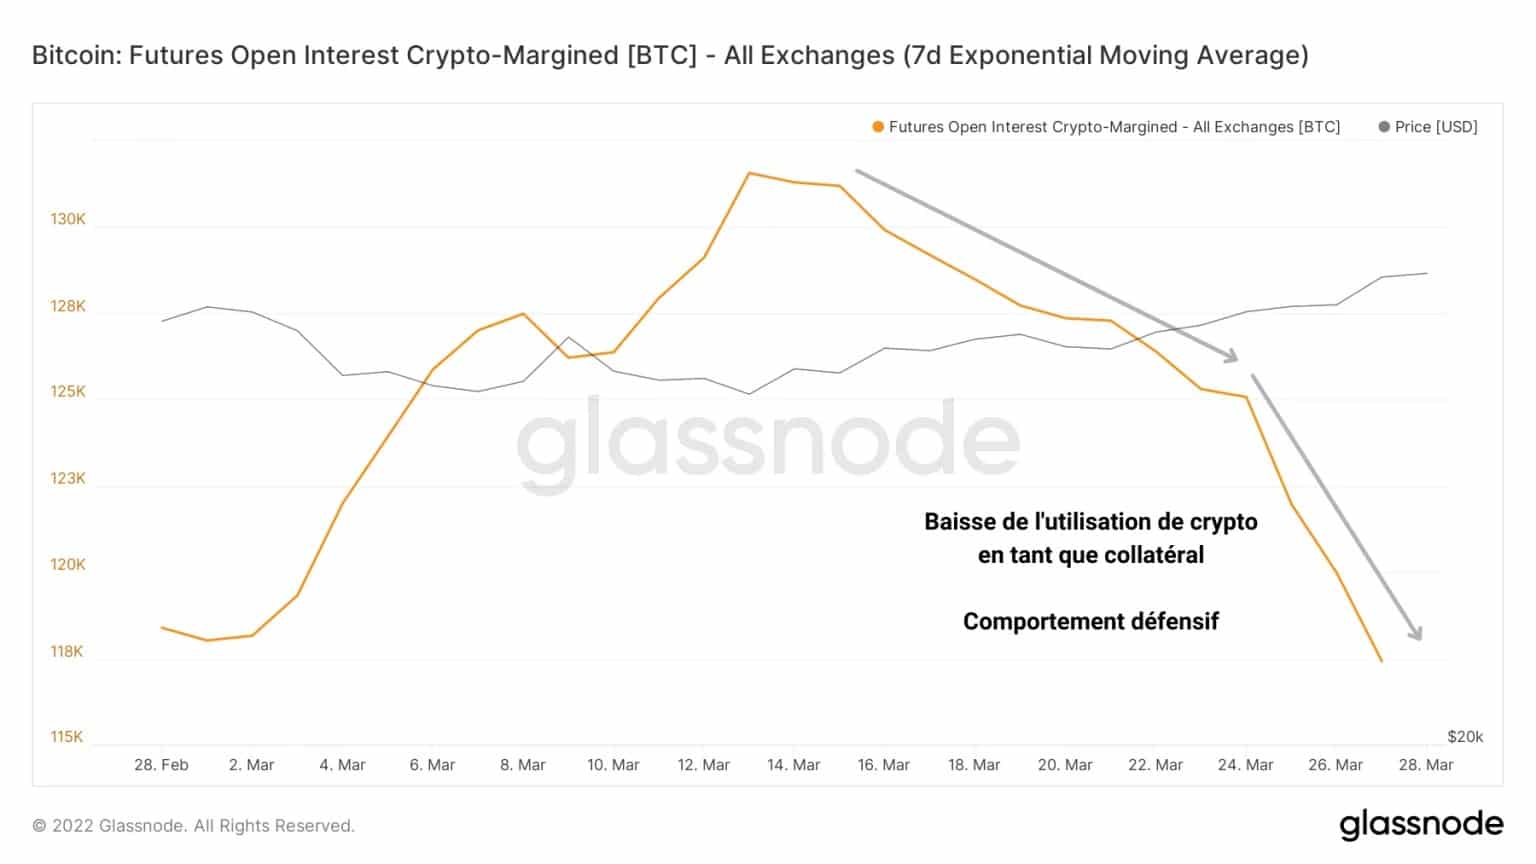
Figure 13: Open interest funded via crypto collateral
Summary of this on-chain analysis
Overall, it seems that the recent price rise is only a breath of fresh air for the moment, not yet ensuring a sustainable rise on a fundamental level. The market structure remains constructive, however, and makes hope legitimate following the recent consolidation in BTC.
The lack of significant BTC rejuvenation indicates that long-term investor commitment is still lacking. Ideally, we will need to wait for this cohort to begin a new phase of coordinated profit taking on the upside in order to see a bullish distribution and rotation of capital from LTH to STH.
Moreover, speculators in the derivatives markets seem to have already deployed a significant amount of capital and are now exposing themselves to a high level of risk, despite still low trading volumes. High volatility could therefore set in very quickly and lead the market to purge excess leverage in the coming weeks.