
Market opportunities are driving participants to express interest in the spot and derivatives markets. Large-scale accumulation is draining the reserves of exchanges while derivatives markets, led by OKex, are experiencing a resurgence of interest, increasing the likelihood of a major liquidation event.
Bitcoin wobbles without direction
Bitcoin (BTC) price laterals between $21.5k and $19k, recalling the lull that occurred after the Terra/LUNA ecosystem collapse between May and June.
Following the recent historically low profitability levels, the market is signalling attractive investment opportunities.
This phenomenon is causing participants to express their interest by accumulating BTC on the spot markets and speculating on its price in a frenzied manner on the derivatives markets.
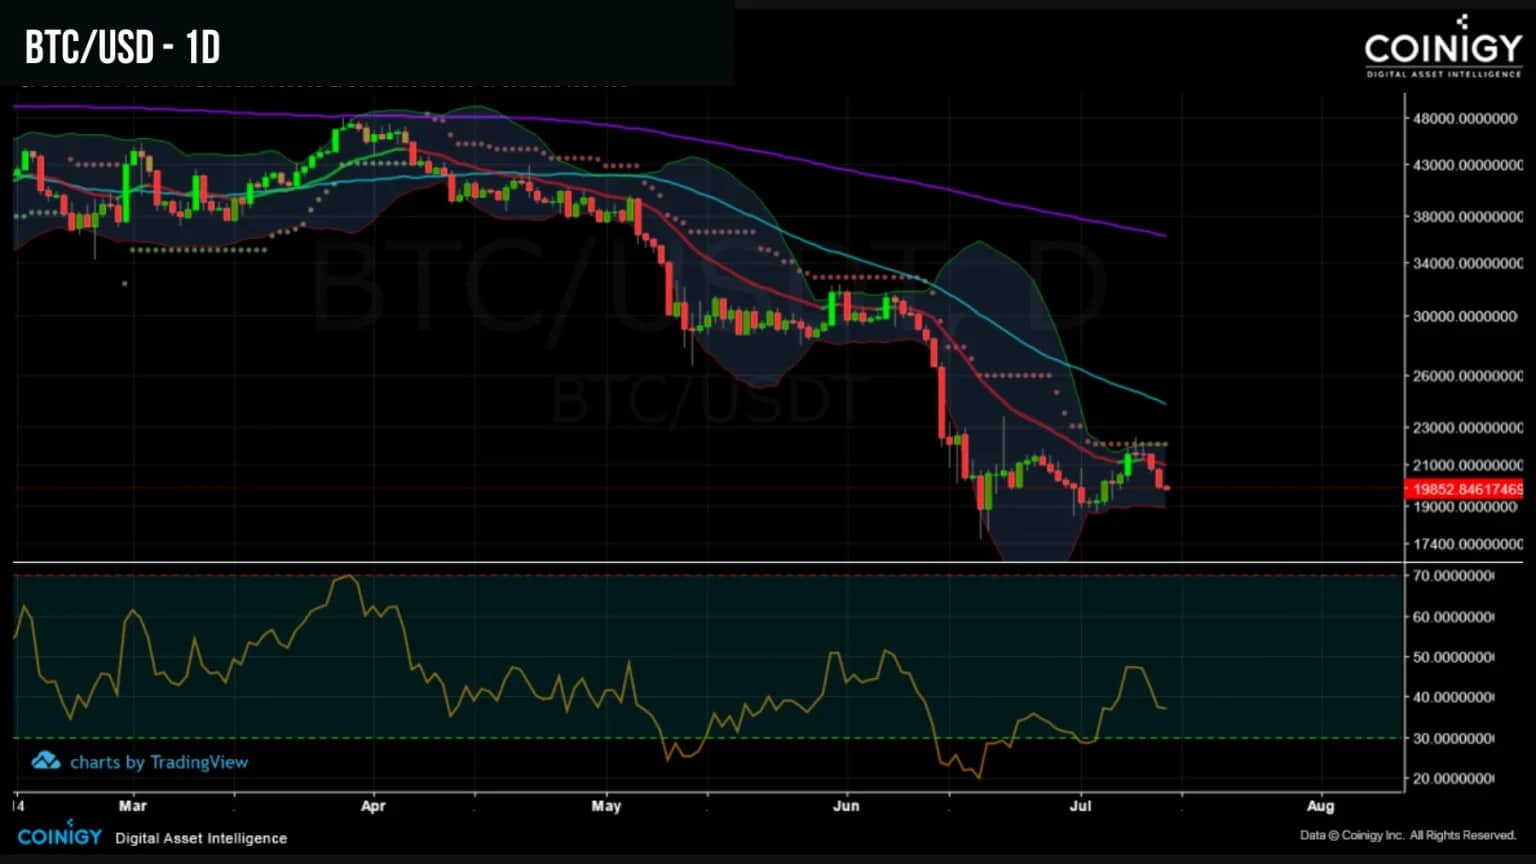
Figure 1: Daily BTC price
This week we will be evaluating:
- the extent of demand in the spot markets;
- the rise of speculative risk in the derivatives markets;
- the growing dominance of OKex in the futures market.
Strong demand despite a difficult environment
For the 5th time in its history, the MVRV ratio signals that the Bitcoin market is in a state of overall undervaluation.
This metric, calculated as the ratio of the spot price to the realized price, registers positive values when the BTC price is above the aggregate cost base of coins circulating on the network.
Conversely, during pronounced downturns, the MVRV becomes negative, indicating a non-negligible loss of profitability for the market as a whole.
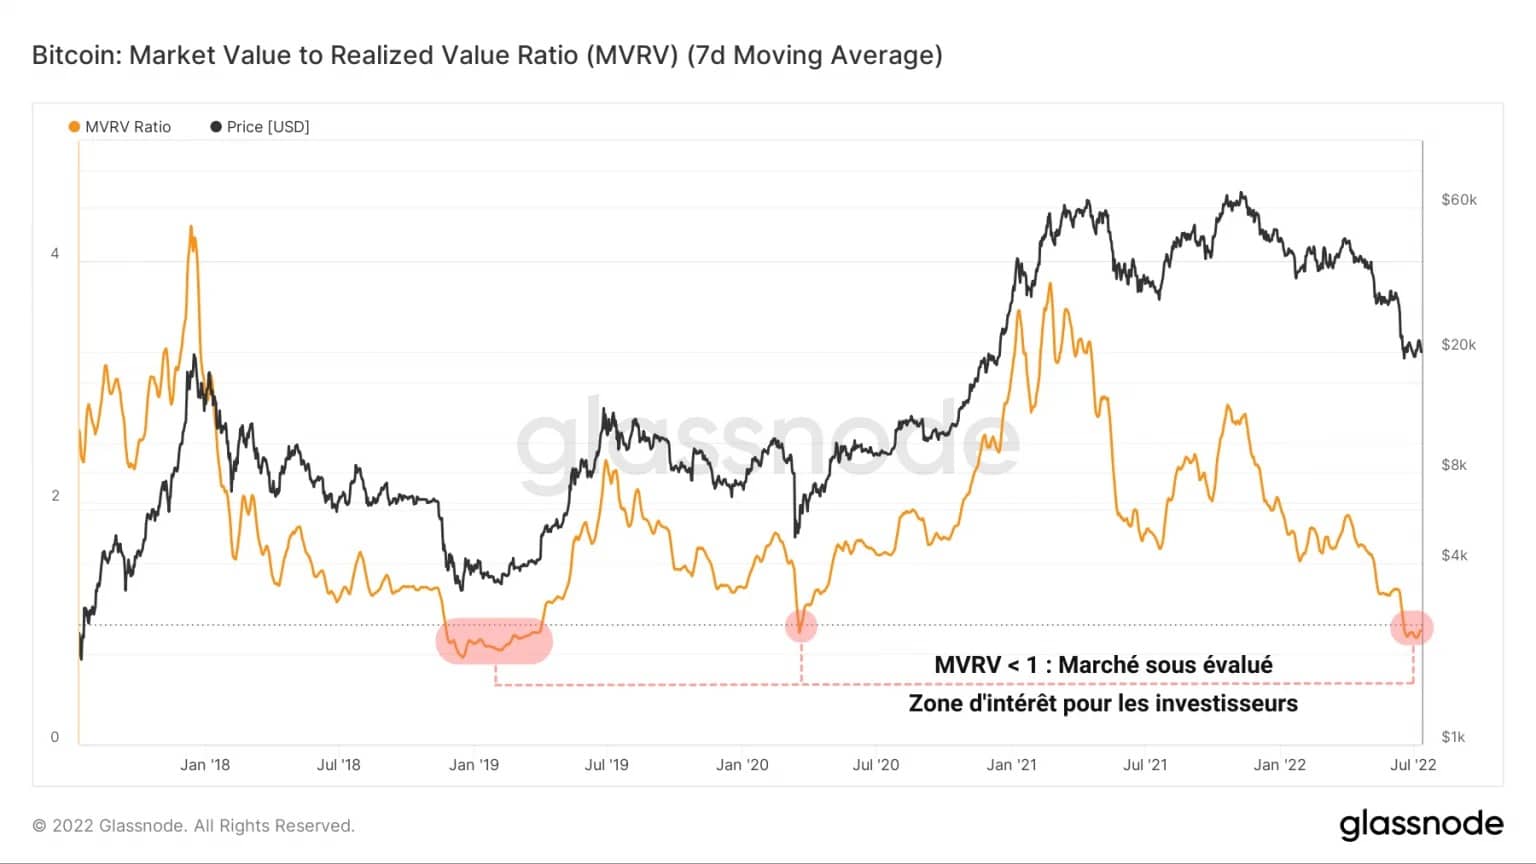
Figure 2: MVRV ratio
This area, where the BTC price is highly undervalued, is a very attractive investment territory for entities looking to build long-term savings at a discount.
Reacting to the opportunity with fervor, market participants have intensified the accumulation momentum underway since May 13, following the collapse of the Terra/LUNA ecosystem.
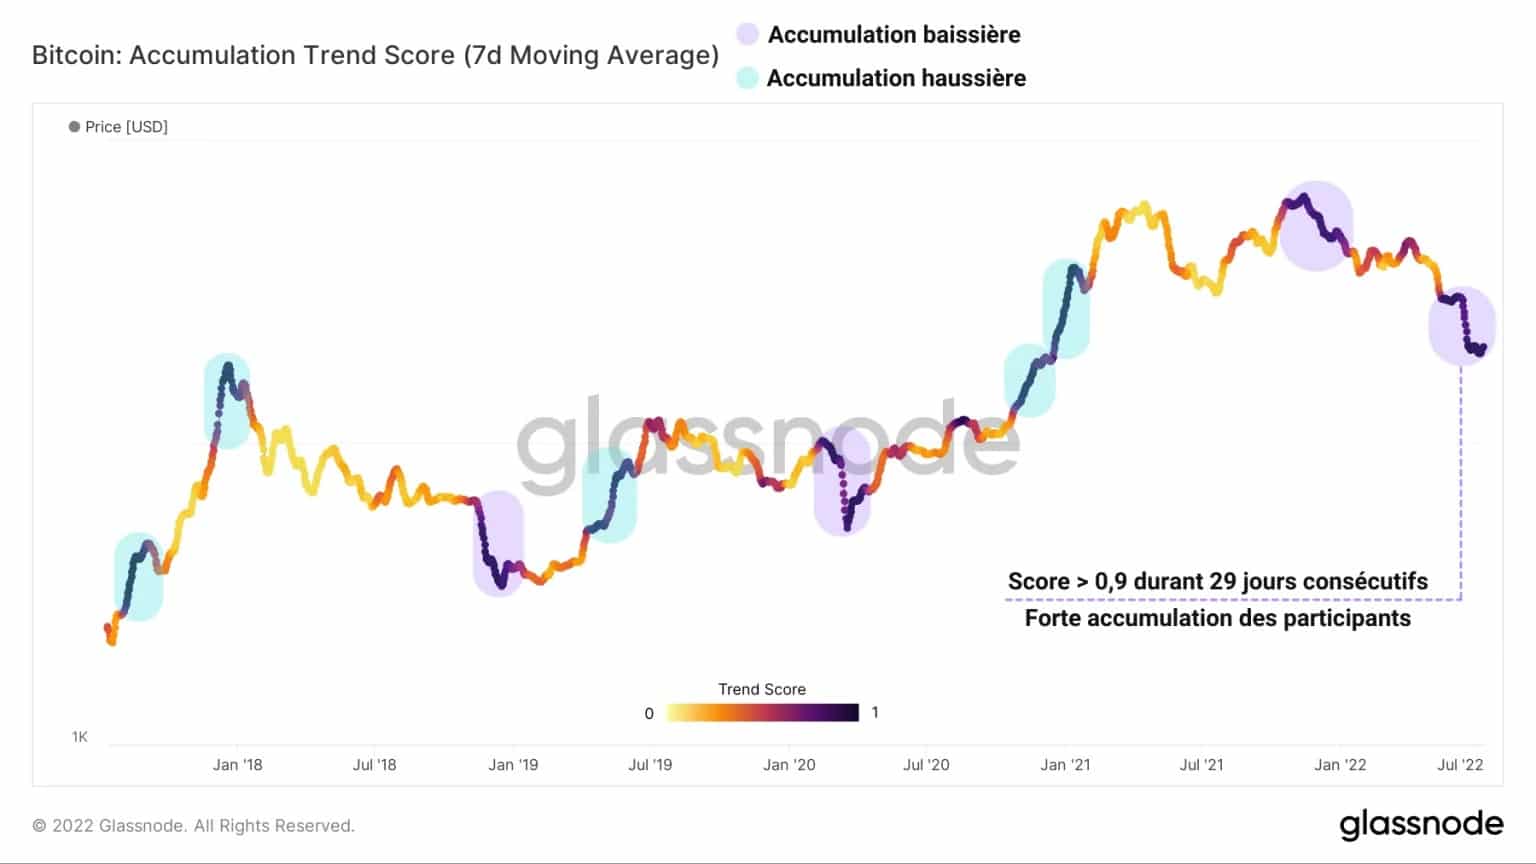
Figure 3: Accumulation trend score
Recording a score above 0.9 (strong accumulation) for 29 consecutive days, the Accumulation Trend Score supports the thesis that investors are currently exerting strong buying pressure on spot markets.
The magnitude of such an event is reminiscent of the two most pronounced bearish accumulation phases of the past five years:
- the final bear market capitulation of 2018 – 2019
- the crash caused by the COVID-19 black swan in March 2020.
By studying the evolution of the amount of supply less than 155 days old over time, we can gain insight into the buying/selling behaviour of investors over the short term.
What stands out in the chart below is the remarkable difference in the behaviour of this cohort of coins compared to the last major downside event, recorded 14 months ago.
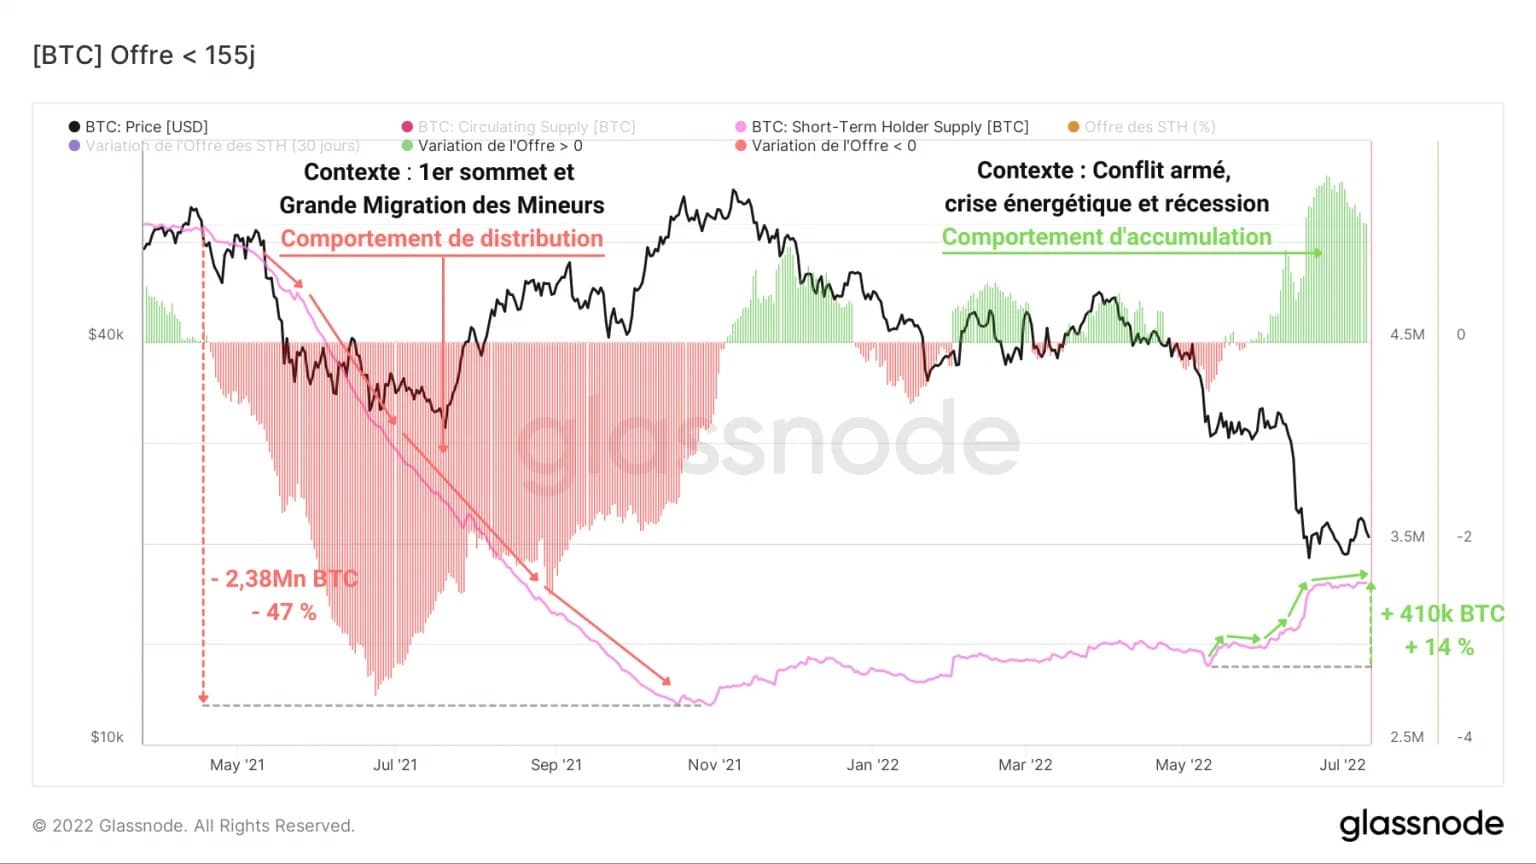
Figure 4: Supply held by short-term investors
As the price fell by 50% and Chinese miners relocated their operations to Kazakhstan or the US, the low conviction of holders of these young coins resulted in a distribution of over two million BTC from May to November 2021.
Yet, despite a deteriorating macroeconomic and social context, short-term supply has grown by more than 400,000 BTC in recent months, demonstrating a coordinated accumulation dynamic.
Siphoning of exchange reserves
One of the first consequences of this large-scale accumulation dynamic is the plummeting reserves of centralized exchange platforms.
Experiencing a structural drop in their deposits since March 2020 (with the exception of FTX and Binance), the exchanges’ balances have seen an outflow of over 150,000 BTC in 25 days.
This is quite simply the fastest and most pronounced wave of withdrawal recorded by the market since its inception.
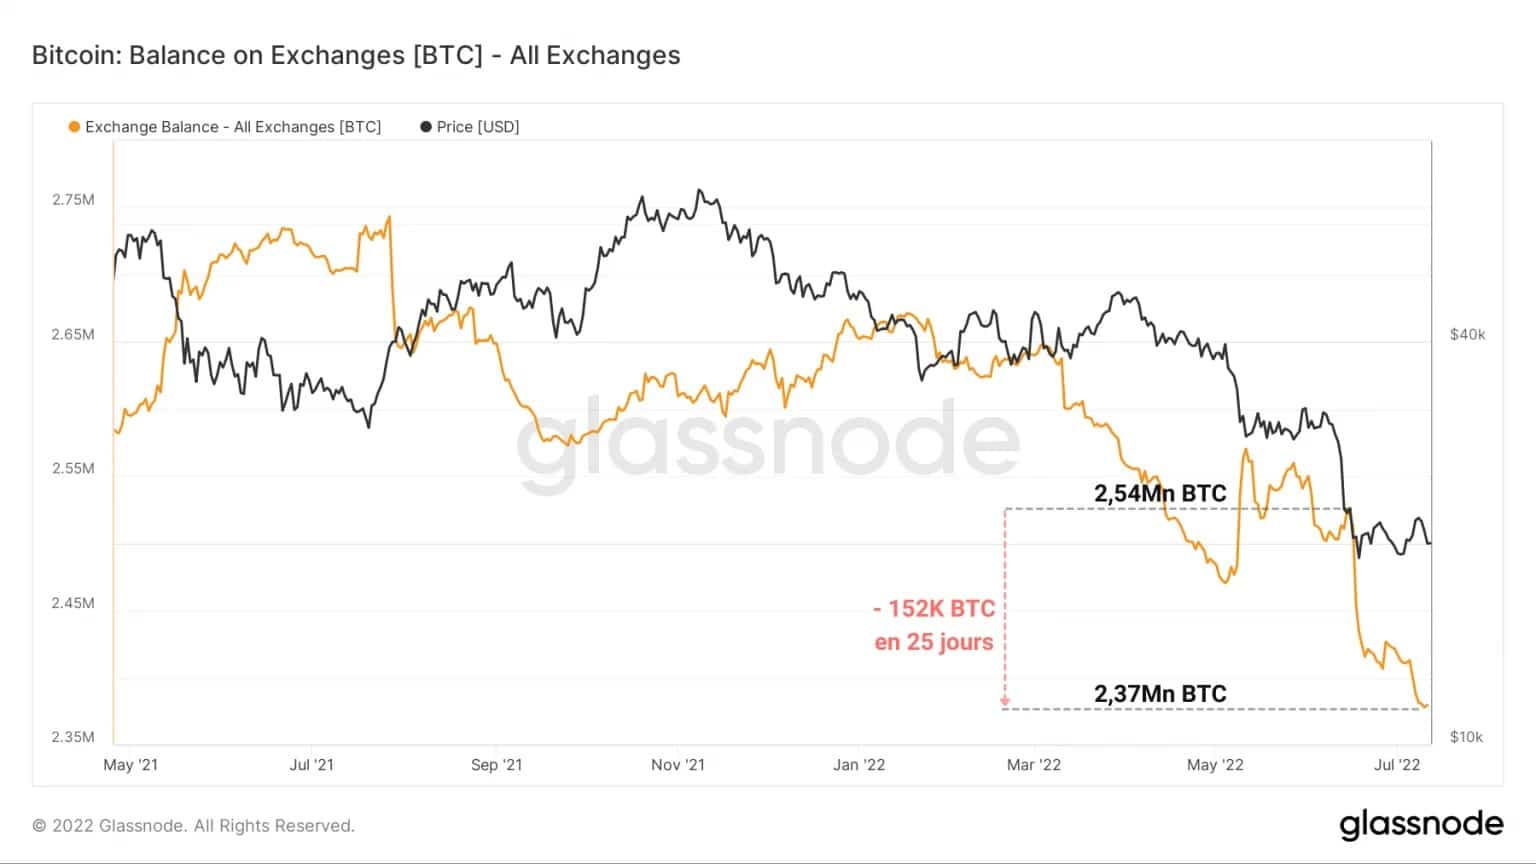
Figure 5: Exchange Reserves
This siphoning off of exchanges is a testament to investors’ growing distrust of delegating custody of their cryptos to third-party entities, a legitimate sentiment given the recent insolvency scandals of several CeFi platforms.
This wave of withdrawals is clearly visible via the measurement of exchange inflow/outflow volumes.
While May 2021 saw a strong wave of deposits following the Great Migration, supplanted by an inbound spike of 14,312 BTC following the collapse of the Terra/LUNA ecosystem, nothing of the sort is observable during the latest downturn.
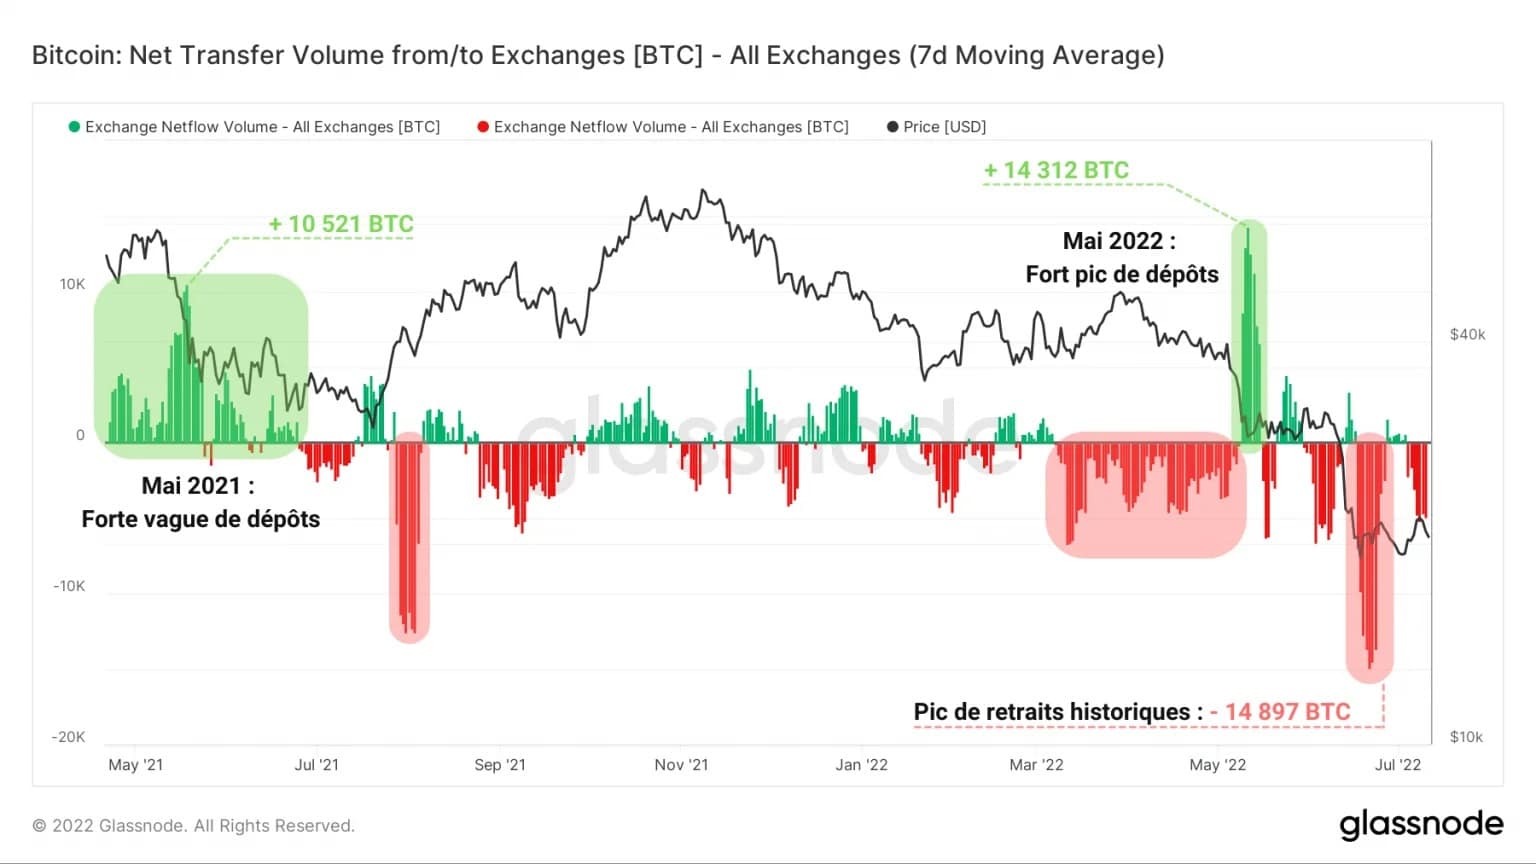
Figure 6: Net flow of exchange reserves
Indeed, the fall that brought BTC to its current price level has caused a reverse dynamic, with the indicator showing an ATH in outflow volume of 14,897 BTC.
While not every deposit equals an intent to sell and not every withdrawal equals an intent to buy, this outflow dynamic can be associated with buying behaviour based on the data discussed above.
Intensification of speculative risk
In contrast to the extent of the build-up in the spot markets, the BTC derivatives markets have seen a resurgence of interest and activity worthy of note.
Indeed, since the Terra/LUNA price drop, the Open Interest (OI) in BTC-settled futures contracts has broken through its multi-year ceiling of 400,000 BTC to reach an ATH of 514,000 BTC.
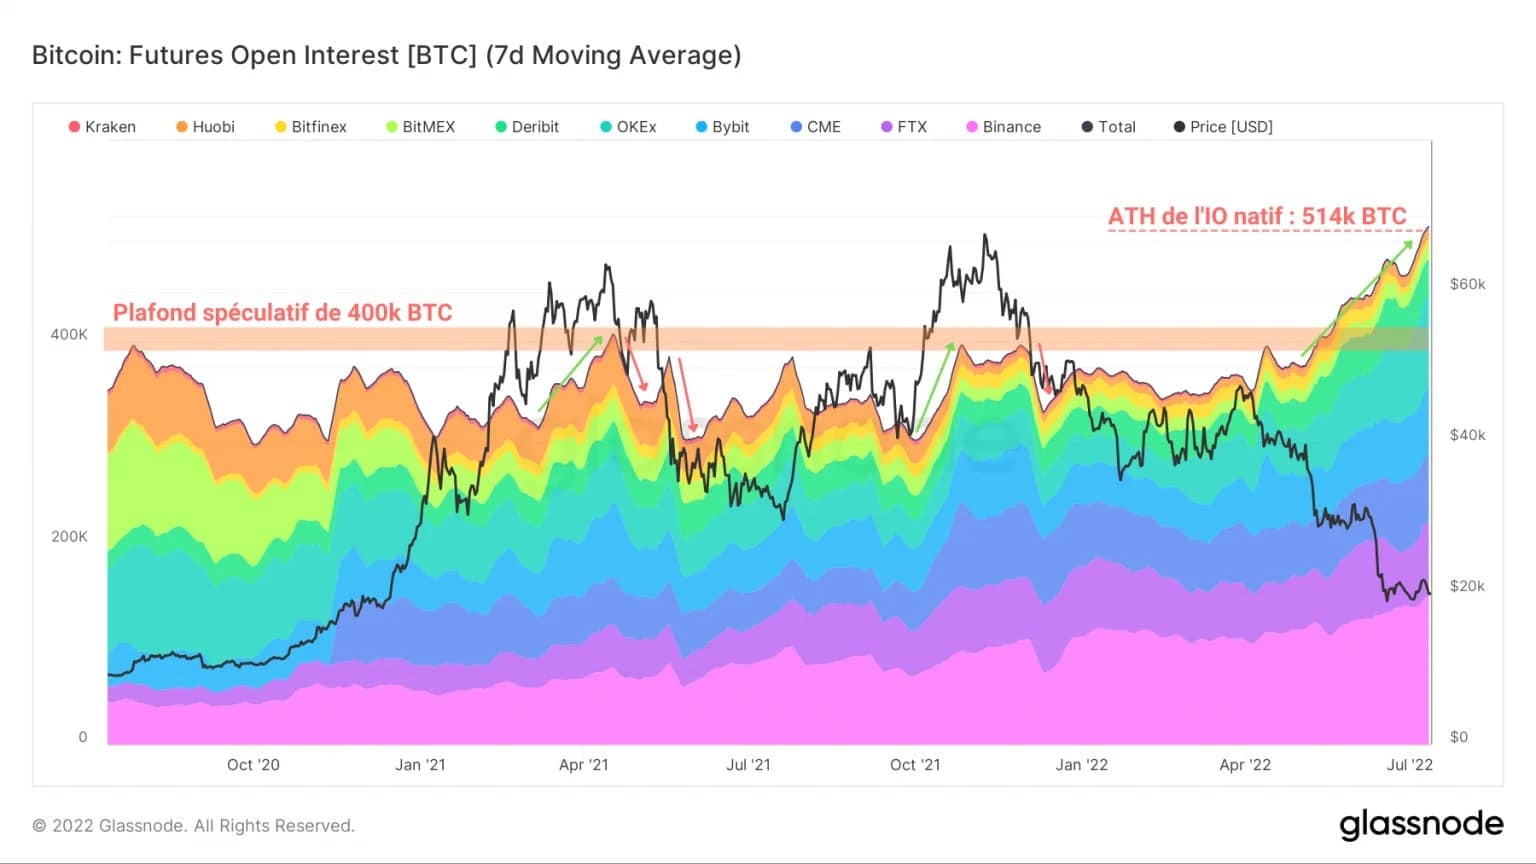
Figure 7: BTC-settled futures open interest (Total)
Given that the risk associated with this type of contract is particularly high in a downtrend (as the value of the collateral falls with the price), we can infer the following two points:
- If the market falls further, the risk of liquidating long positions in cascades is very high.
- Such positions reflect the confidence of some speculators that the market bottom has potentially been reached.
A closer look at the evolution of the open interest (OI) of the BTC-settled futures contracts of the different platforms composing the aggregate presented above reveals a salient fact:
Since the beginning of the year, OKex has seen a strong growth in its OI in BTC, going from 28,200 BTC to 92,900 BTC in seven months.
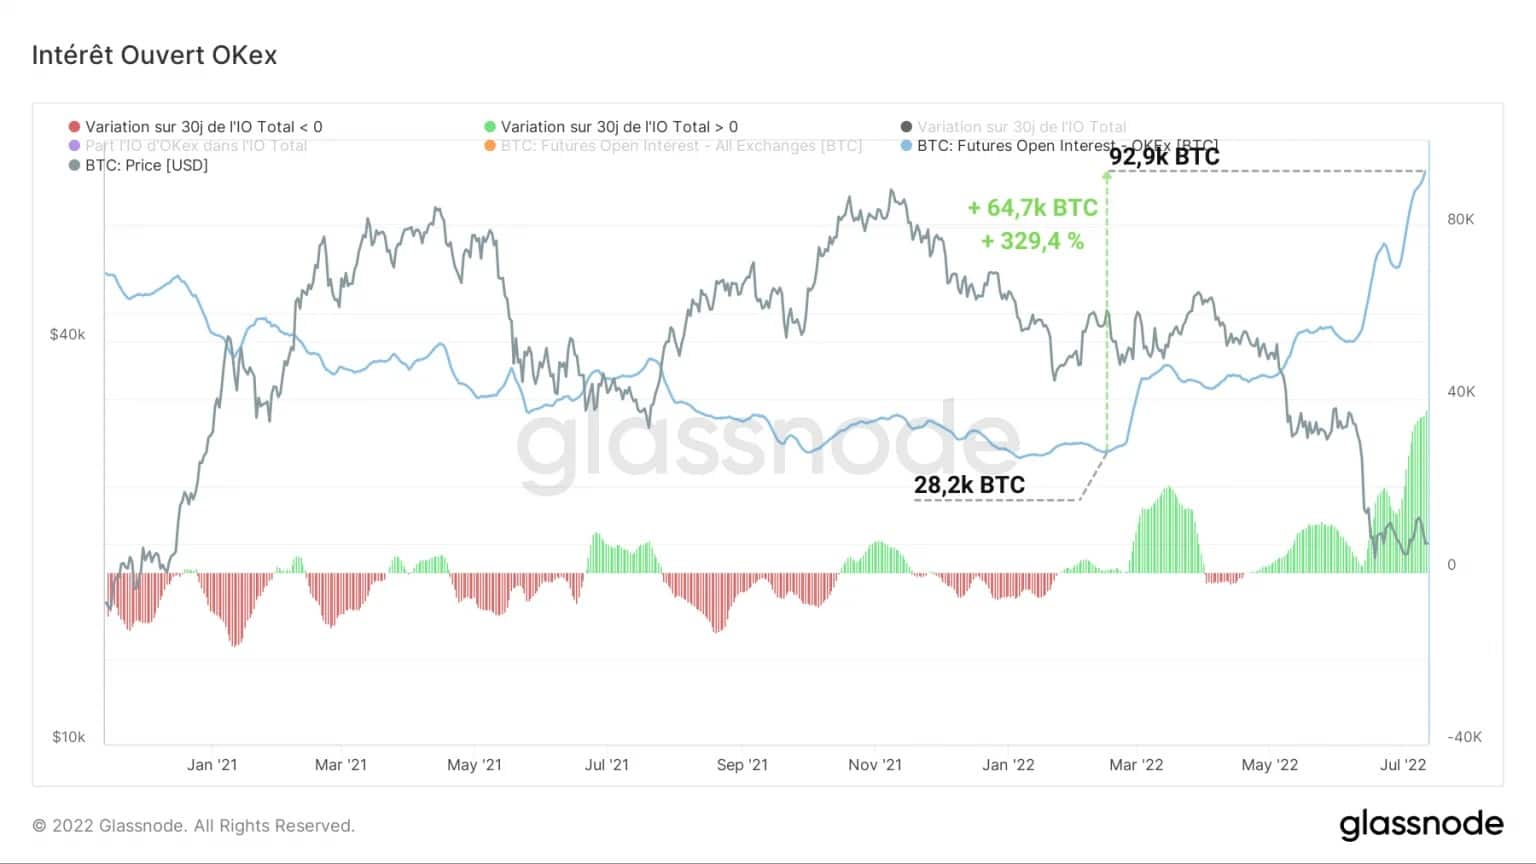
Figure 8: Open interest of futures contracts settled in BTC (OKex)
This 300%+ increase appears to be one of the main drivers of the overall OI increase mentioned above.
In doing so, the Hong Kong-based platform now surpasses FTX to become the second highest BTC OI, after Binance.
Following two consecutive increases, OKex’s dominance in the BTC futures market has risen from 7.2% to 18.1% since January 2022.
It seems that speculators favour the platform, especially for this specific type of contract, plausibly because OKex’s annualised yield on futures contracts is now the best in the market (2.2%).
In the derivatives markets, it’s all about yield, and OKex looks like a decent choice in the current environment.
Summary of this onchain analysis
In sum, this week’s data indicates that there is strong demand in the spot and derivatives markets.
The highly undervalued BTC price is attracting many entities that are engaged in fierce accumulation, buying several tens of thousands of BTC per week.
This accumulation dynamic is accompanied by a further drop in exchange reserves, with record outflows of more than 150,000 BTC in the last 25 days.
The BTC derivatives markets, meanwhile, have seen a major recovery, with open interest (OI) in BTC-settled futures reaching a new ATH.
OKex appears to be a key driver of this momentum, with its OI rising from 28,200 BTC to 92,900 BTC in seven months.
Speculative risk continues to grow, raising the possibility of a new wave of cascading liquidations in the event of high volatility.
Sources – Figures 2 to 8: Glassnode