
After hitting a new all-time high (ATH) of $125,000 in October, December ended with Bitcoin (BTC) losing its bullish momentum. Here’s a recap of the major events that shaped 2025!
A Year Full of Emotions
As the year draws to a close, TCCN offers you a comprehensive recap of the key on-chain dynamics shaping the Bitcoin (BTC) market.
Note that some of the observations presented below will serve as the basis for more in-depth analyses throughout 2026, so stay tuned until the very end!
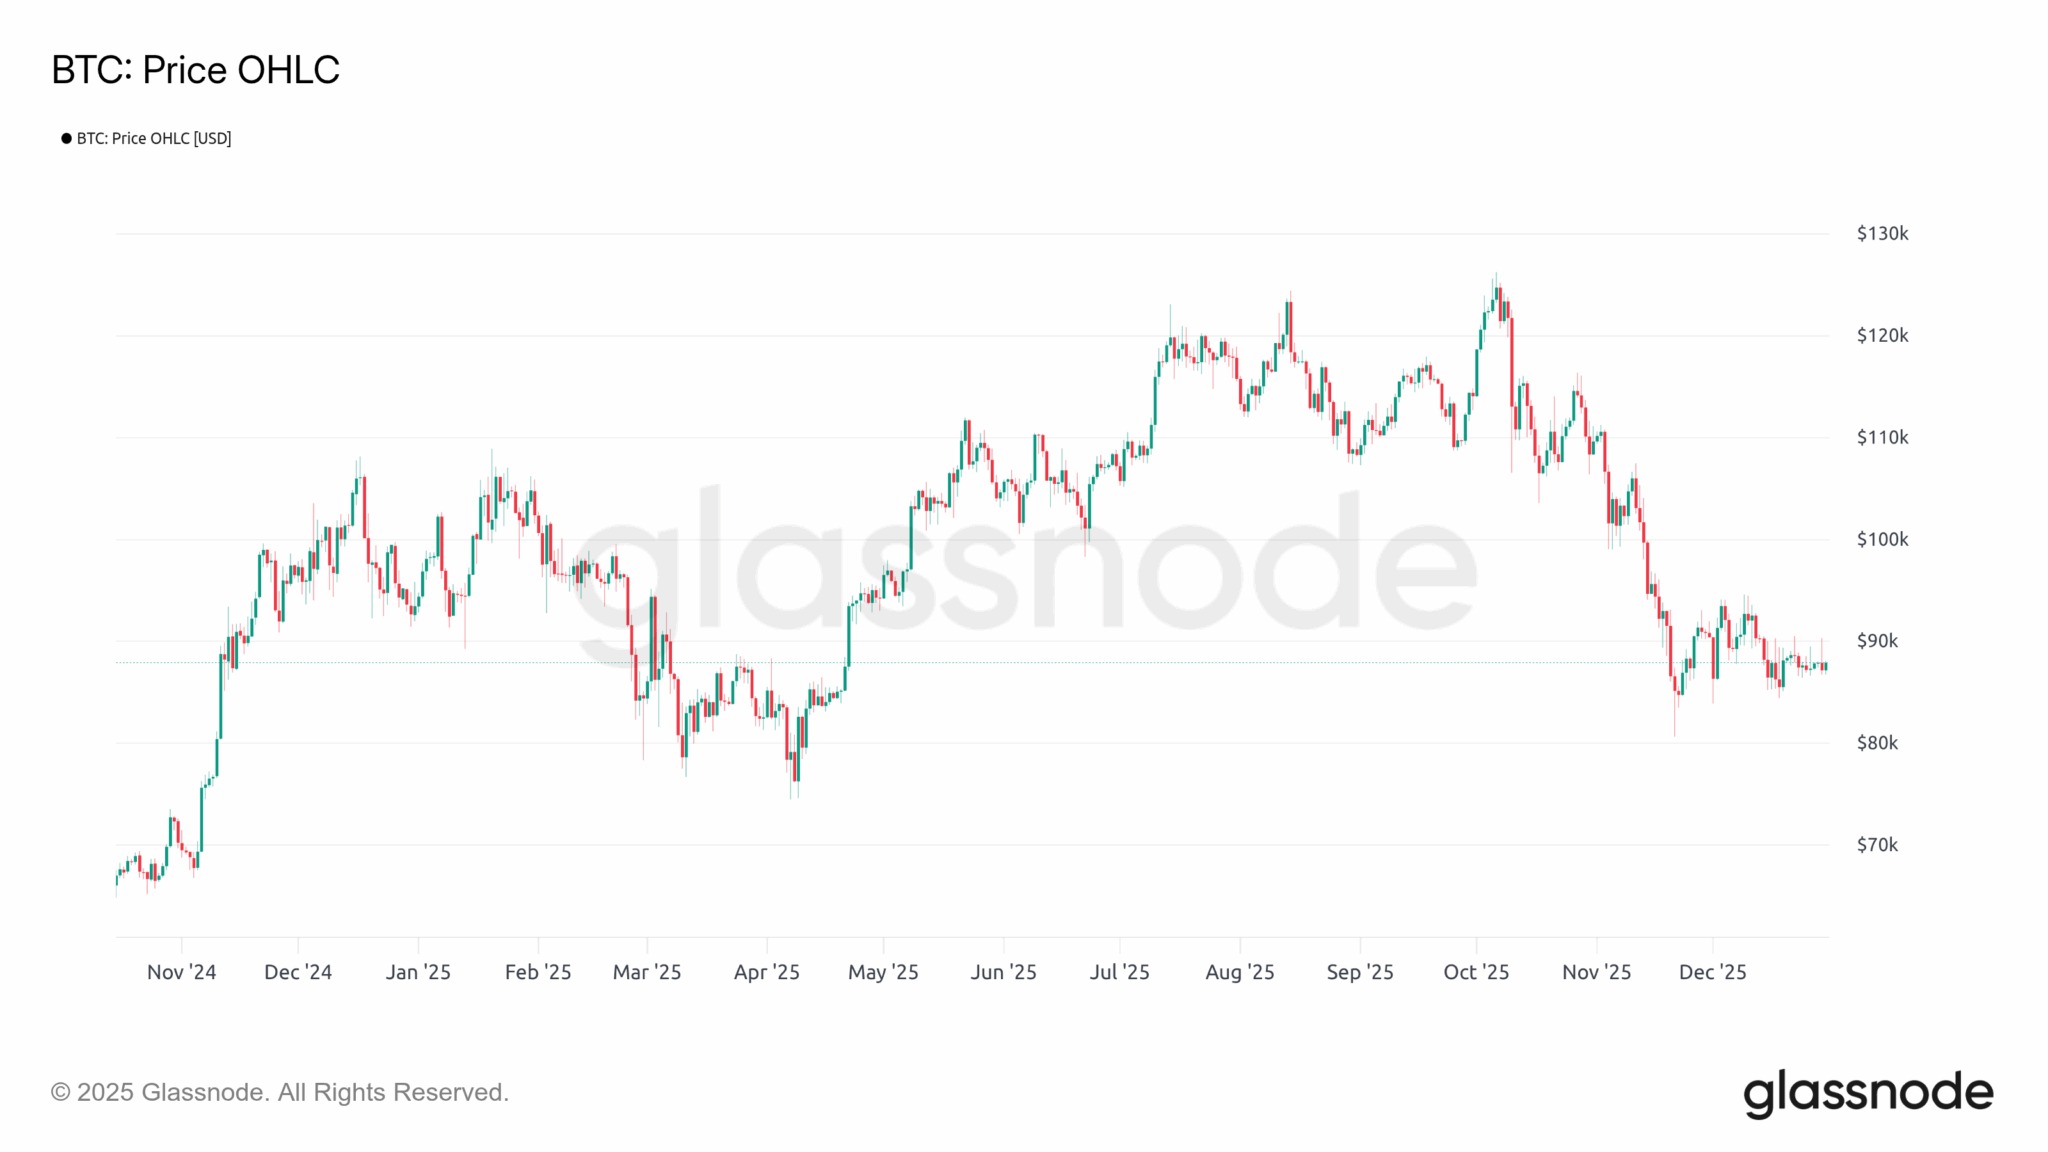
Figure 1: Daily BTC Price
Market Context
After a strongly bullish end to 2024, BTC’s performance in 2025 was rather mixed, with a significant shift in market structure during the winter.
The year 2025 was marked by a series of conditions visible through various metrics:
- bullish saturation at the start of the year;
- a test of confidence during the summer, followed by a resumption of the uptrend;
- a new bullish saturation in October;
- a second confidence test, followed by a loss of bullish momentum in November/December.
These dynamics are particularly evident in the chart showing the percentage of the supply in profit, which measures the amount of BTC held at a profit relative to the circulating supply.
Currently at nearly 65%, it fell below its historical average in October, plunging the market into a context of deteriorating profitability that historically precedes the onset of BTC bear markets.
To date, two scenarios are possible:
- The percentage of the supply in profit rebounds to exceed 65% again, offering investors a favorable environment for buying and taking profits;
- The percentage of the supply in profit continues to fall, reaching levels close to 60% to 50%, marking the advanced stages of a bear market.
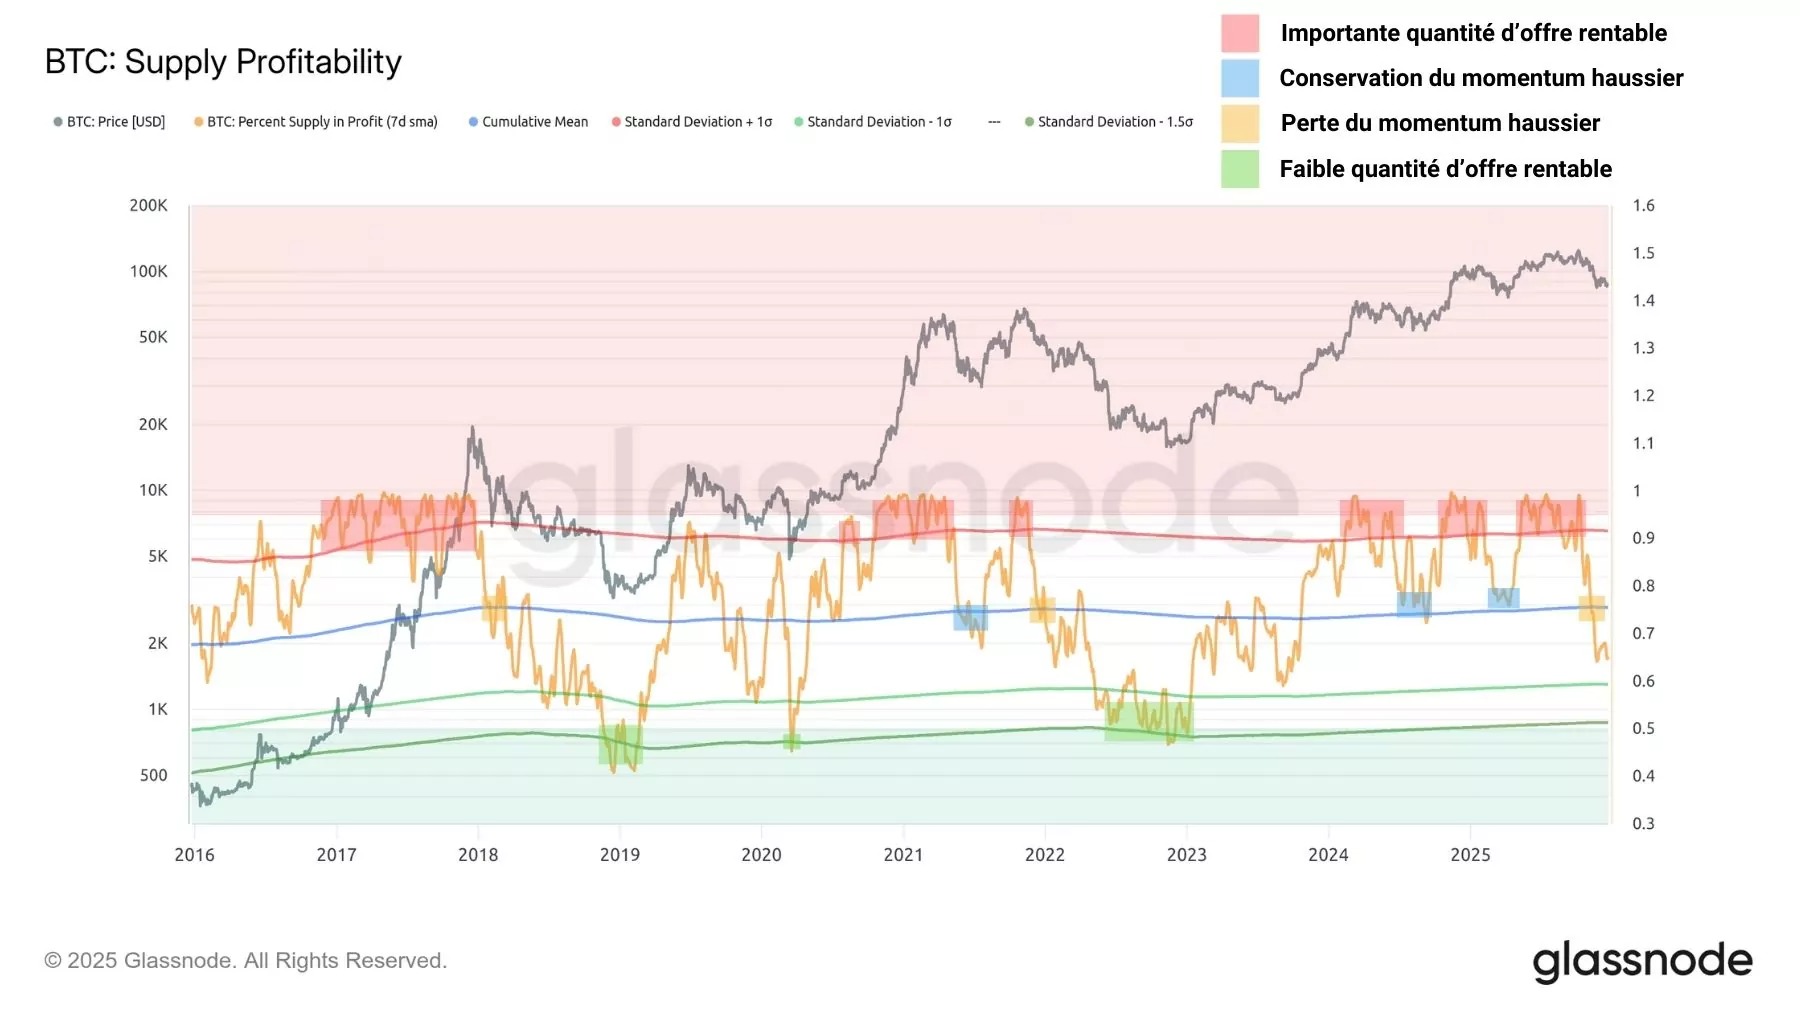
Figure 2: Percentage of BTC supply in profit
The MVRV ratio, which tracks the market’s average unrealized profitability, showed the following progression:
- bullish saturation at the start of the year;
- a test of confidence during the summer, followed by a resumption of the uptrend;
- no bullish saturation in October;
- a second test of confidence, followed by a drop below the historical average in November/December.
It is worth noting that BTC’s performance during the second half of 2025 was too weak to trigger a signal of latent profitability saturation.
This divergence between the MVRV and the BTC price at the end of 2025 foreshadowed a market slowdown and a deeper correction, which eventually materialized once the 100,000 level was breached.
The drop in the MVRV ratio below its historical average then confirmed BTC’s shift from a bullish regime (buying and profit-taking) to a bearish regime (selling and loss-taking).
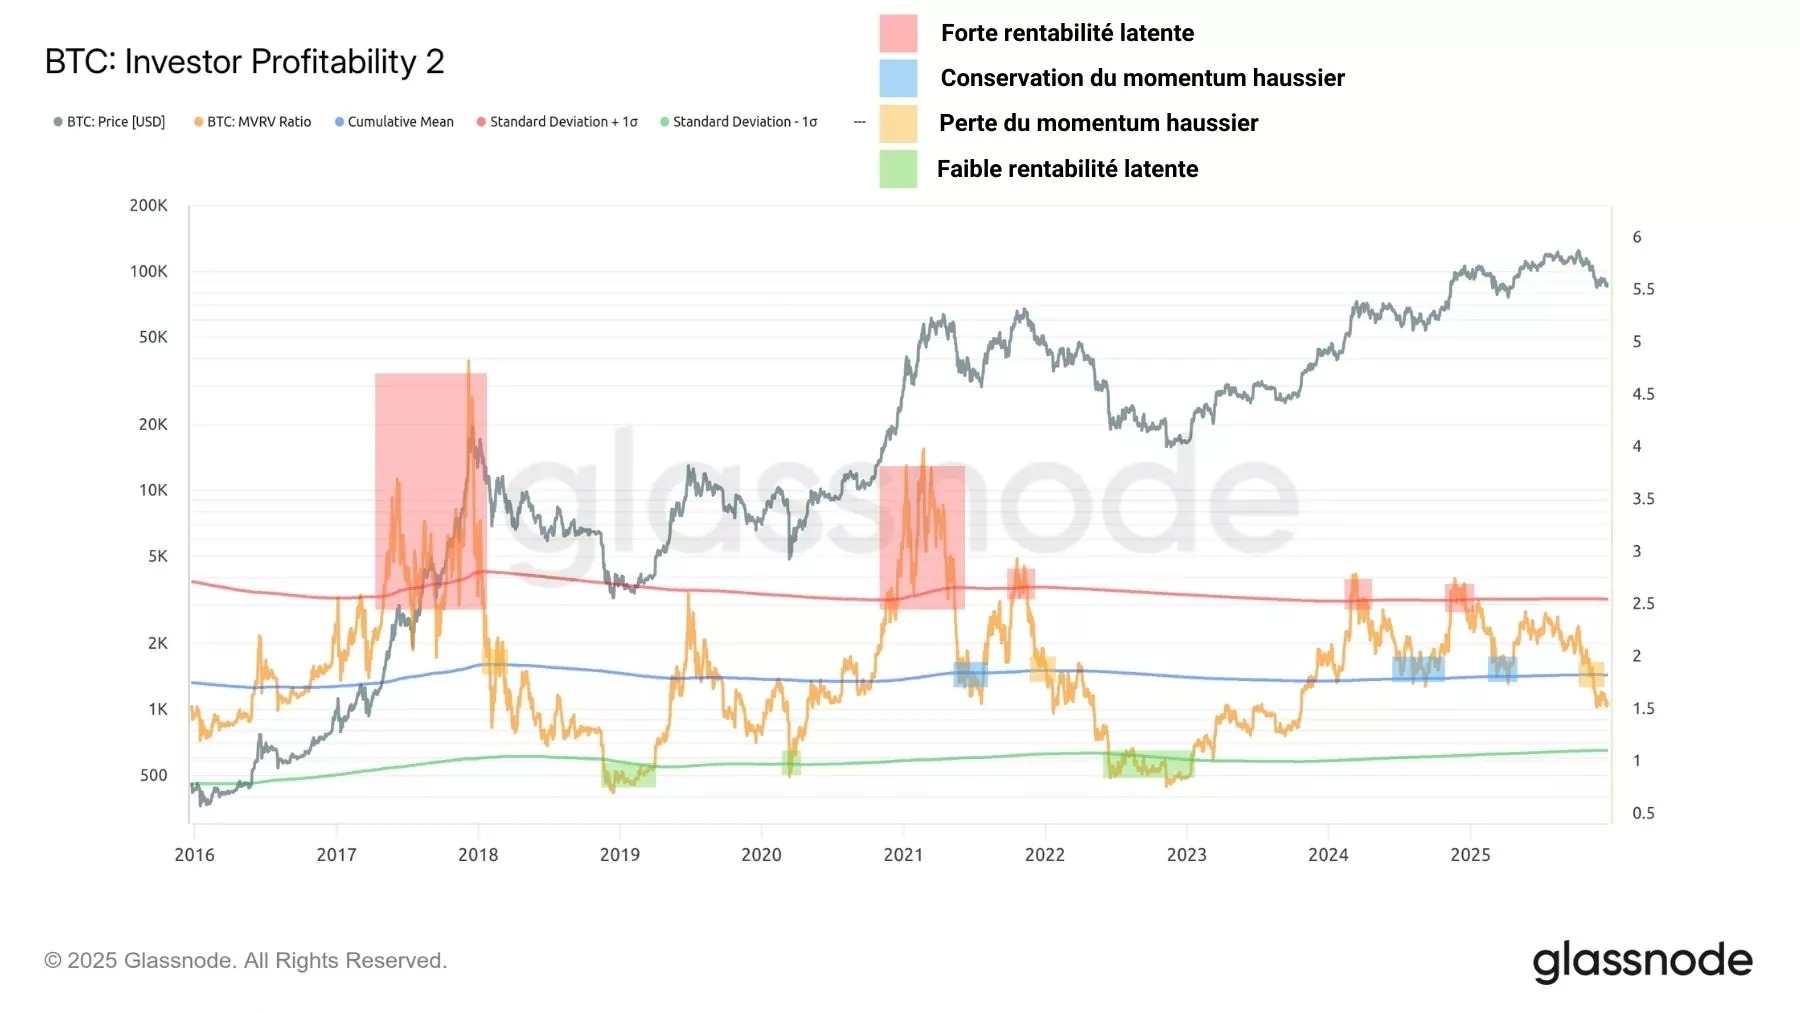
Figure 3: MVRV Ratio
The dynamics of the SOPR ratio, which tracks the degree of realized profit/loss, are identical to those of the percentage of the supply in profit:
- major profit-taking at the start of the year;
- test of confidence during the summer, followed by a resumption of the uptrend;
- further profit-taking in October, intensifying selling pressure;
- second test of confidence, followed by a drop below the historical average in November/December.
Since the SOPR has fallen below 1 for an extended period, it indicates that the average investor is liquidating their holdings at a loss, a phenomenon that typically occurs during transitions between bull and bear markets.
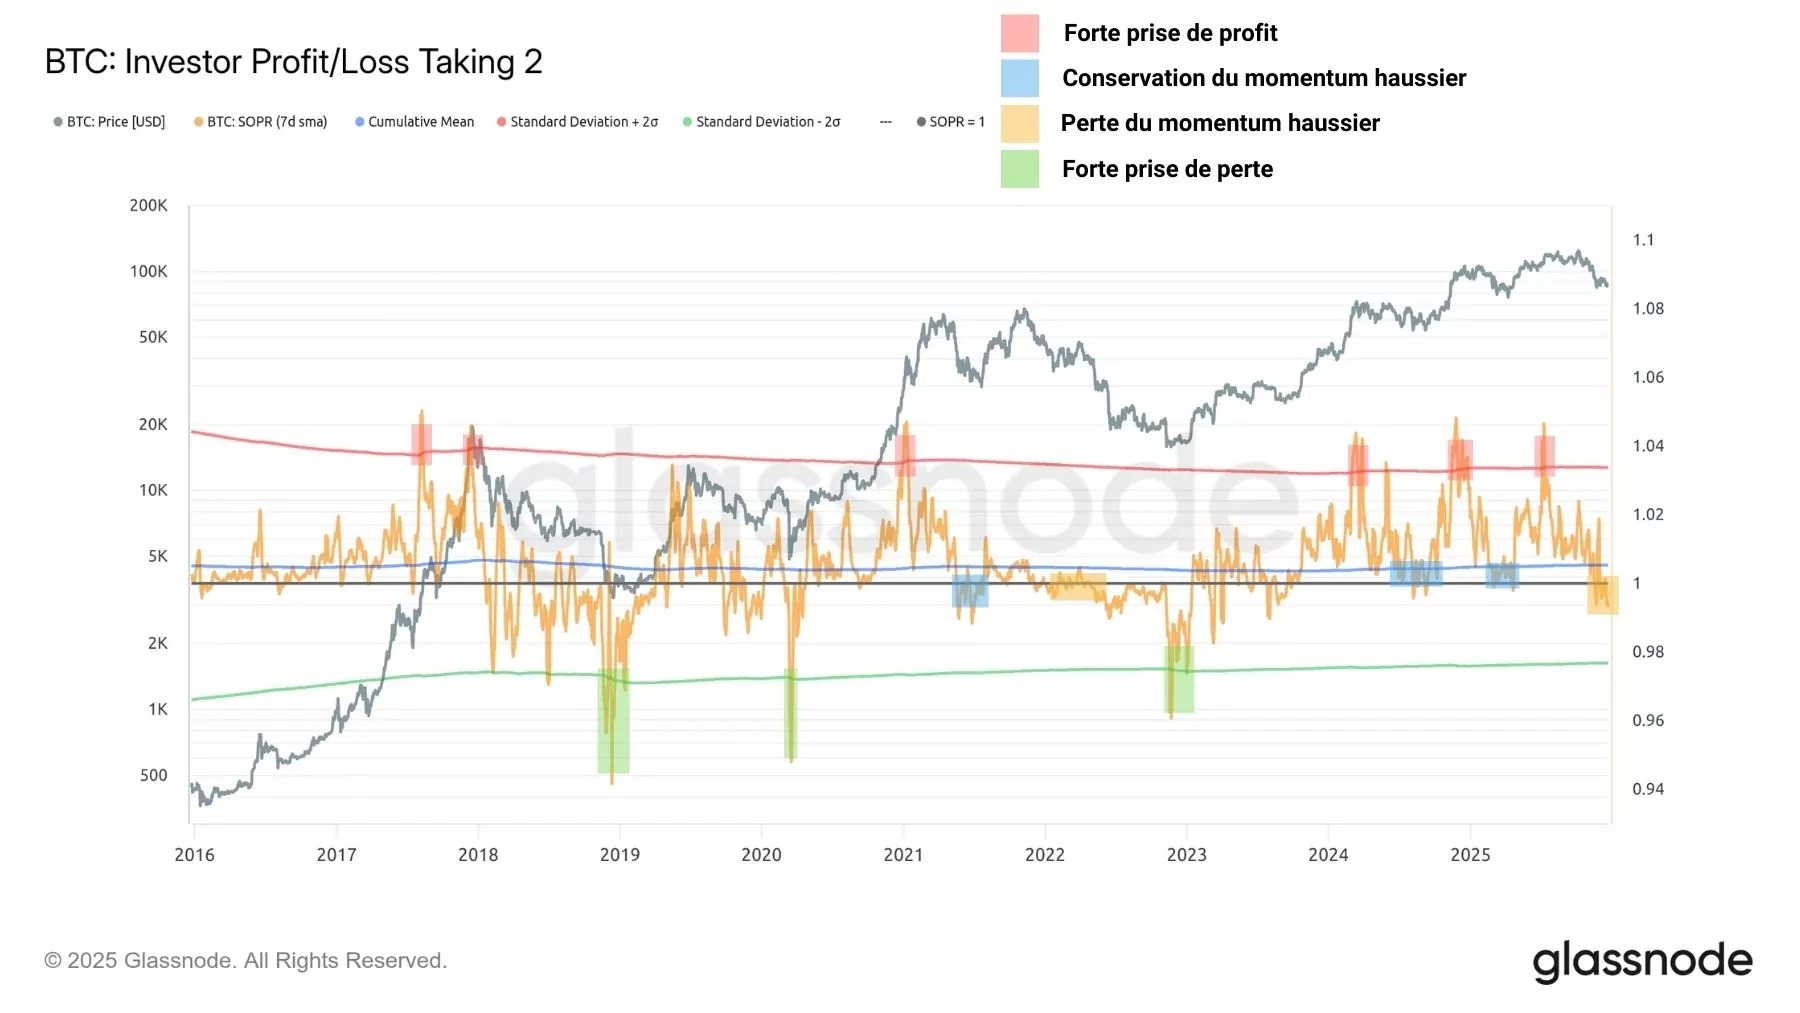
Figure 4: SOPR Ratio
Once the previous signals are consolidated into a single on-chain model, it appears that current market conditions are more indicative of a bear market than a bull market, suggesting that 2026 could be partly bearish.
However, supply and demand dynamics in early 2026 will need to be closely monitored to best assess the viability of a BTC bull market recovery.
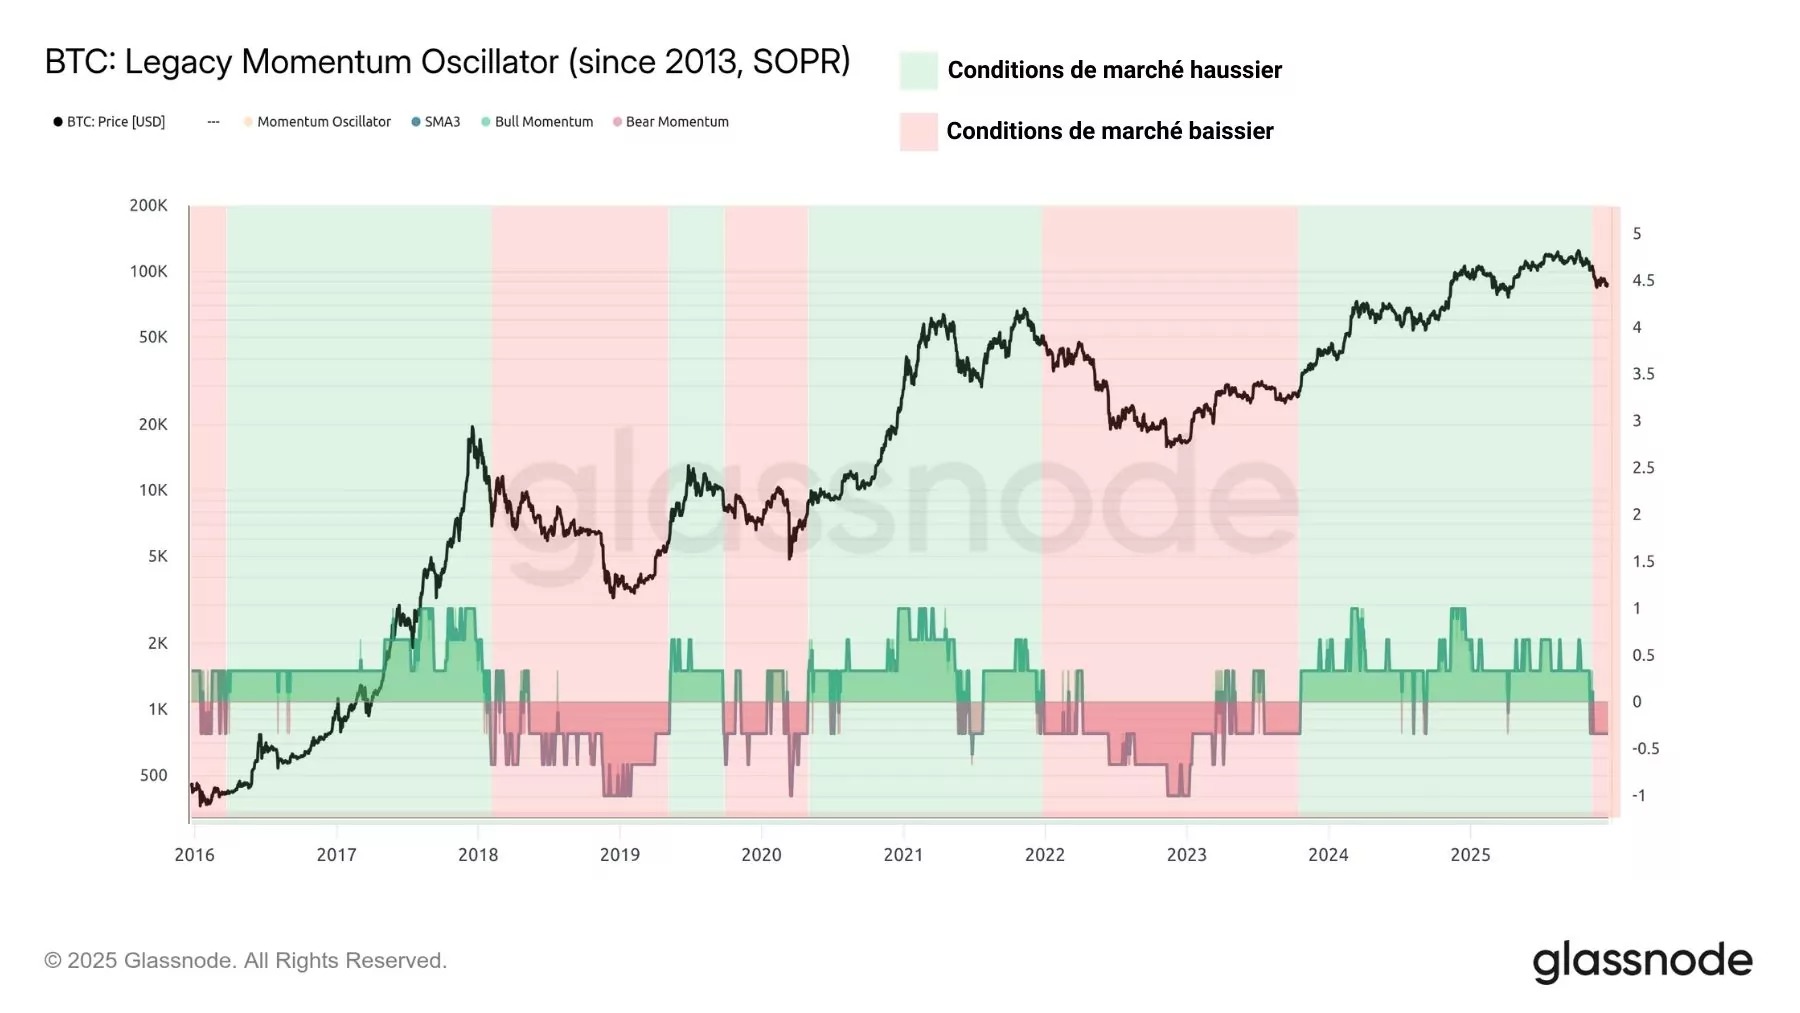
Figure 5: Composite on-chain model
Spot market distribution
In spot markets, the distribution of capital and the diversity of BTC holders also evolved throughout 2025.
Spot Bitcoin ETFs in the United States continued to accumulate, with over 100,000 BTC added to their reserves despite significant distribution accompanying the year-end correction.
These instruments remain one of the major channels for institutional capital in the BTC spot markets, totaling over 1.3 million bitcoins.
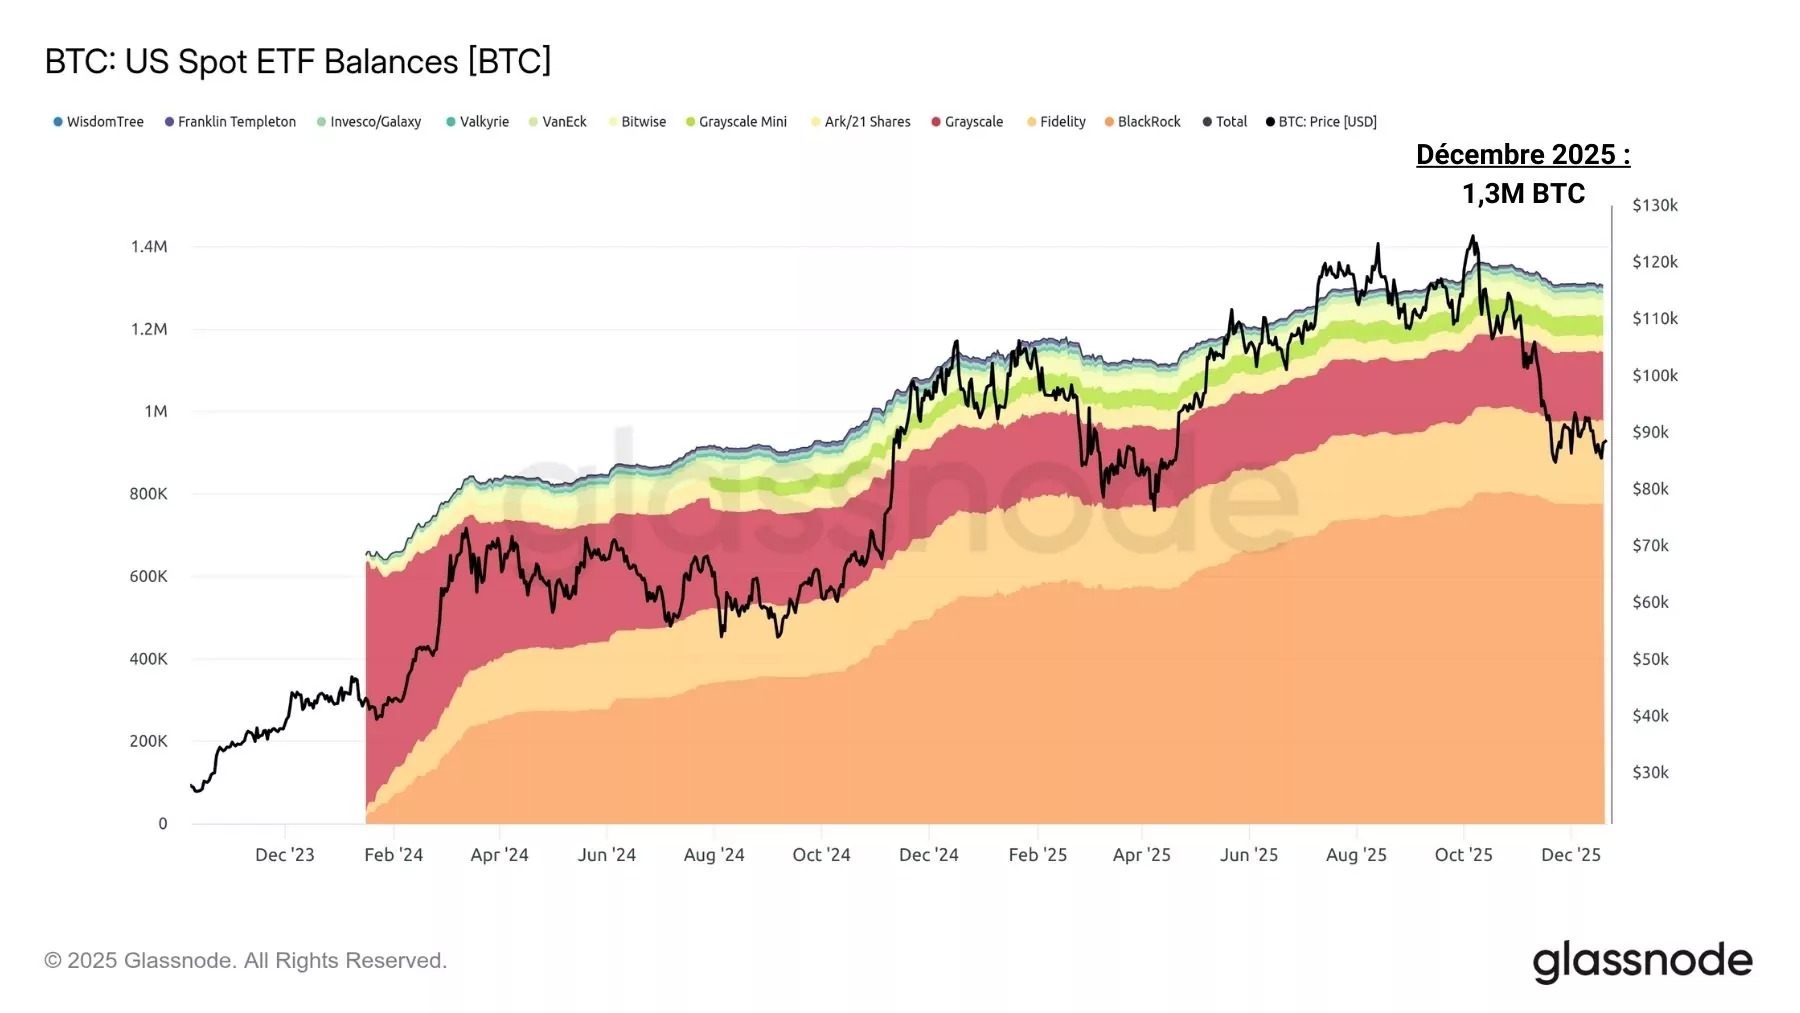
Figure 6: Bitcoin Reserves of U.S. Spot ETFs
Corporate treasuries account for a growing share of BTC held by private entities, with an increase from 600,000 BTC to over 1.3 million BTC since early January.
Companies such as MicroStrategy, MetaPlanet, and GameStop hold and continue to accumulate BTC via spot markets, fueling a sustained trend throughout the year.
However, it is important to note that the risks of financial distress and liquidation for these companies remain significant and will need to be closely monitored if the BTC downtrend continues below $80,000.
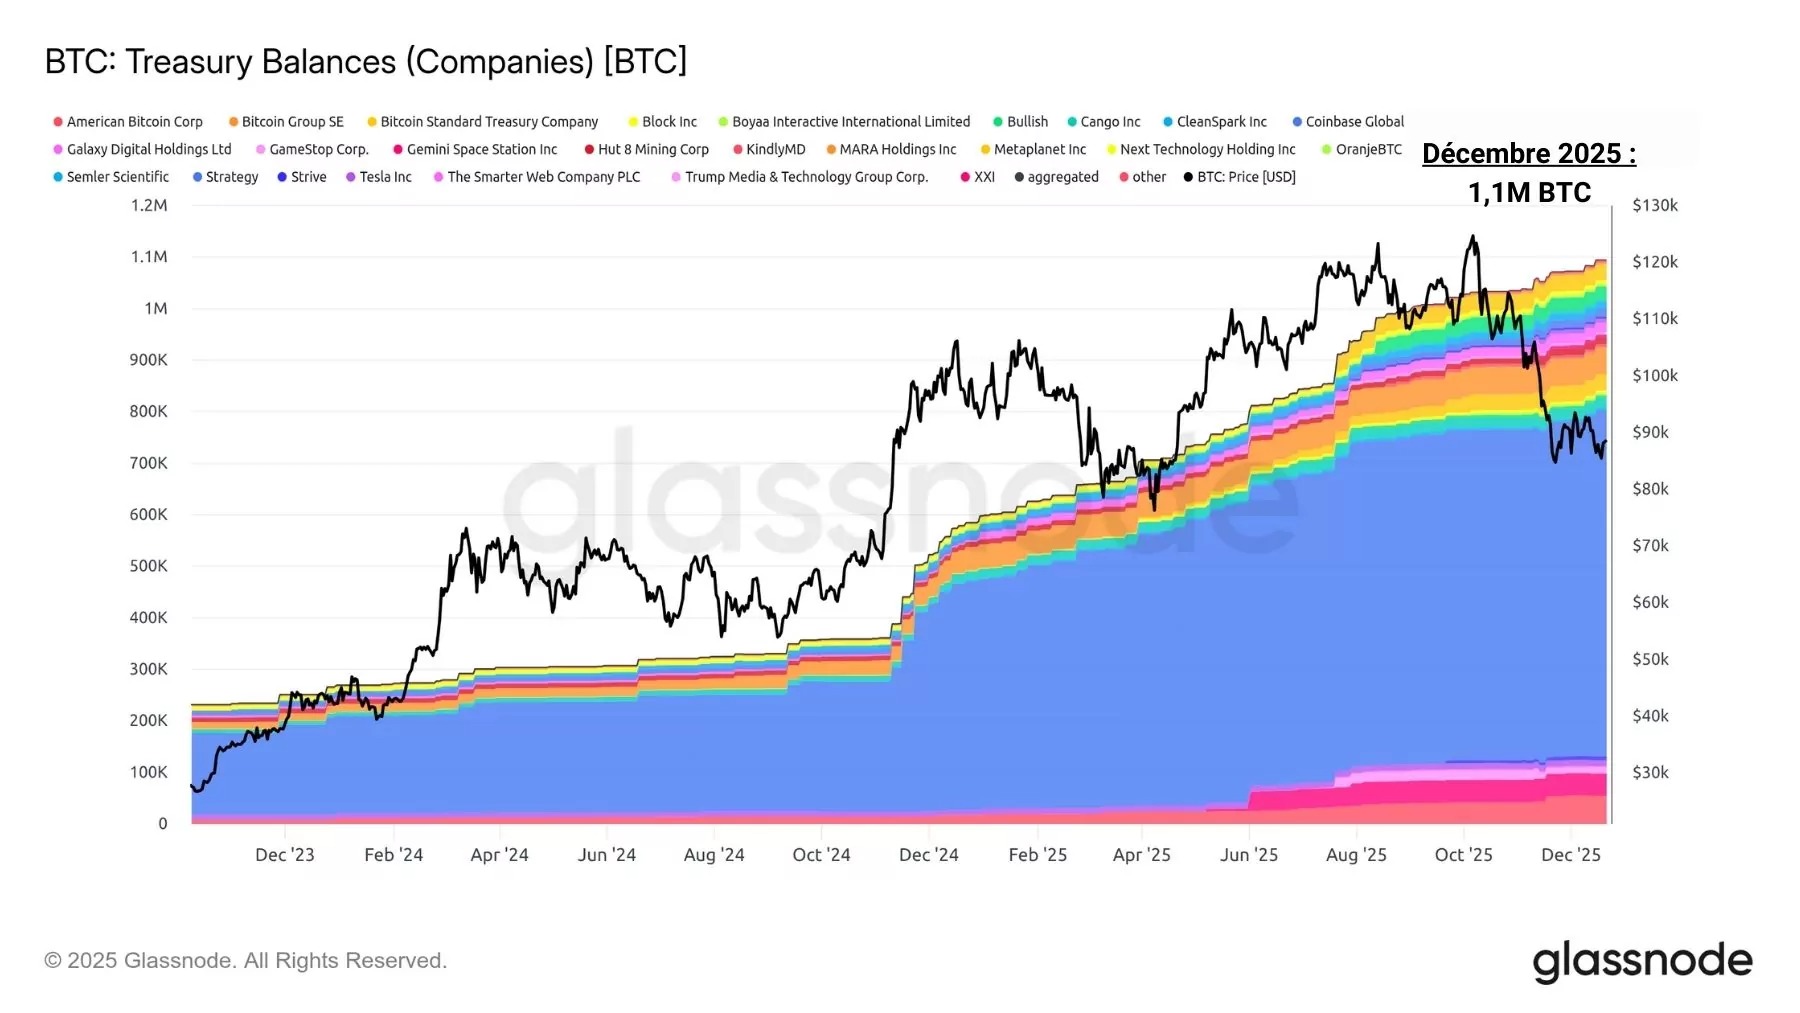
Figure 7: Bitcoin reserves of private treasuries
The treasuries of public entities, such as governments, constitute a small segment of the spot market and do not necessarily represent an actionable investment bias for tracking the BTC price.
The fact that the Salvadoran government regularly purchases BTC or that the German government liquidated its seized BTC did not represent a significant risk or opportunity signal during 2025.
There are currently approximately 615,000 BTC held by governments, an increase of about 100,000 BTC since the beginning of the year.
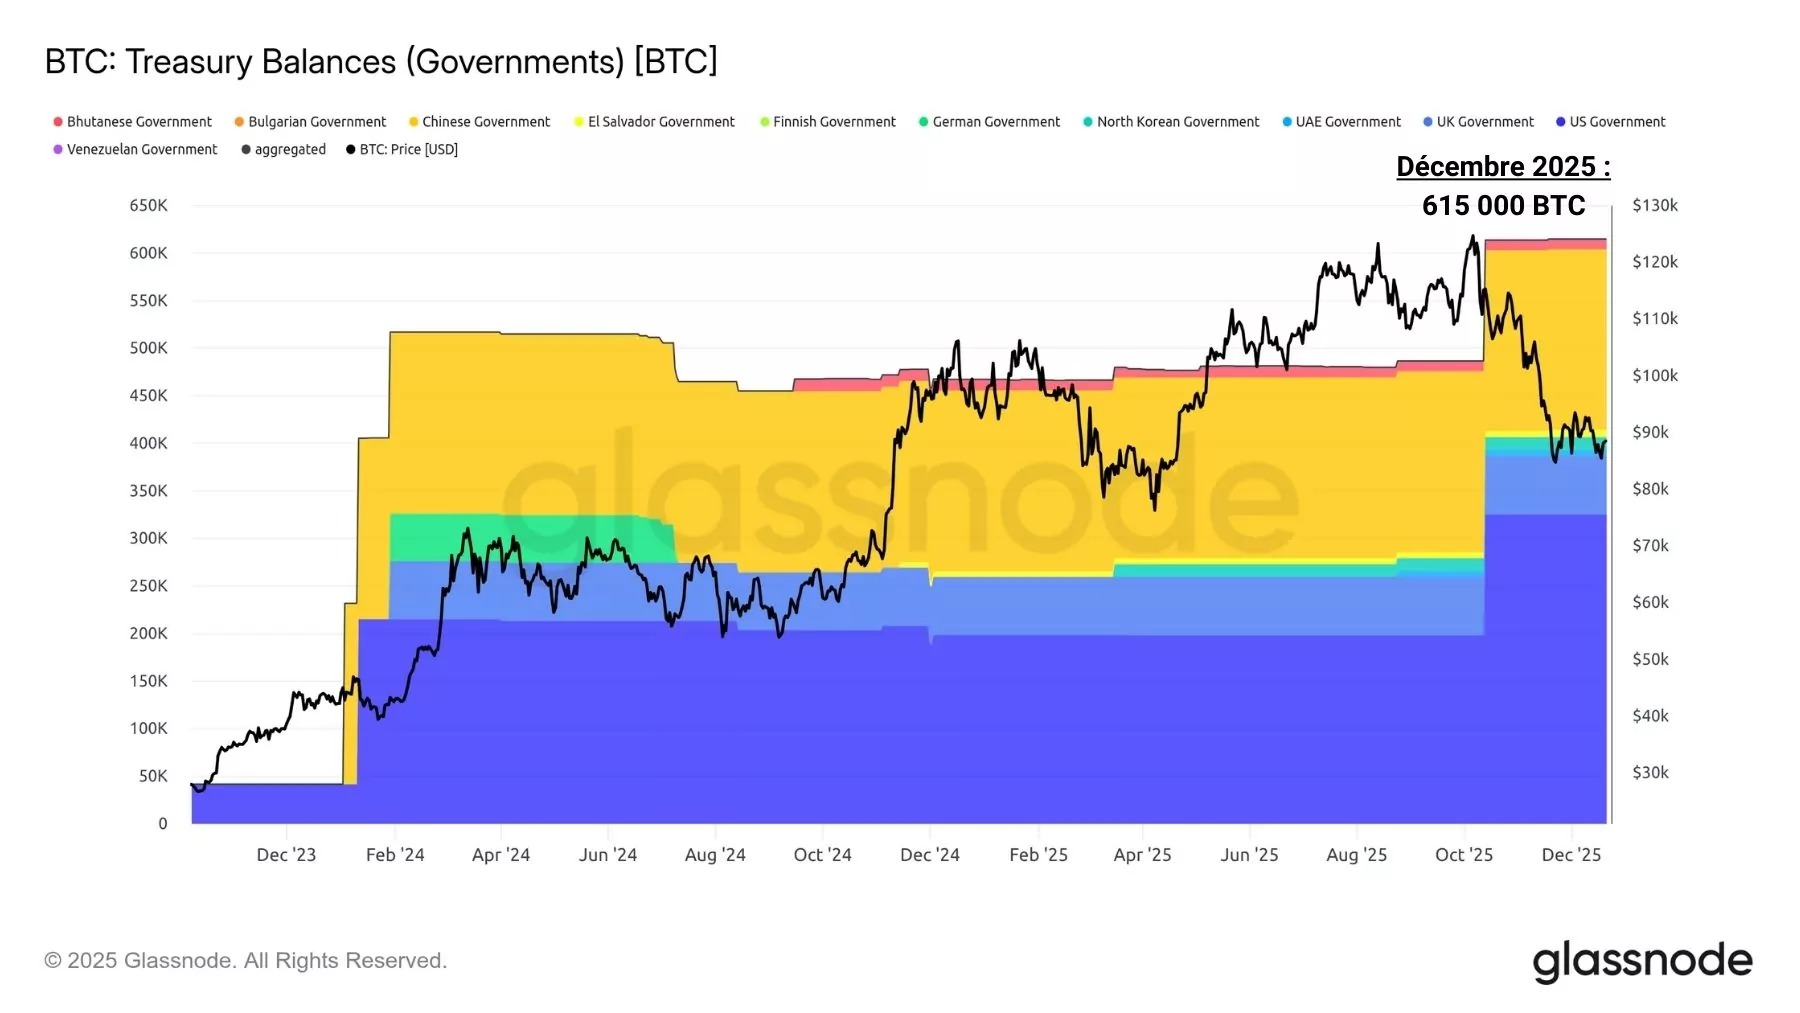
Figure 8: Bitcoin reserves of public treasuries
Combined, the three spot market segments examined earlier now exceed centralized exchanges in terms of cumulative reserves.
For the first time in BTC’s history, there are more bitcoins held by public treasuries, private corporate treasuries, and spot Bitcoin ETFs than on major exchanges such as Coinbase, Binance, or Kraken.
This marks a turning point in Bitcoin’s history, as spot markets expand to new holder profiles to the point where the original exchanges are gradually being surpassed by other methods of holding and investing.
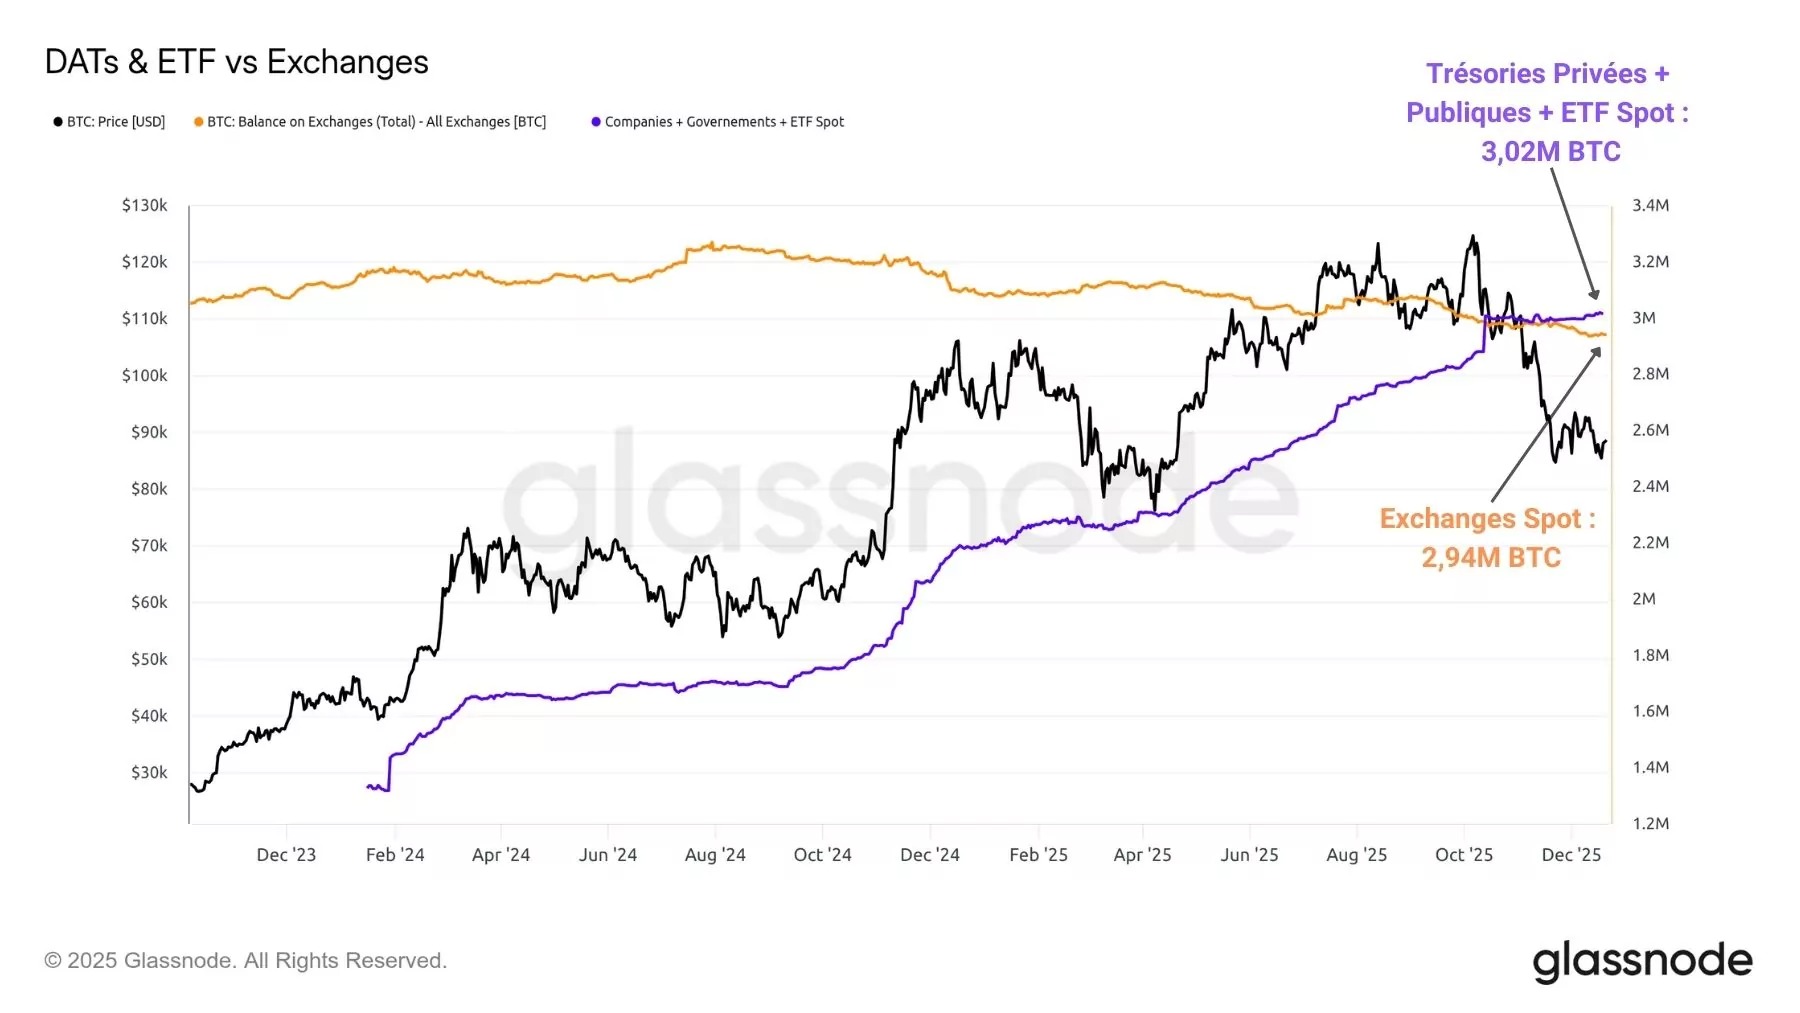
Figure 9: Spot Centralized Exchange Reserves vs.
Surprising Cyclicality
Contrary to expectations, the BTC price has maintained a surprisingly precise cyclical pattern over the last three bull cycles.
The time dimension appears to significantly impact the development of BTC’s bull and bear cycles between 2017 and 2025.
Indeed, the time elapsed between a halving and the subsequent cyclical peak has coincided surprisingly consistently across the last three bull cycles, with approximately 520 days post-halving to reach a new market high…