
As the Bitcoin (BTC) price continues to ping-pong between the high and low end of the current range, important demand signals continue to emerge. Despite the risky macroeconomic environment, encouraging market dynamics are building behind the scenes. On-chain analysis of the situation
Bitcoin (BTC) in a range
The price of Bitcoin (BTC) continues to oscillate within the range established since January 2021. This horizontal channel, which has been tested three times on the downside and four times on the upside, has managed to keep a lid on the price fluctuations between $36,500 and $44,000.
While the armed conflict between Ukraine and Russia is shaking the traditional markets, BTC is undergoing a massive accumulation phase that is not reflected in the current price of the asset.
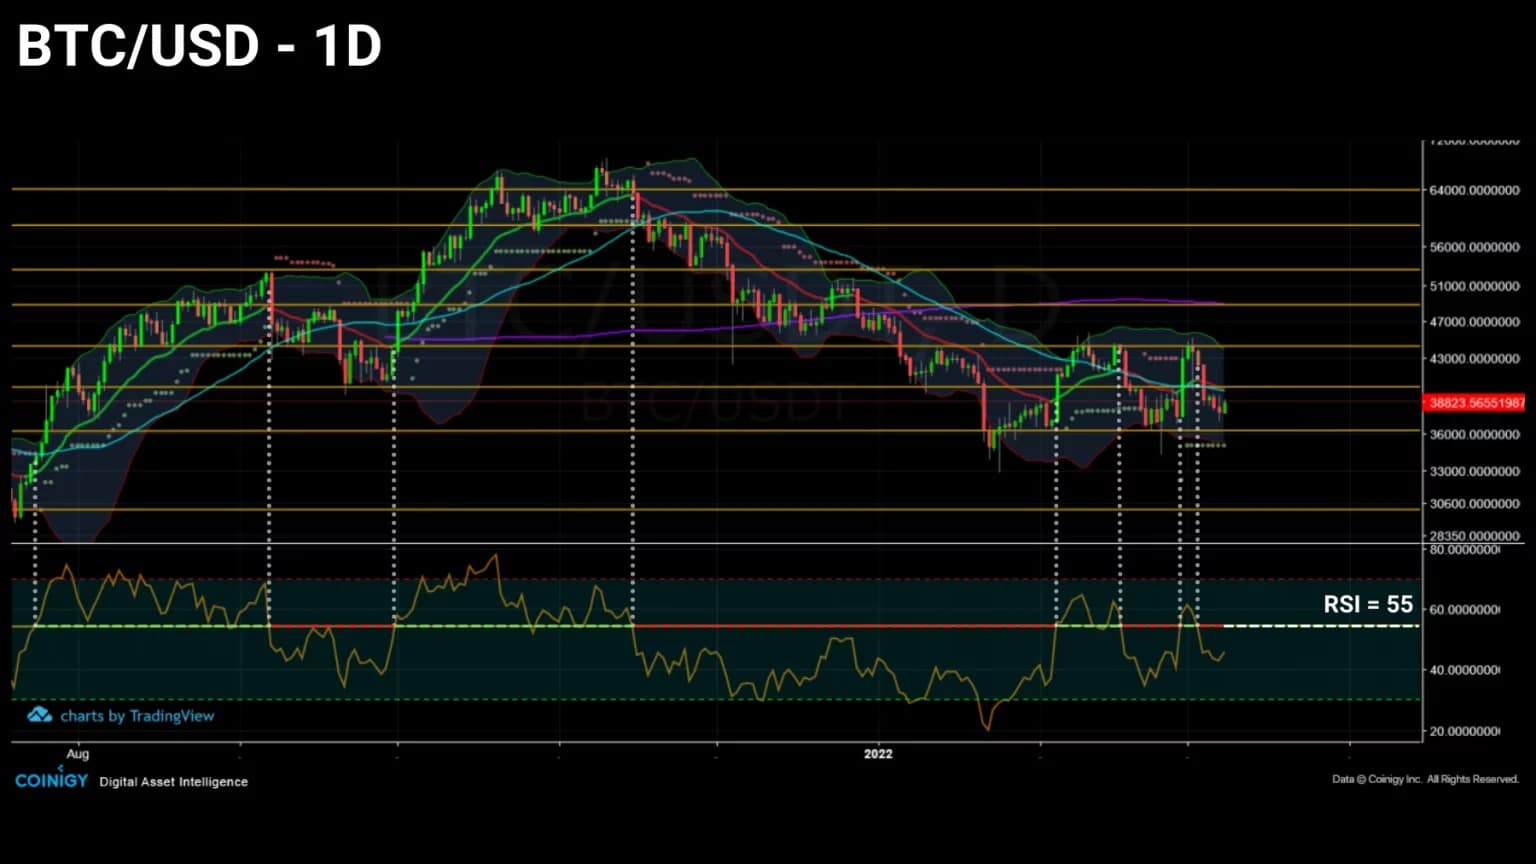
Figure 1: Daily price of bitcoin (BTC)
Recognized by some as a store of value, an insurance against inflation and fiat currency depreciation, bitcoin is slowly pushing individuals to study and then adopt its value proposition.
In order to gauge the extent of the accumulation underway, this week we will look at the buying behaviour of network addresses, the dynamics of Illiquid Supply and the supply/demand behaviour of Canadian institutional investors.
A mixed macroeconomic environment
Let’s begin this analysis with a look at the overall market situation, given the tense global environment.
While we mentioned the strong correlation between the traditional and crypto-currency markets in the previous analysis, it seems that the latter is experiencing a gradual decline since February.
Although positive and stemming from a direct causal locus between the fluctuation of the two sectors, the value of this correlation has not produced a new high despite the presence of several black swans regarding the global economic and geopolitical situation.
Going forward, should North American indices experience strong corrections, a decreasing correlation would indicate that bitcoin is decoupling from traditional financial indices and behaving as a low systemic risk asset.
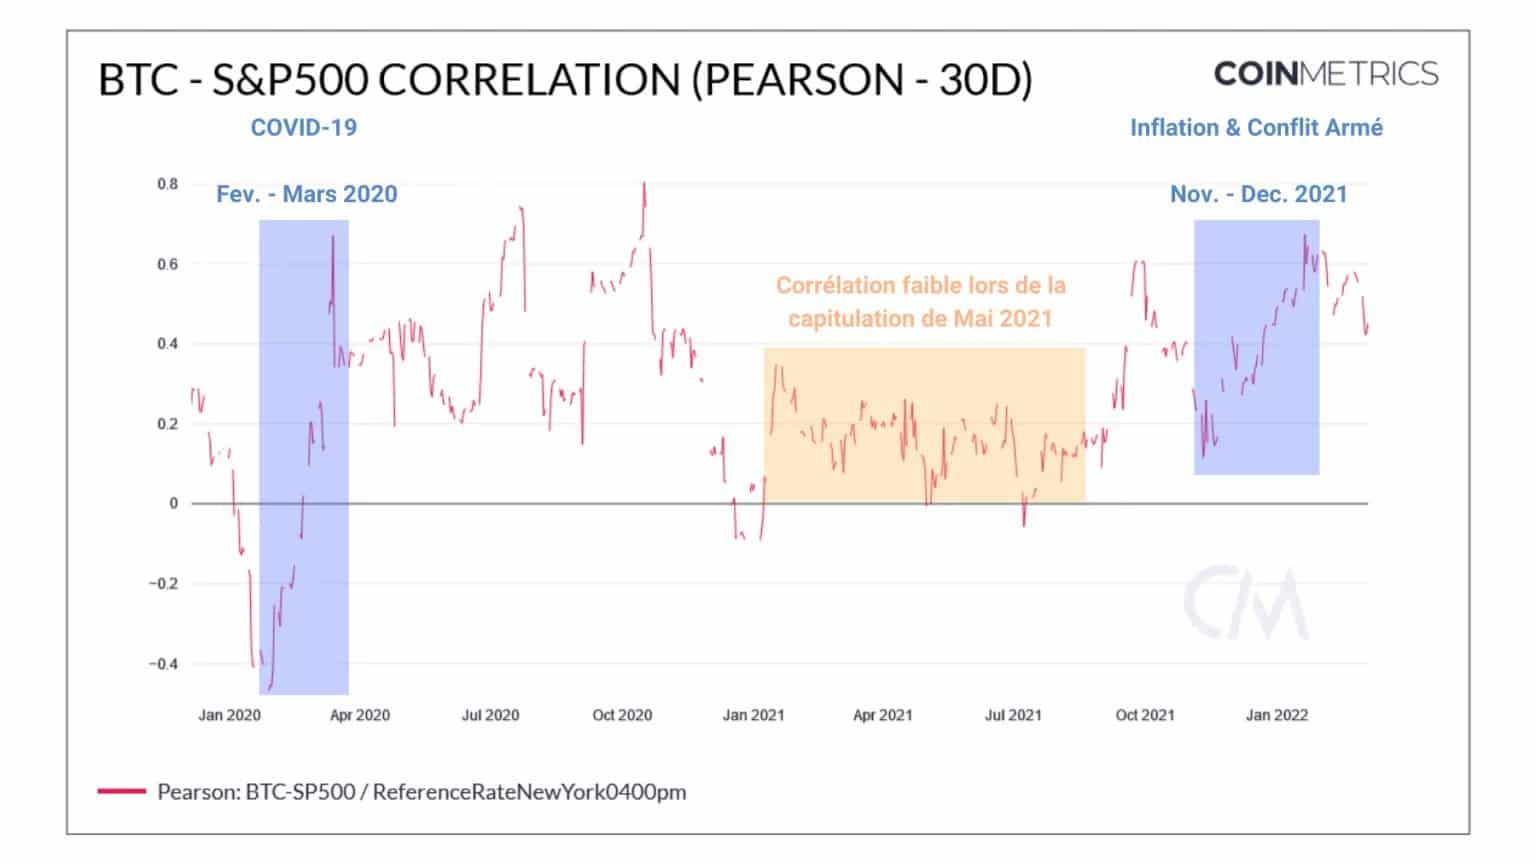
Figure 2: Correlation between bitcoin price and S&P500 index
The cost base for market participants is stabilizing.
In pink, the Short Term Investor Realized Price (STH), indicating the price at which BTC less than 155 days old were last moved, is above $46,000.
Representing the resistance that must be broken in order to confirm a sustained trend reversal, the historical relationship of this indicator with the BTC price provides excellent trend signals:
- bullish reversal: upward price crossing (blue) ;
- Urising continuation: support validated (green);
- bearish reversal: price crossing downwards (red);
- bearish continuation: resistance validated (yellow).
Situated above the current spot price, the STH cost basis indicates that this frail cohort is currently underwater.
Covering unrealized losses, this group of entities is indeed the most likely to generate additional selling pressure if the downtrend continues.
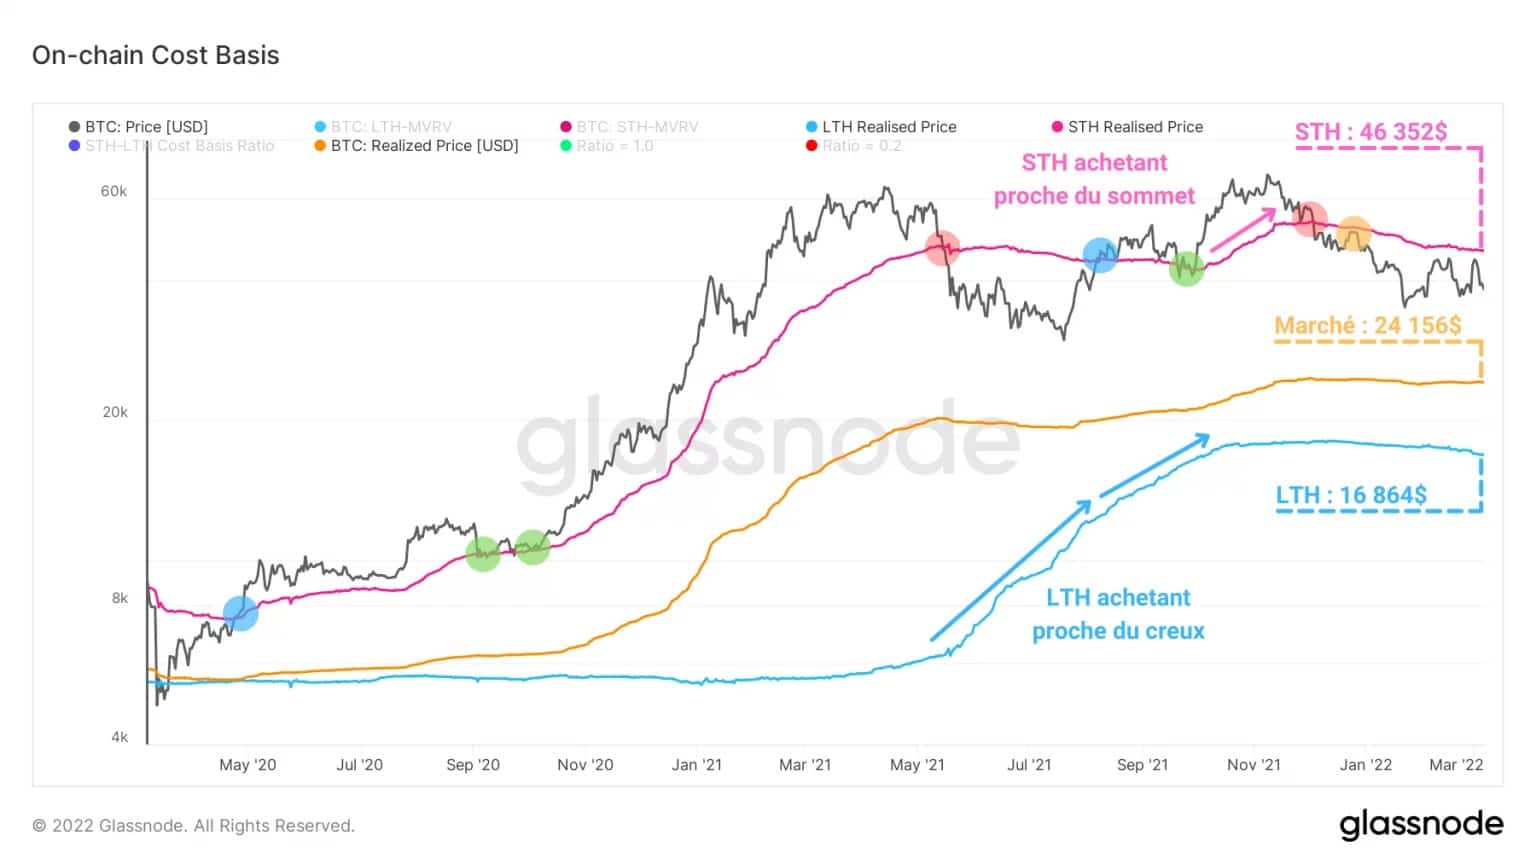
Figure 3: Basic on-chain costs
Despite this latent bearish energy, the amount of capital ready to be invested reached a significant low point on January 22.
The oscillator below is based on the ratio of the market capitalization of BTC to that of stablecoins. Reflecting the market’s buying capacity at a given point in time, this indicator is a proxy for the degree to which fiat capital is entering or exiting the cryptocurrency market.
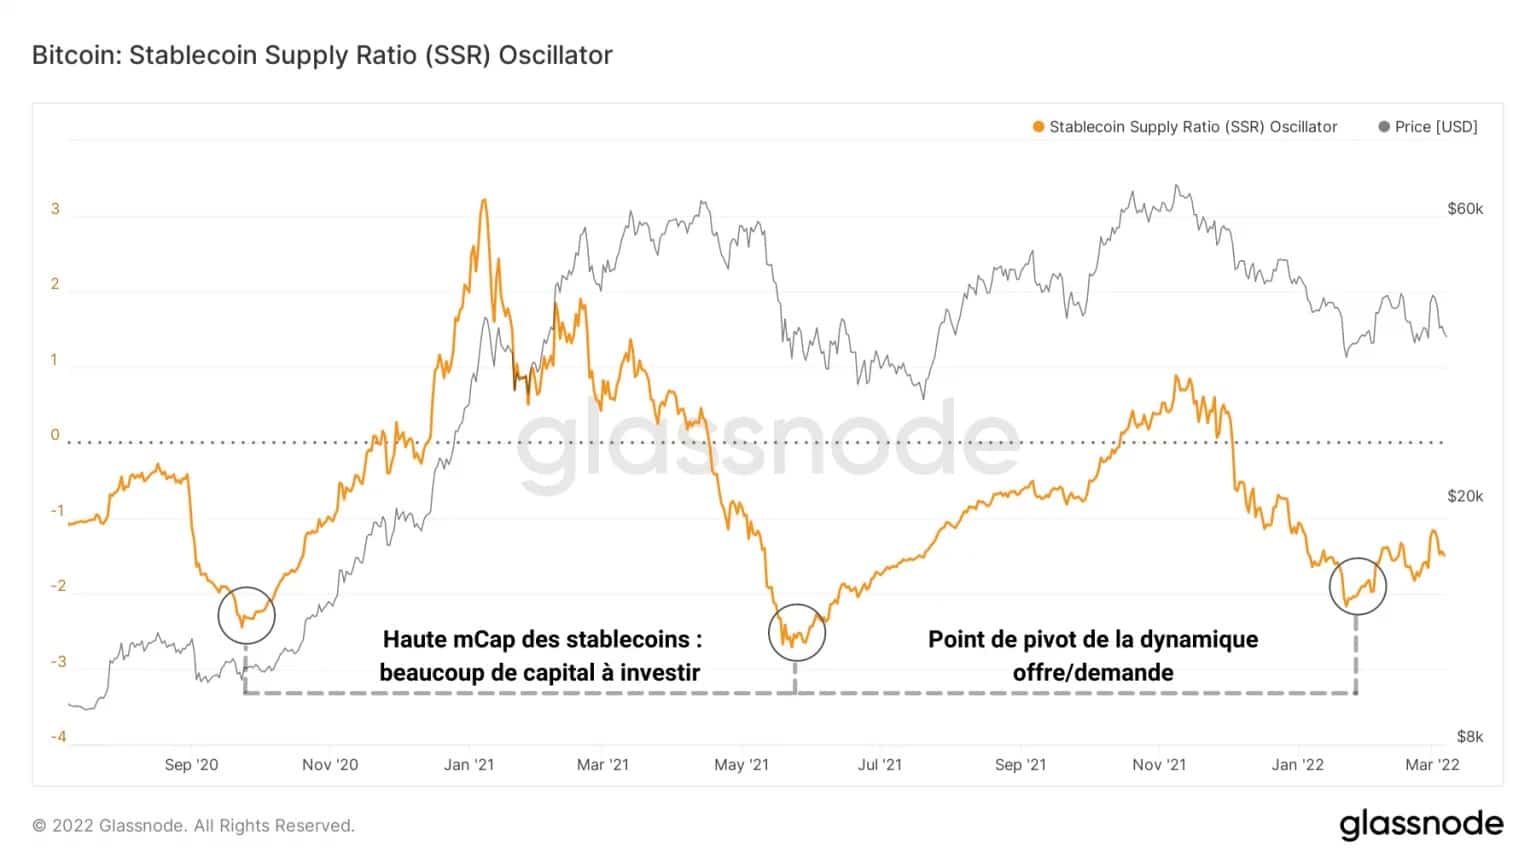
Figure 4: SSR oscillator
Informing us about the underlying supply/demand dynamics of the market, a high value indicates an exhaustion of participants’ buying power.
A low value therefore indicates a potential pivot point at which investors resume spending their stablecoins against bitcoin and engage in hoarding behaviour, not far from a potential market bottom.
Bitcoin accumulation reaches record highs
In order to get a concrete idea of this accumulation by various types of entities, let’s look at several metrics related to the retention of supply in circulation, notably through the so-called “illiquid” BTC.
The graph below represents the variation in the number of addresses with a non-zero balance (greater than zero) present on the network. We can clearly see a structural increase in this type of address, a sign of growing interest in the long term.
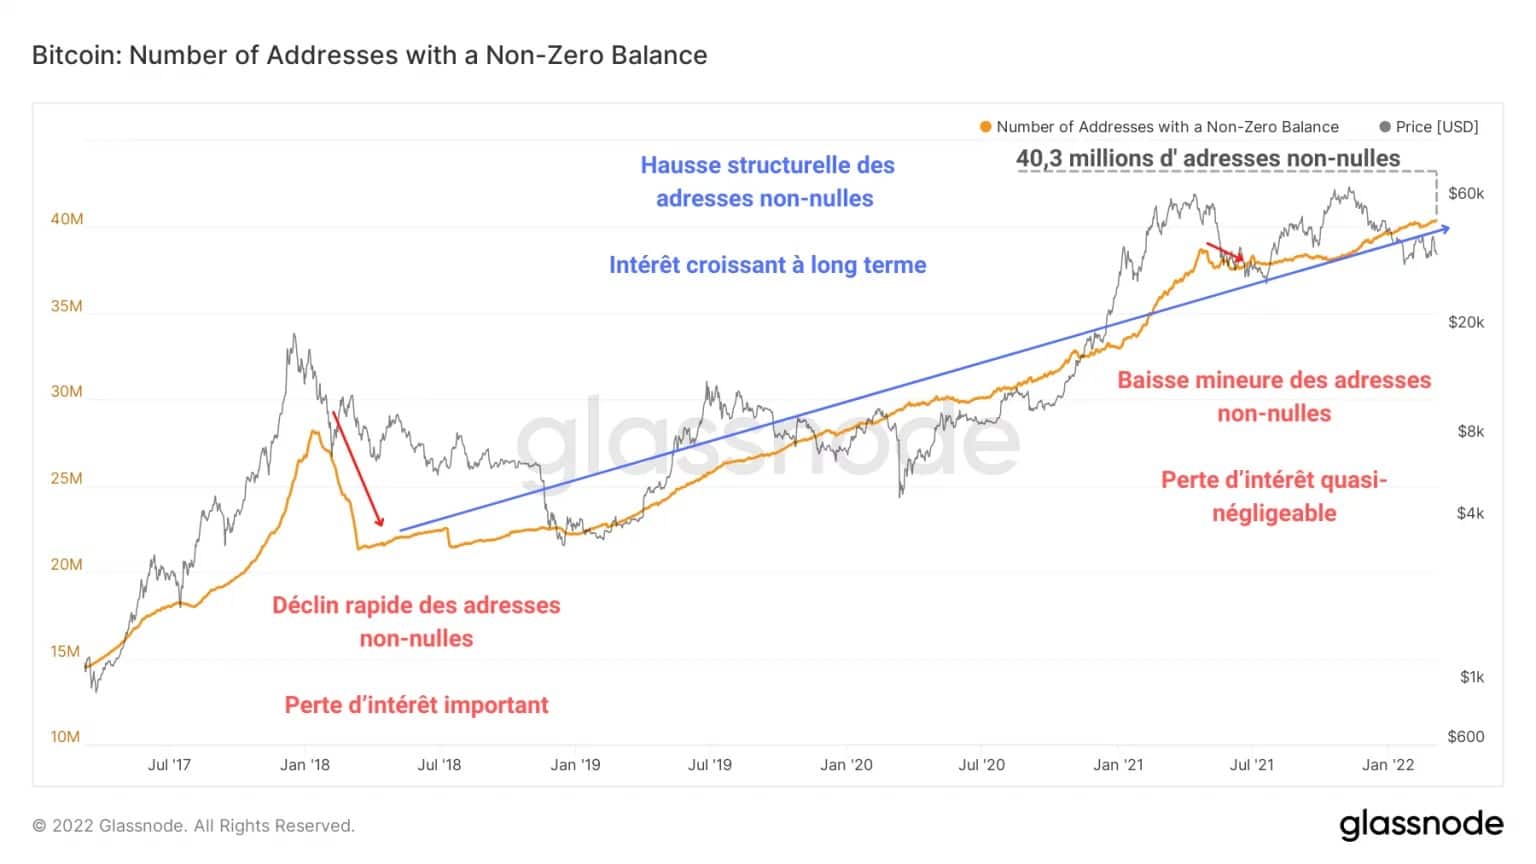
Figure 5: Non-zero balance addresses
By comparing the 2017 bull market peak with the May capitulation, we can determine that, despite the violent drop caused in mid-2021 and the ongoing correction, investors are still accumulating BTC and not looking to exit the market.
This lack of panic on the part of HODLers is also evidenced by the continued increase in the number of addresses in accumulation throughout 2021 and 2022.
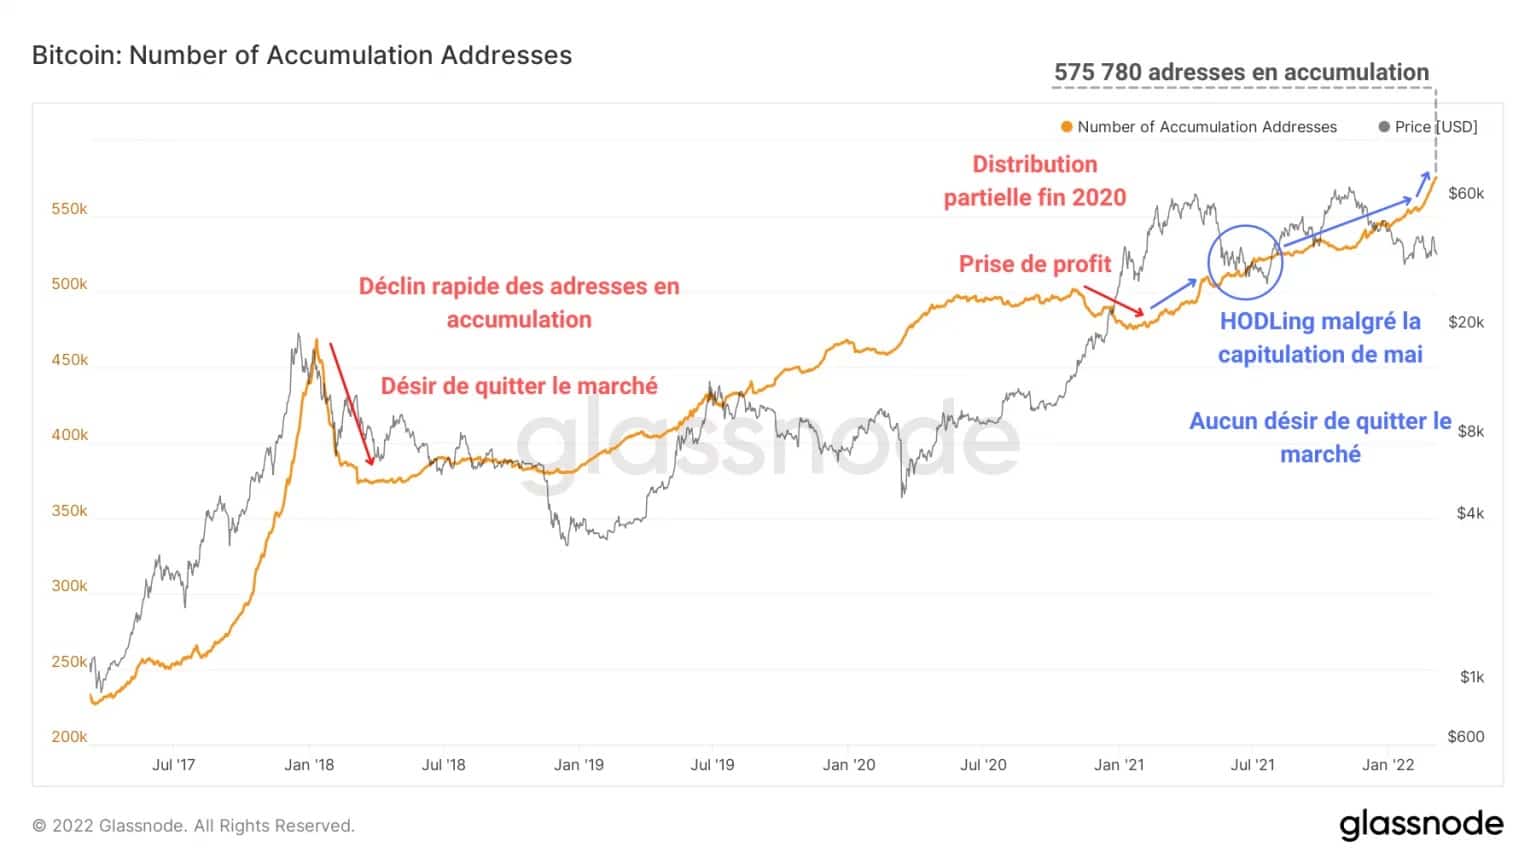
Figure 6: Addresses in a state of accumulation
This phenomenon results in a very present HODLing behaviour during downturns and a continuous increase in the number of addresses in accumulation, using for many of them a dollar cost averaging (DCA) strategy.
Another method of observing accumulation consists of separating the supply circulating on the market into different degrees of liquidity or availability.
So as not to make this analysis too long, here is the link to the research paper by Rafael Schultze-Kraft, CTO and co-founder of Glassnode, detailing this method in depth.
What emerges is that the relationship between Illiquid Supply and the sum of liquid and highly liquid supply (referred to here as “Liquid Supply” for simplicity) identifies different supply dynamics that cannot be captured through technical analysis.
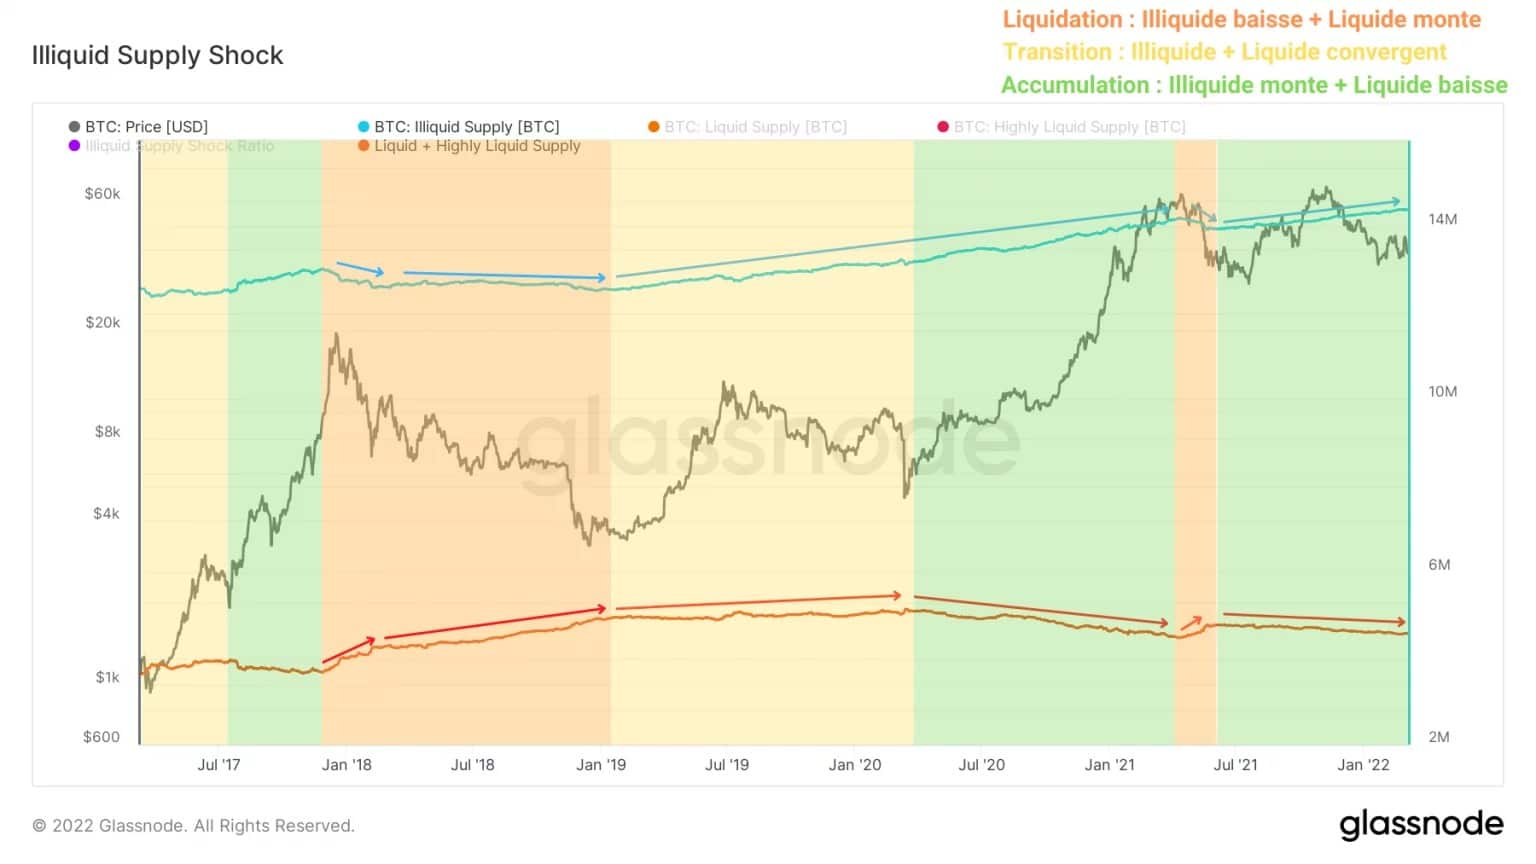
Figure 7: Illiquid and Liquid Supply
Thus, the 2018 and May 2021 sell-offs show a liquidation of supply (in orange). BTC previously excluded from circulation – often stored in cold storage – are then transferred to the exchange platforms in order to be sold.
This dynamic identifies a global panic behaviour that can even shake some long-term investors, who are known for their coolness.
At the opposite end of the spectrum is the phase in which the market has been evolving since July 2021. Here, BTC are leaving the exchanges with the intention of being held for the long term. By removing BTC from circulation, this phenomenon increases the pool of illiquid BTC and indicates high confidence on the part of participants.
Corroborated by the Illiquid Supply Shock Ratio chart, this finding unequivocally confirms a salient fact: no analyst has experienced such a market structure before. For the first time in its history, bitcoins are being accumulated in a massive way while the BTC price is still at -44% of its ATH.
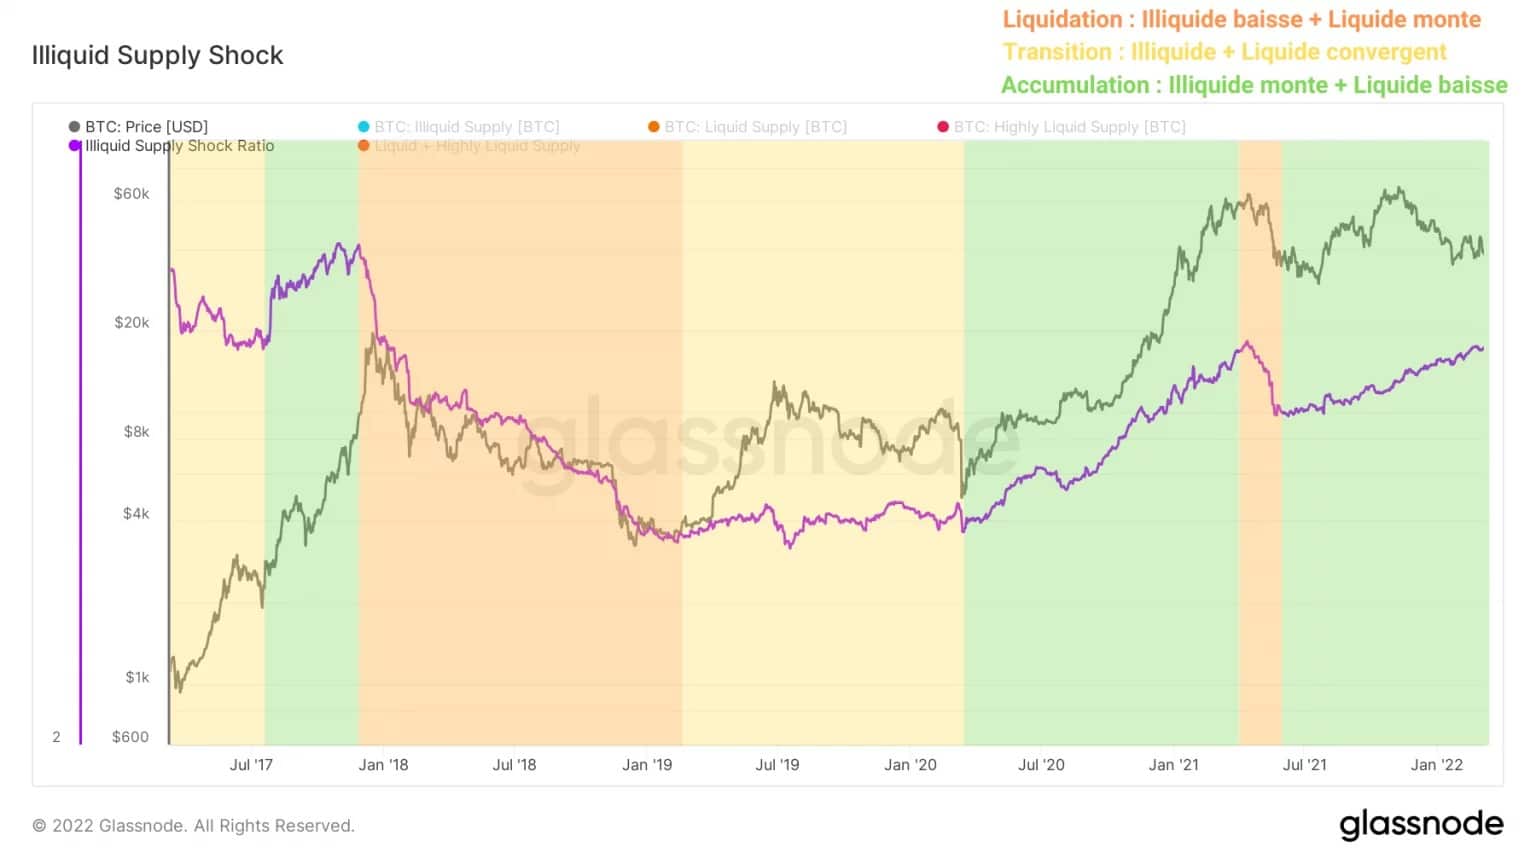
Figure 8: Illiquid Supply Shock Ratio
The Illiquid Supply Shock Ratio represents the ratio of Illiquid Supply to Liquid Supply and identifies when enough BTC is withdrawn from circulation to give a bullish liquidity shock, in the event of strong spot demand.
Growing steadily since the May capitulation, this indicator sends a clear signal that the market is in a massive accumulation phase despite a strong correction and there is no indication that investors want to exit the market at this time.
Canadian institutional investors are entering the fray
Finally, let’s turn to Canadian institutional investors. A particularly young cohort, it consists of two ETFs (3IQ Coinshares Bitcoin and Purpose Bitcoin) and an investment fund: QBTC.U, also run by the investment firm 3IQ.
Arriving in early 2020 at the earliest, these three funds are pioneering institutional investment in bitcoin in North America and introducing a new source of supply and demand to the market.
Indeed, the number of BTC held by these entities, as well as their spending and saving behaviour, provide an accurate proxy for institutional demand to date.
The QBTC.U fund, the oldest of the siblings, for example, began a powerful buying spree in September 2020, almost tripling its exposure, before abruptly selling half of its BTC at the end of May 2021 following the capitulation.
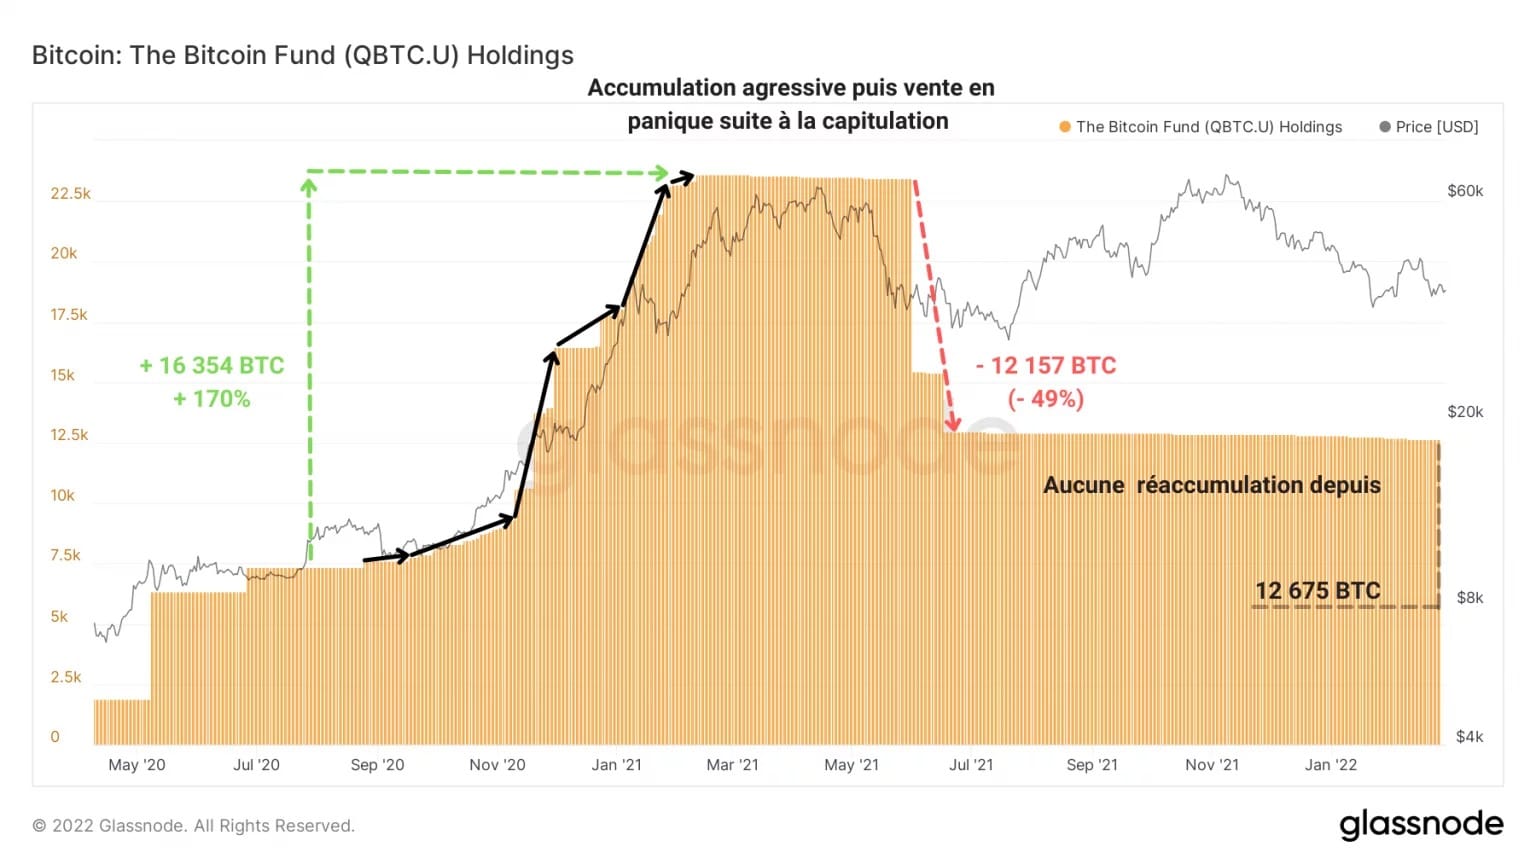
Figure 9: QBTC.U fund’s BTC holdings
No re-accumulation has followed this decision, so the fund’s BTC holdings are gradually declining, now estimated at 12,675 bitcoins. There is no sign of a move away from this conservative strategy at this time.
Also under the aegis of 3IQ, the 3IQ Coinshares Bitcoin Spot ETF has applied a more conservative management approach. The fund quickly acquired nearly 20,000 BTC in the weeks leading up to the May capitulation, but has subsequently liquidated only a small portion of its exposure and is stagnating without showing any specific behaviour.
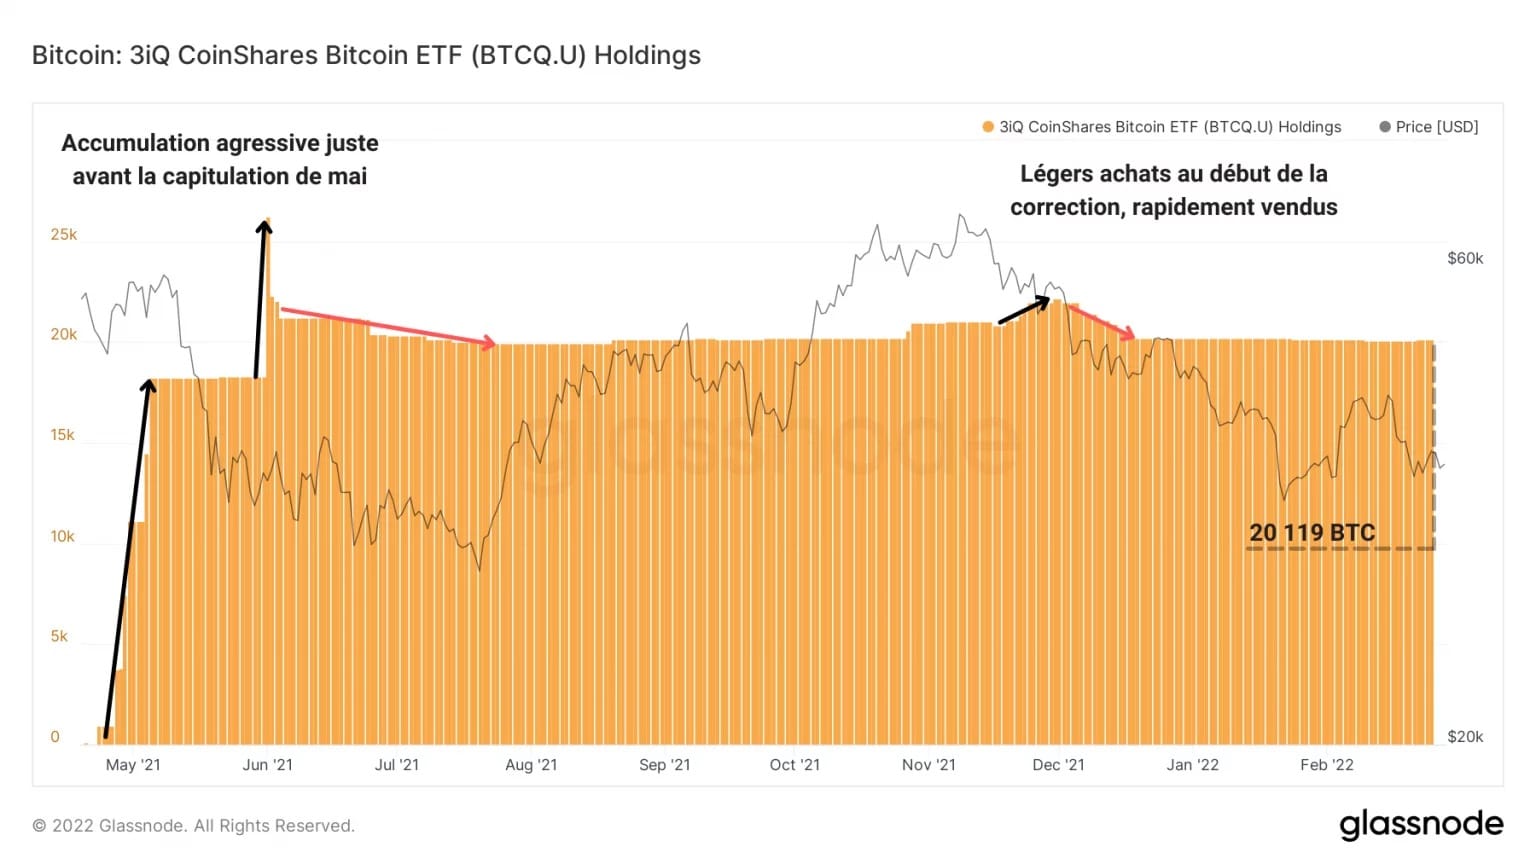
Figure 10: BTC holdings of the 3IQ Coinshares Bitcoin ETF
By itself, the most consistent fund is Purpose Inc.’s ETF, launched in March 2020. The chart of holdings shows a gradual and continuous rise, punctuated by slight declines.
In a sign of controlled accumulation, the fund is aggressively buying the May and December 2021 declines, creating buying pressure unmatched by its peers discussed above.
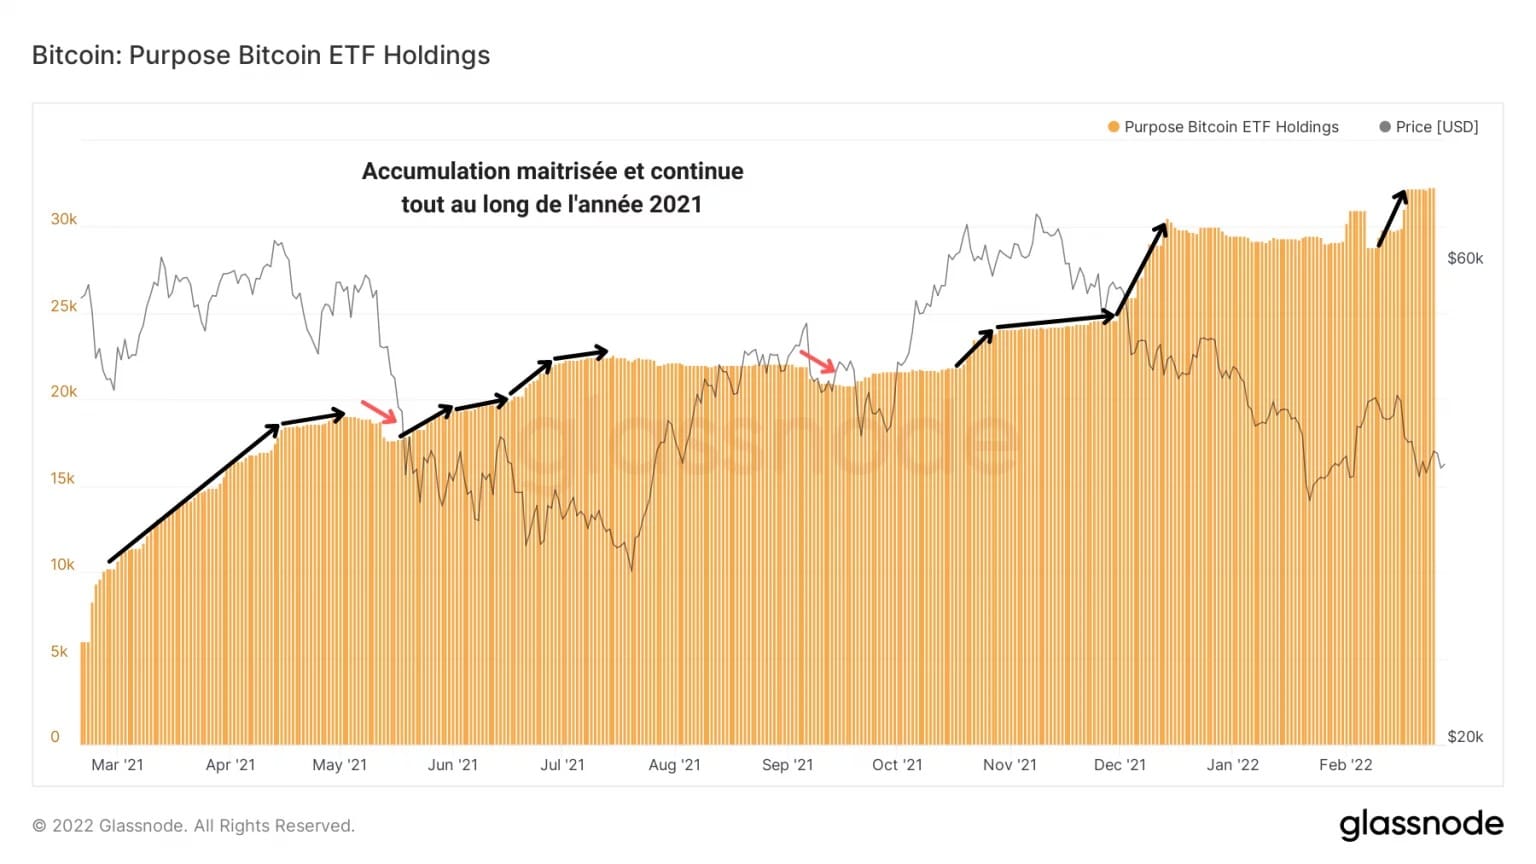
Figure 11: BTC holdings of the Purpose Bitcoin ETF
Adding up the bitcoin holdings of the three funds and calculating the daily variation of the result, we get the following graph:
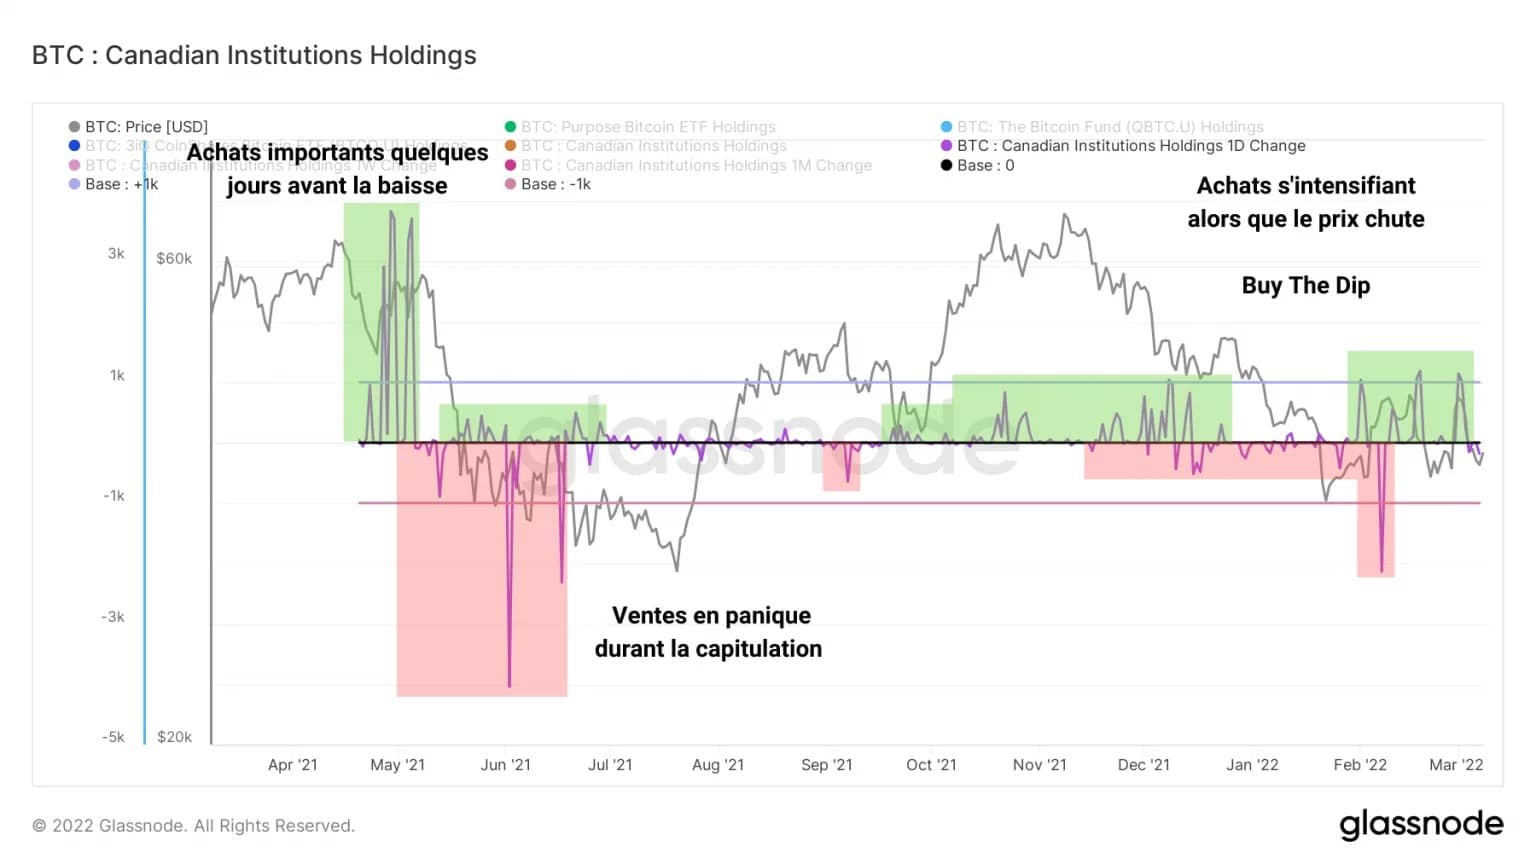
Figure 12: Daily change in Canadian institutional holdings
Representing the daily inflows and outflows of these funds, this data provides a clear picture of the buying/selling behaviour of Canadian institutions.
For example, following a heavy buying spree of several thousand BTC in early May, institutional investors – most notably the QBTC.U fund – liquidated a large portion of their bitcoin holdings during the market sell-off.
However, while the funds managed by 3IQ are clearly not generating significant demand, successive and increasing purchases of the Purpose Bitcoin ETF are intensifying as the current correction develops.
Summary of this on-chain analysis of bitcoin
Finally, the bitcoin market is subject to strong demand which does not seem to be reflected in the current price of BTC. Showing signs of decoupling from the S&P500, bitcoin has the potential to become a systemically weak asset and emerge as a new safe haven in the event of a global financial crisis.
With accumulation reaching record levels, more and more bitcoins are being taken out of circulation and added to the Illiquid Supply already held by long-term investors, whether they have large or small portfolios. In the event of sudden high spot demand, this lack of liquidity could trigger a bullish liquidity shock.
However, we will not be able to rely on Canadian institutional investors to generate this buying pressure as things stand. While the arrival of these entities provides a new source of demand and supply to the market, the overall behaviour of these funds – while encouraging – does not constitute a unanimous behaviour capable of influencing market dynamics.