
Speculative risk in derivatives markets continues to plague the Bitcoin (BTC) market despite the recent drop. A minimal drop in open interest in futures contracts and diverging biases on Bitfinex, Kraken, FTX and Deribit suggest a second wave of sell-offs is possible in the event of high volatility.
Bitcoin nears its former ATH
Bitcoin (BTC) price invalidates the $30k – $28k area and approaches the symbolic $20k level (former ATH), leading to a drop in overall network profitability and significant losses in the spot and derivatives markets.
This price decline is accompanied by an increase in speculative risk in the derivatives markets, heralding a potential series of further cascading liquidations.
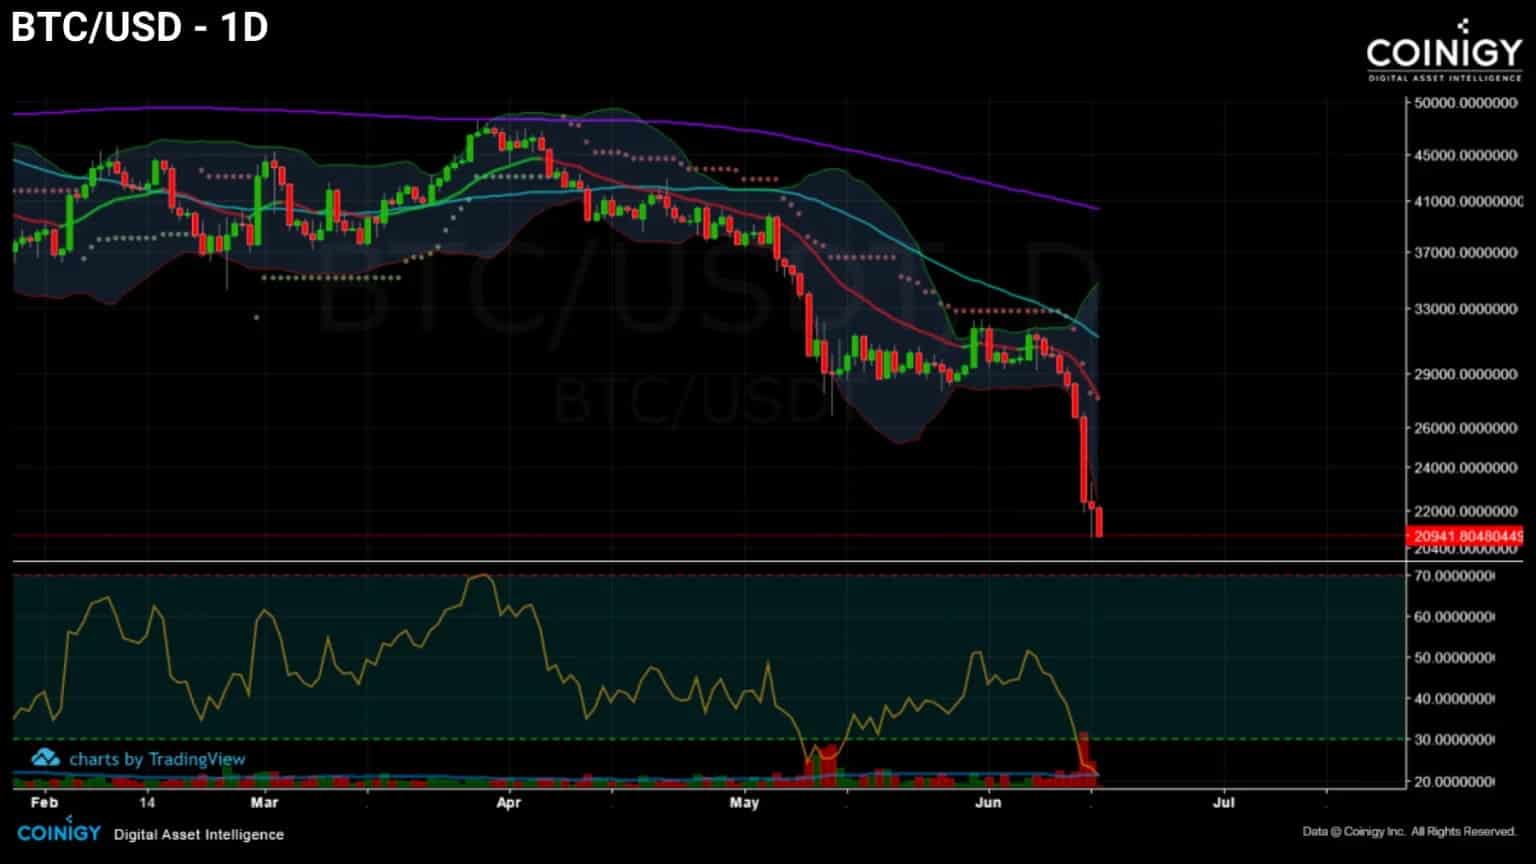
Figure 1: Daily Bitcoin (BTC) price
This week, we’ll be looking closely at:
- the evolution of speculative risk in recent weeks;
- the extent of loss taking in the spot markets;
- the entry of the market into a historically attractive price zone.
High speculation deep in the bear market
Let’s start with the activity in the financial markets, where we can see many signs of increased speculative activity.
Firstly, the Open Interest (OI) of Bitcoin futures, measured in BTC, has been steadily increasing since the beginning of May, rising from 373,000 BTC to an ATH of 486,000 BTC by Monday evening.
Since losing the $30,000 level last Wednesday, the OI has correlated negatively with the BTC price and has risen over 11%, signaling significant speculative interest.
The cascade of liquidations over the past 24 hours has not been enough to purge the excess leverage present in the derivatives markets.
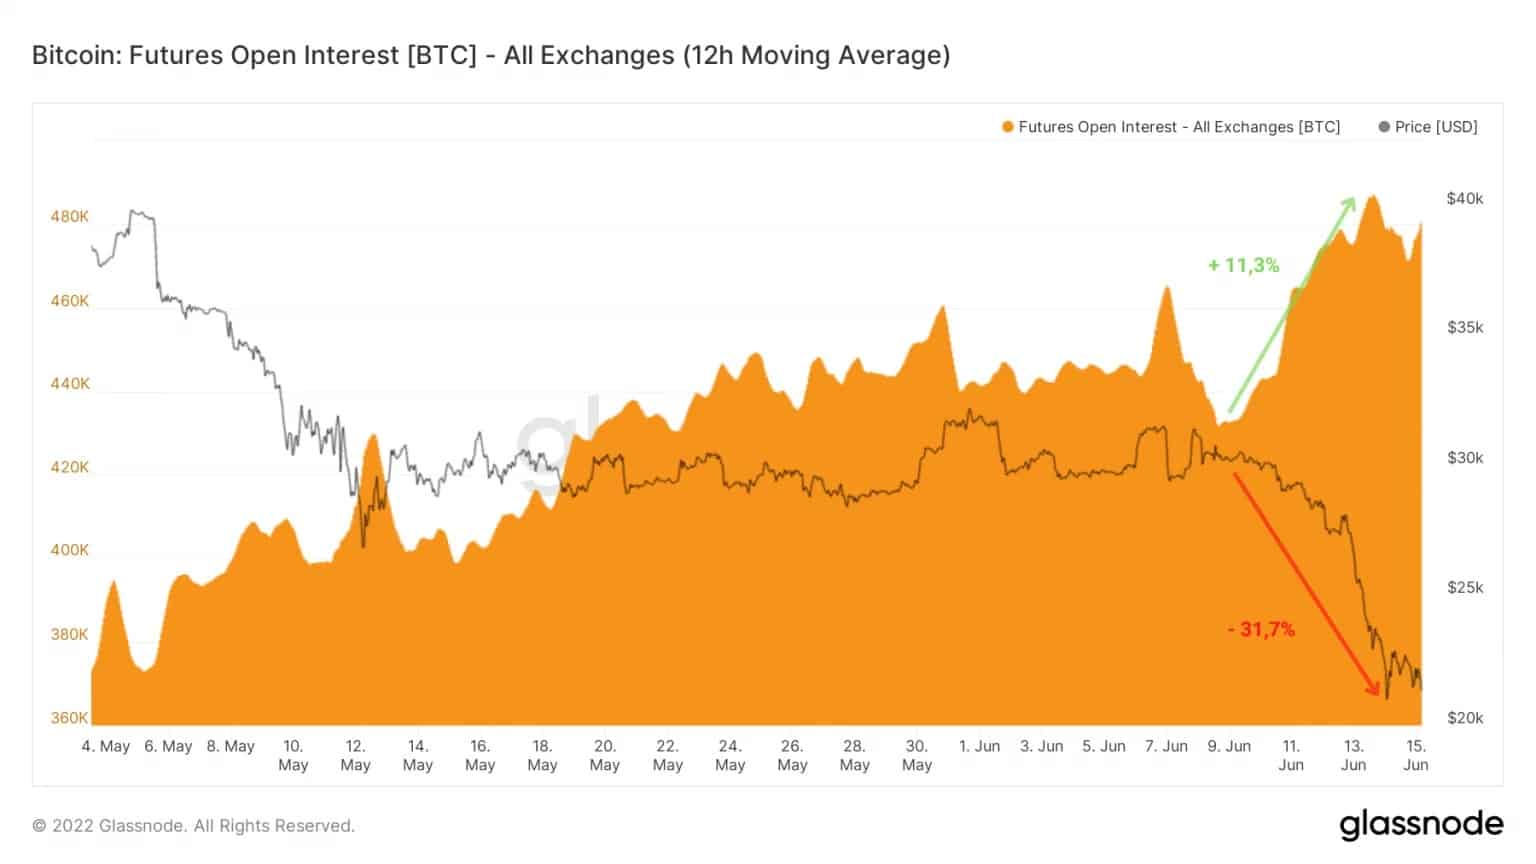
Figure 2: Open interest in Bitcoin futures
Furthermore, when the price of BTC reached $24,000, a divergence in the funding rate of futures contracts became apparent: while Kraken, Deribit, FTX and BitMex adopted a short bias, Bitfinex suddenly became very bullish.
This divergence signals a conflict of interest between bullish and bearish speculators that can only be resolved by de-escalating their positions (coming to their senses) or liquidating them (purging greed).
The average funding rate is currently -0.012%, indicating an overall appetite for short positions.
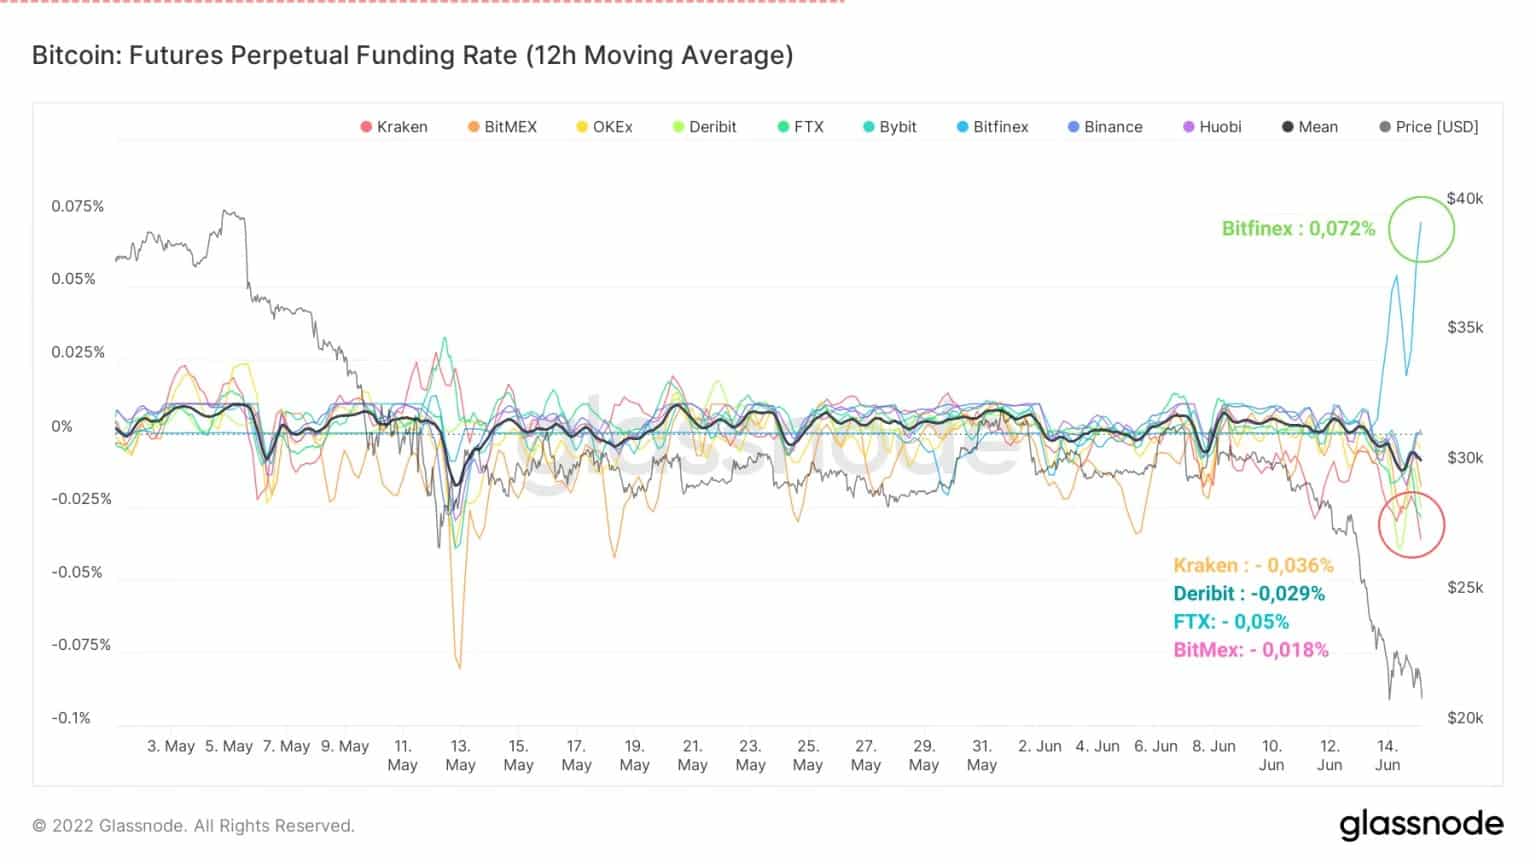
Figure 3: Futures funding rate
At the same time, futures trading volume more than tripled from 1.33Mn BTC to 4.98Mn BTC in less than 24 hours.
This increase in excitement caused by the drop in the spot price on the derivatives markets, causes a feedback loop between
- liquidations of long positions;
- forced stop losses at the close;
- selling pressure on short positions.
Far exceeding the volumes recorded during the Terra/LUNA crash, this measure demonstrates the overriding influence of the derivatives markets on the recent decline.
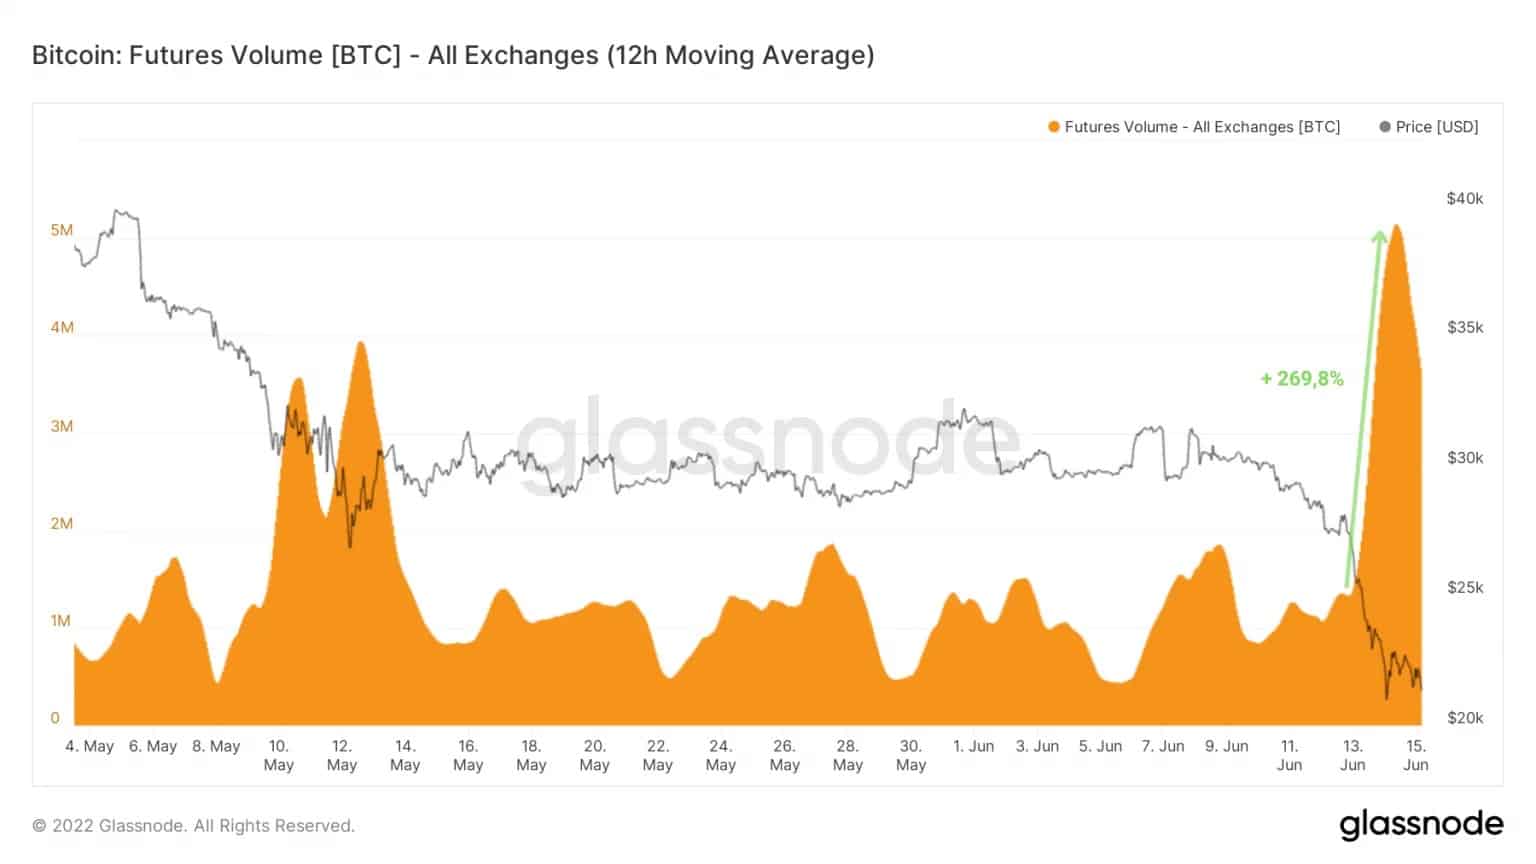
Figure 4: Bitcoin futures volume
As a result of the debacle caused by the factors noted above, a series of liquidations in the derivatives markets resulted in more than $300 million in losses within 24 hours.
Confirming that this decline is more influenced by the derivatives markets than a month ago, this observation does not rule out the possibility of a deeper fall in the coming days.
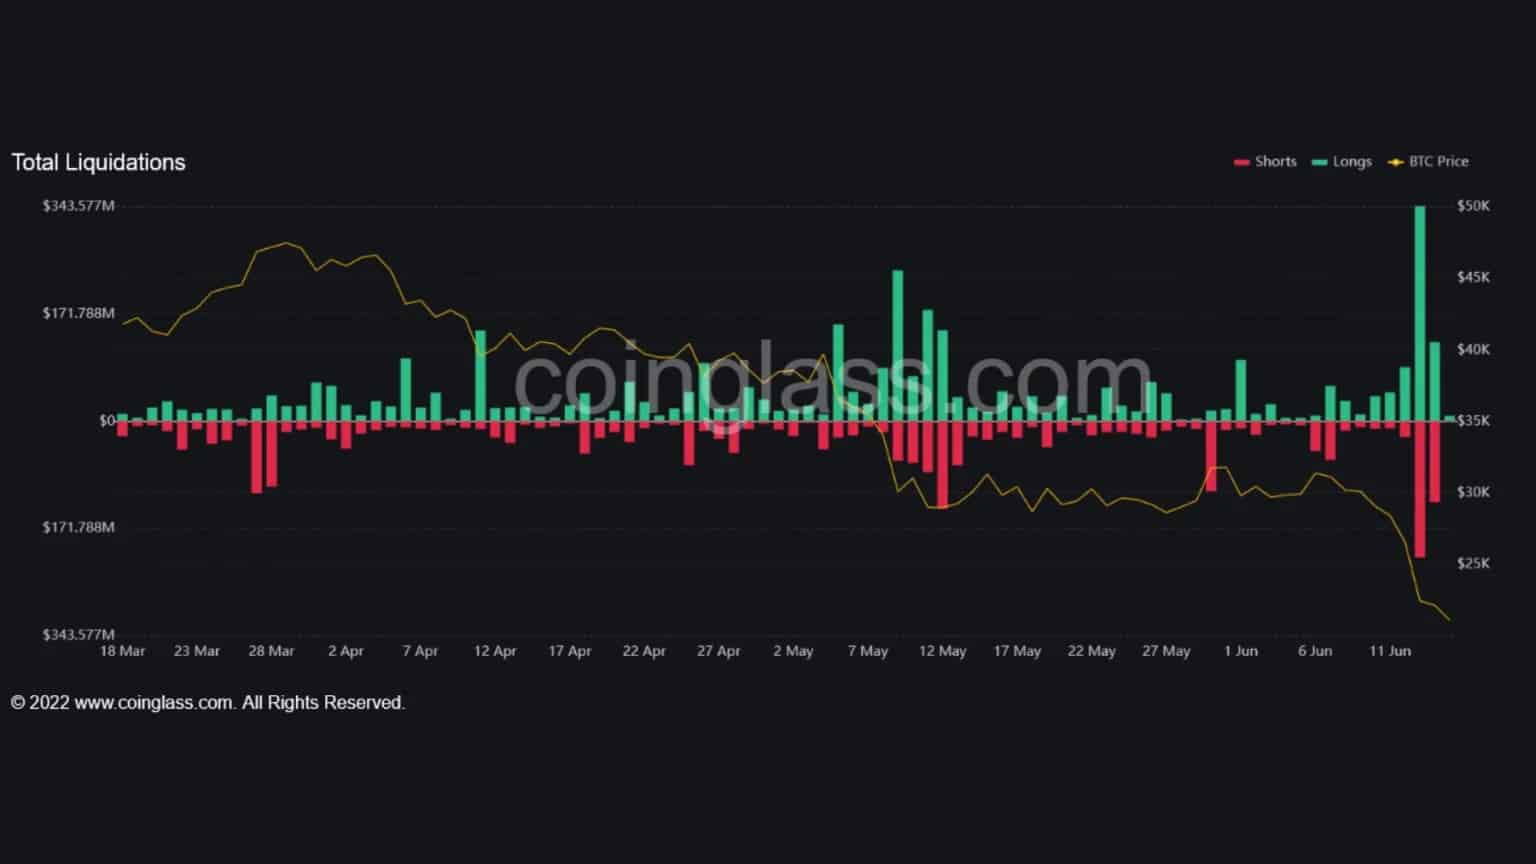
Figure 5: Long liquidations of Bitcoin futures contracts
Indeed, the continued high OI, long positions in Bitfinex, as well as the growing margin call risks of companies such as MicroStrategy and Celsius point to a possible bloodbath ahead if conditions deteriorate further.
Heavy losses in spot markets
Adding to these observations is a painful string of losses on the hourly scale. Far greater than the losses recorded on 10 and 13 May (~$150Mn), yesterday’s fall resulted in a substantial sell-off of up to $214M per hour.
This indicator of the extent of the panic created by the verticality of BTC price action over the past few hours is indicative of the willingness of participants to sell (sometimes forced) long positions.
Historically, spot markets have not seen a similar sell-off since June 25, 2021, when almost $300 million in losses were made
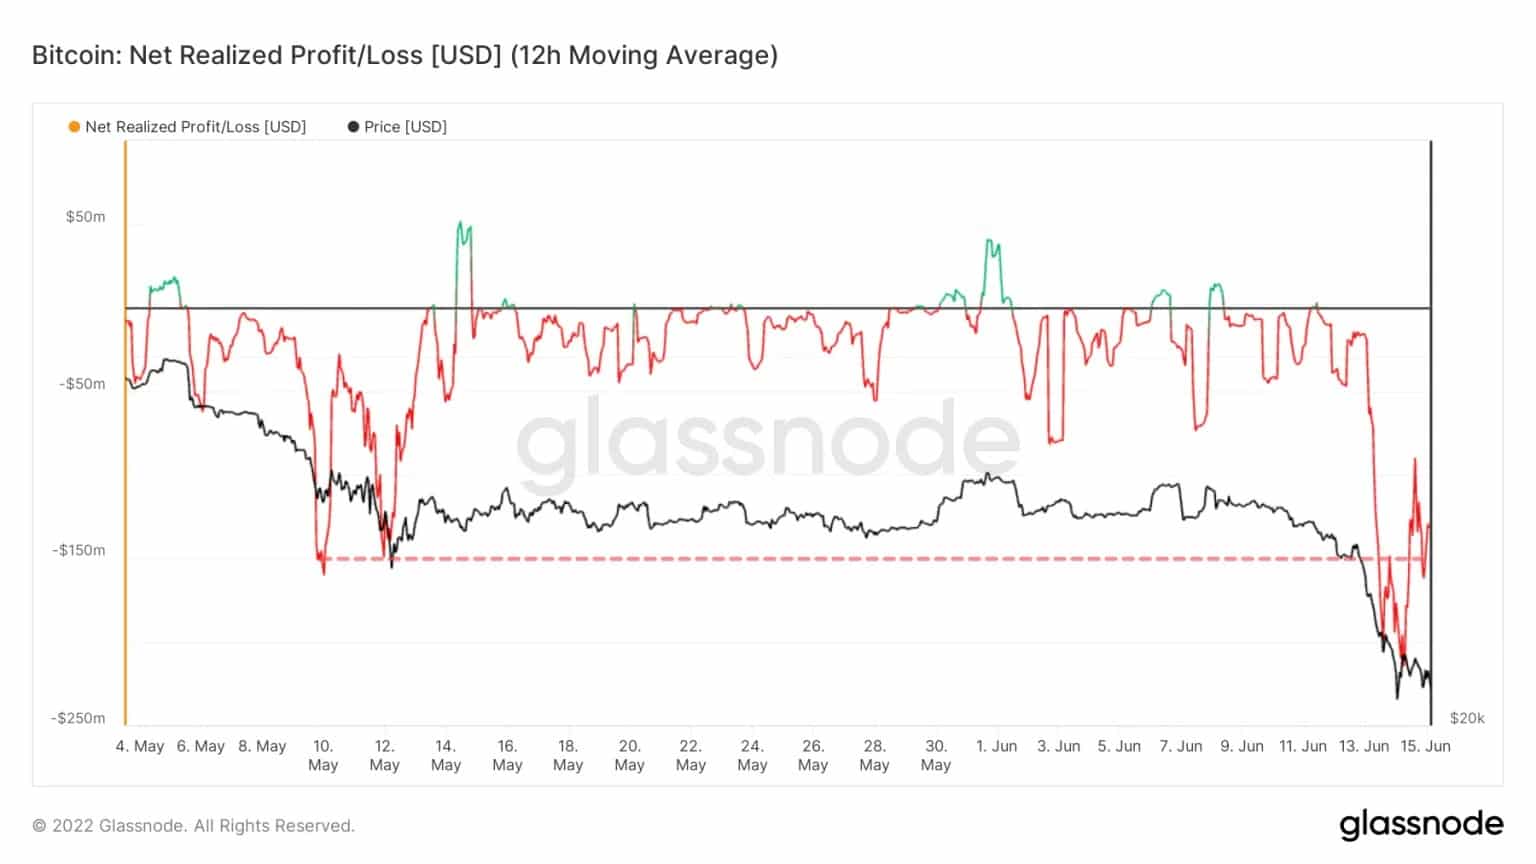
Figure 6: Distribution of Supply by Cohort and 30 Day Change
A generational buying opportunity
The cascade of liquidations described above, coupled with selling pressure from the spot markets, is pushing the price of BTC into its former ATH range, into a very attractive value area from a long-term perspective.
The MVRV Z-Score, used to assess when Bitcoin is over/undervalued relative to its “fair value”, suggests that the market is now highly undervalued.
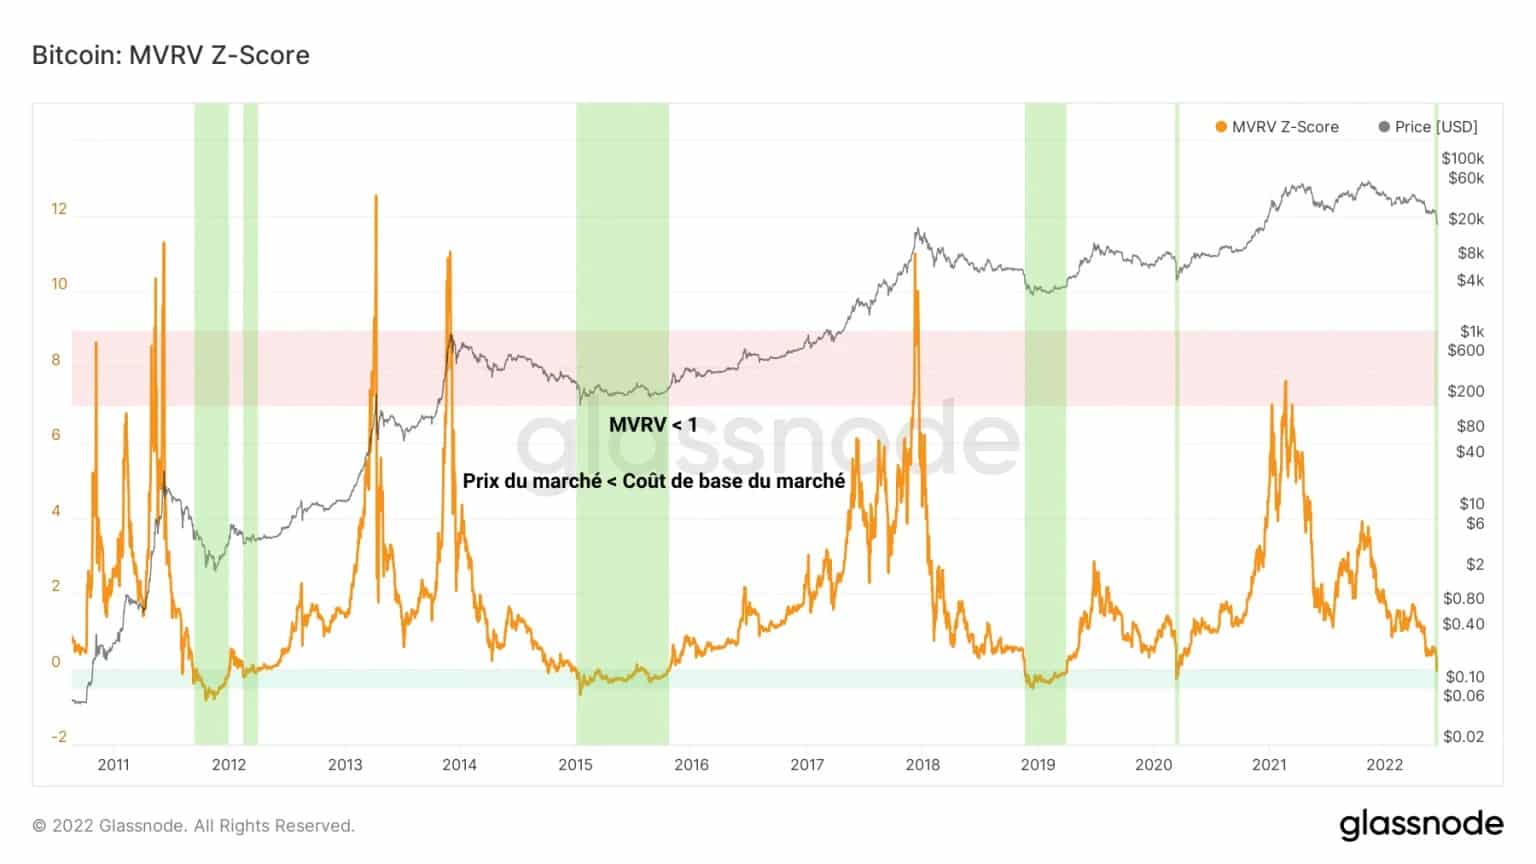
Figure 7: Supply Distribution by Cohort and 30 Day Change
This meaningful and historically significant signal registers negative values (in green) for the 6th time in its history, confirming that we are entering a territory conducive to the construction of generational savings.
Summary of this on-chain analysis
Overall, this week was an emotional one, with the Bitcoin (BTC) price entering a statistically attractive price range.
After yesterday’s cascade of sell-offs, and considering the losses in the spot markets, we can say that we are closer to the end of the bear market than the beginning.
However, given the deteriorating macroeconomic and geopolitical context, the persistence of speculative risk and the latent losses still held by participants, now is not the time to expose oneself to reckless risk.
Finally, we note the margin call risks faced by Celsius and MicroStrategy, at liquidation prices of $14k and $21k respectively, which could result in unprecedented selling pressure worthy of the Mt. Gox and Terra/LUNA debacle.