
The transition from the end of the current bear cycle to the upcoming bull market is very similar to previous bear markets. The current supply dynamics in favour of short term holders indicate that the conditions for a market reversal are visibly developing. On-chain analysis of the situation
Bitcoin continues its recovery
Continuing its bullish recovery, the price of Bitcoin (BTC) has surpassed $22,000, erasing the fall caused by the collapse of FTX in November 2022.
As the short and medium term BTC holder has pulled out of the water, the current market structure shows signs of transitioning from the end of a bear cycle to the beginnings of a much anticipated bull market.
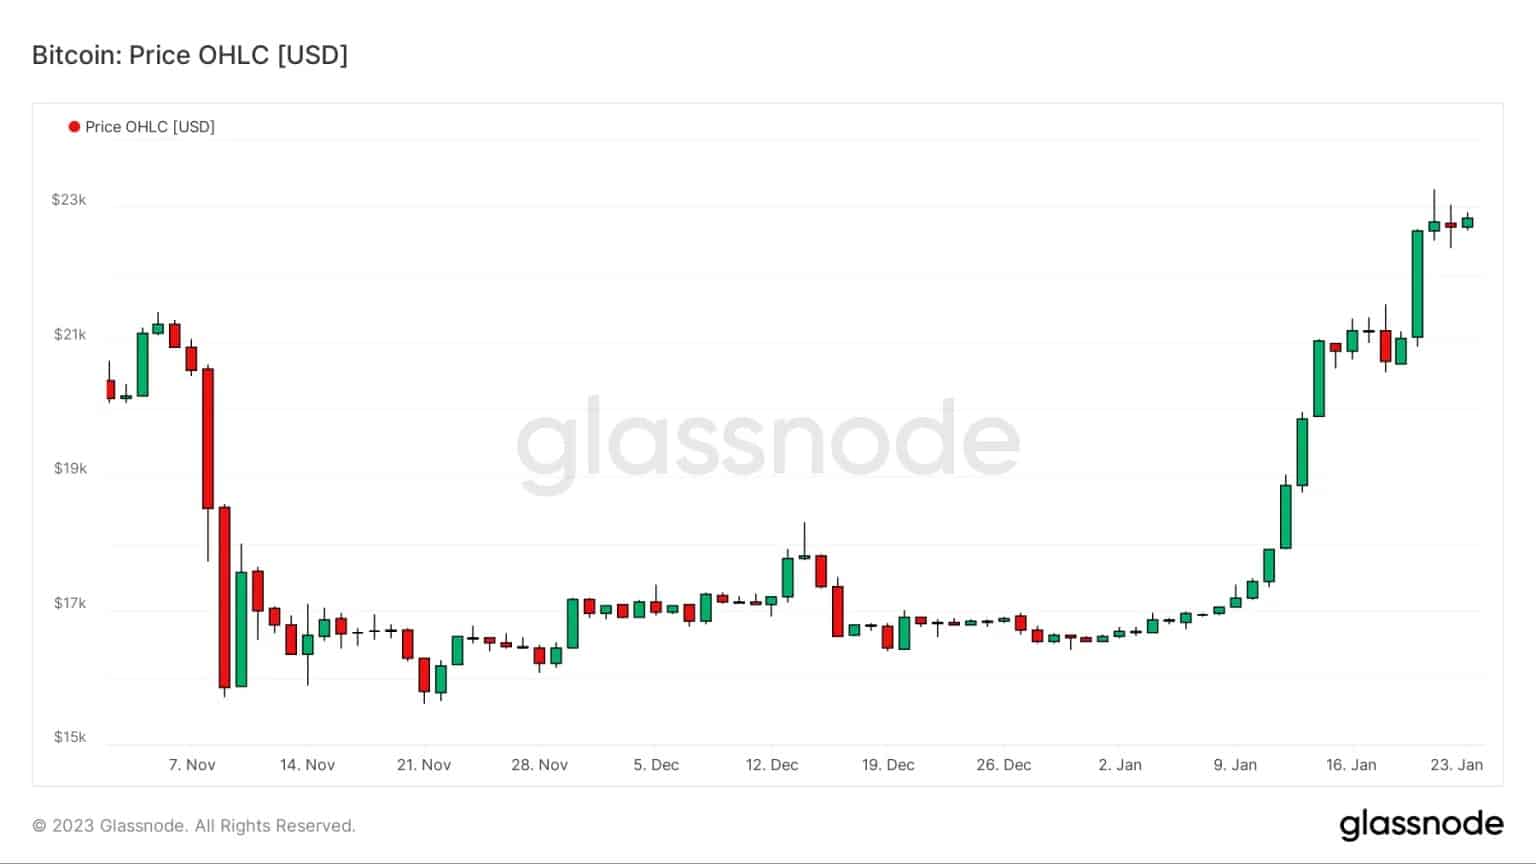
Figure 1: BTC daily price
In order to visualize this transition from bear market to bull run, we now look at the dynamics of the profit supply held by the cohort of short term holders through the last three down cycles of Bitcoin.
The profit supply dynamics of STH
Watching the Bitcoin blockchain data closely, one thing becomes clear: the cycles in the BTC market, while not repeating themselves identically, do rhyme in a significant way.
Studying the supply of BTC held in profit clearly illustrates this periodicity while providing a clear visualization of the market’s profitability dynamics during its downward trends.
Typically, the supply of BTC in circulation tends towards 100% profitability at the end of bull runs, when mania and bullish volatility place almost all participants in a state of latent profit.
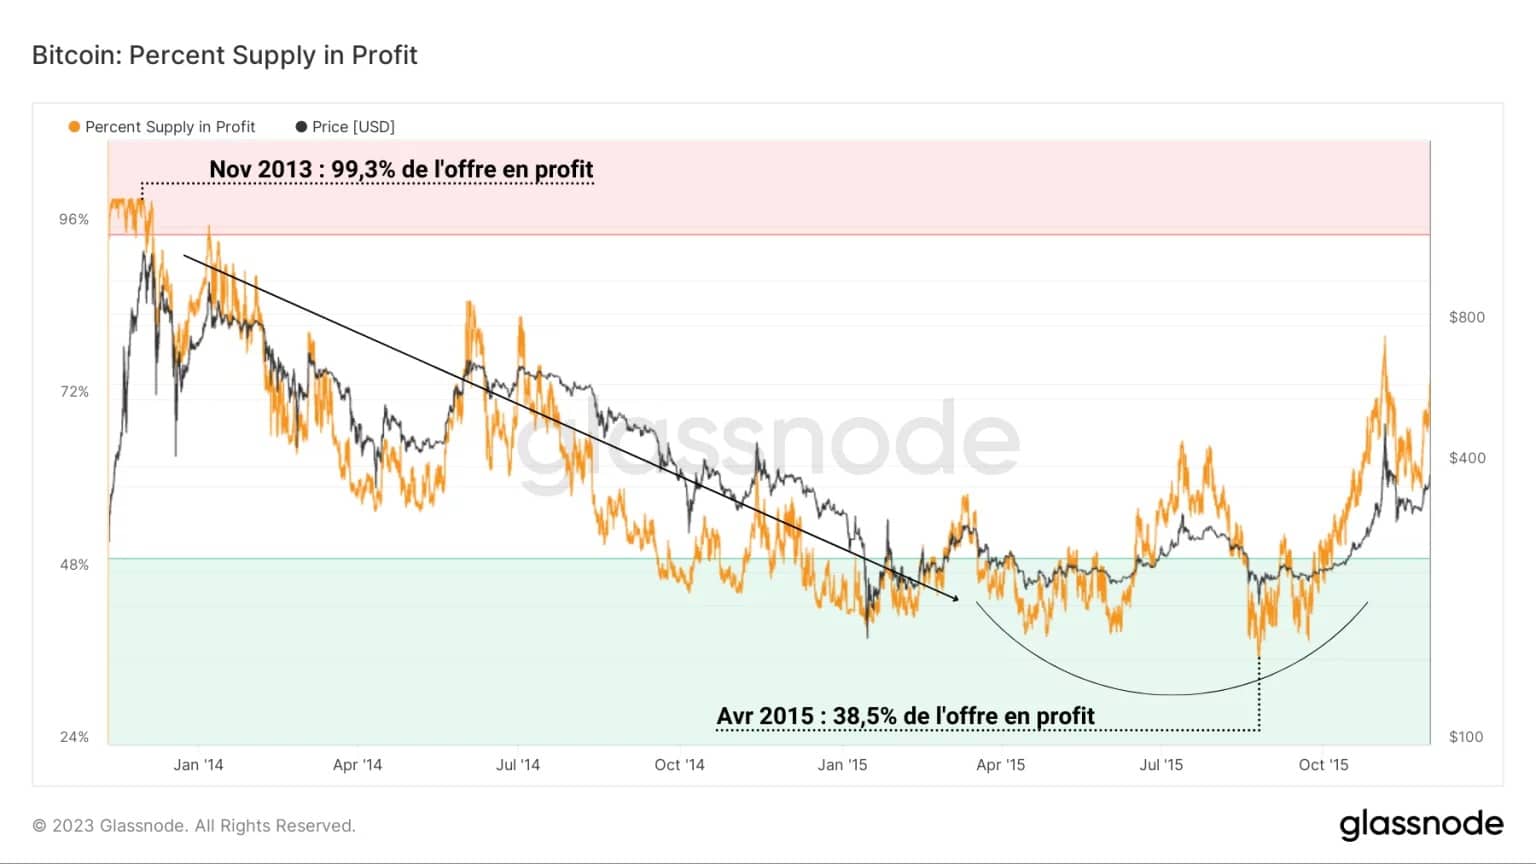
Figure 2: Percentage of supply in profit (2014 – 2015)
There then follows a slow decline in profitability for all holders, until a bottom is reached following the formation of the “technical” low point in the spot price of BTC which results in a marked reversal of the trend.
From the point of view of short-term holders (STHs), after a period of sustained growth in the profits of this cohort’s supply (green), the end of the bull run is characterised by a continuous and gradual fall in the profitability of STH positions (light red).
It is during this period that they actively participate in the loss-making redistribution of capital during bear markets, when notable loss-taking events take place as the STH profit supply reaches a critical threshold of less than 3% (dark red), as during the bear market of 2014 – 2015.
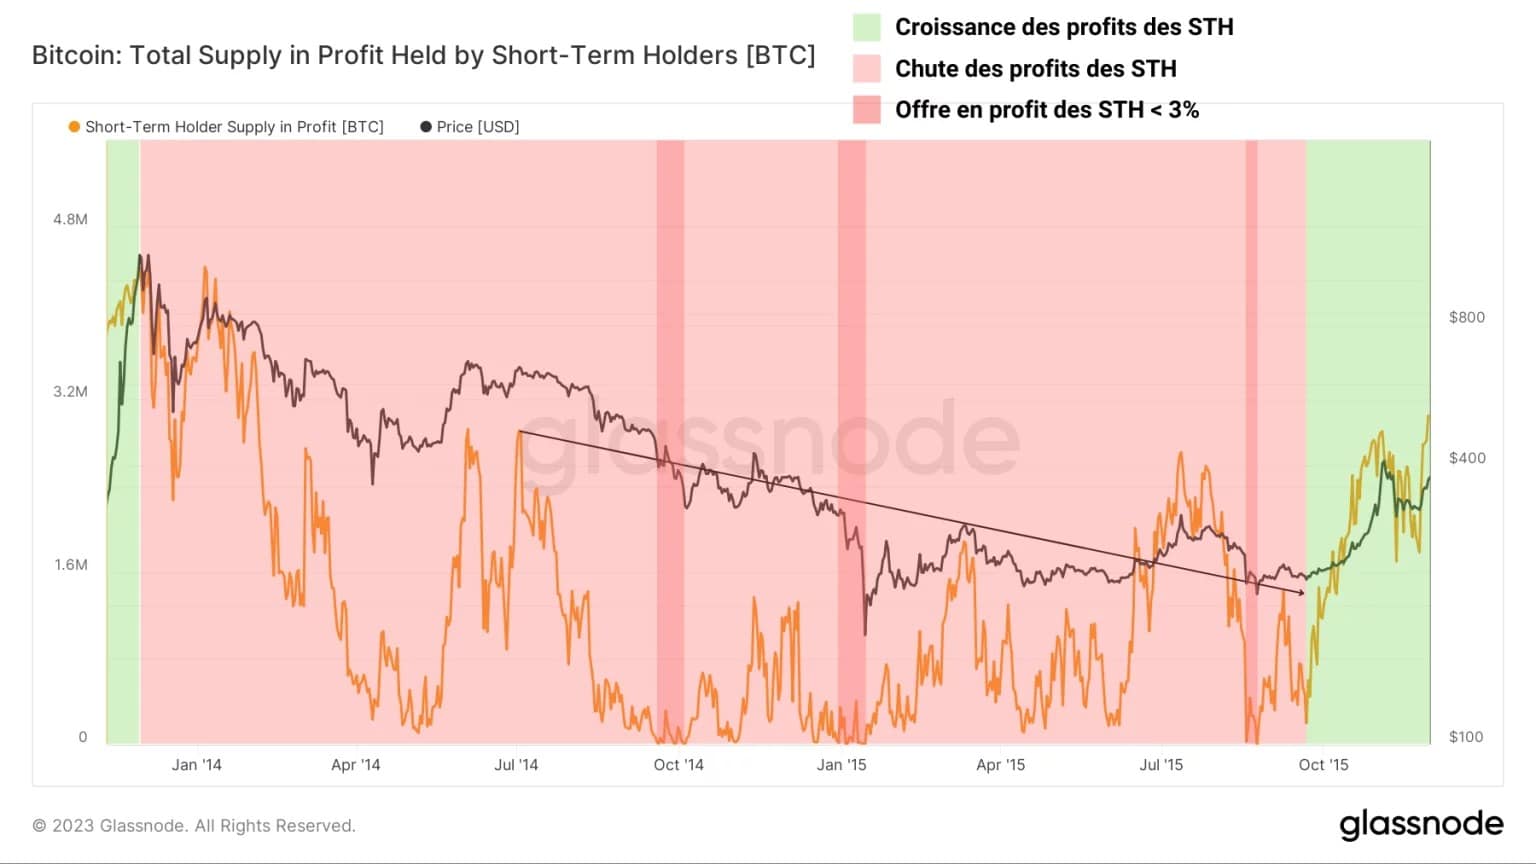
Figure 3: STH profit supply (2014 – 2015)
The same observation can be made about the 2018 – 2019 bear cycle, where the profitability of short-term positions fell for over a year before a bullish impulse reversed the balance in April 2019.
Again, we can see a significant contraction in supply in favour of HTS throughout the bear market, the expansion of which then signals a long-term trend reversal.
From nearly 6 million BTC in profit to about 30,000 BTC in profit prior to the April transition, this cycle is particularly illustrative of the loss experienced by short-term BTC holders during the bear markets.
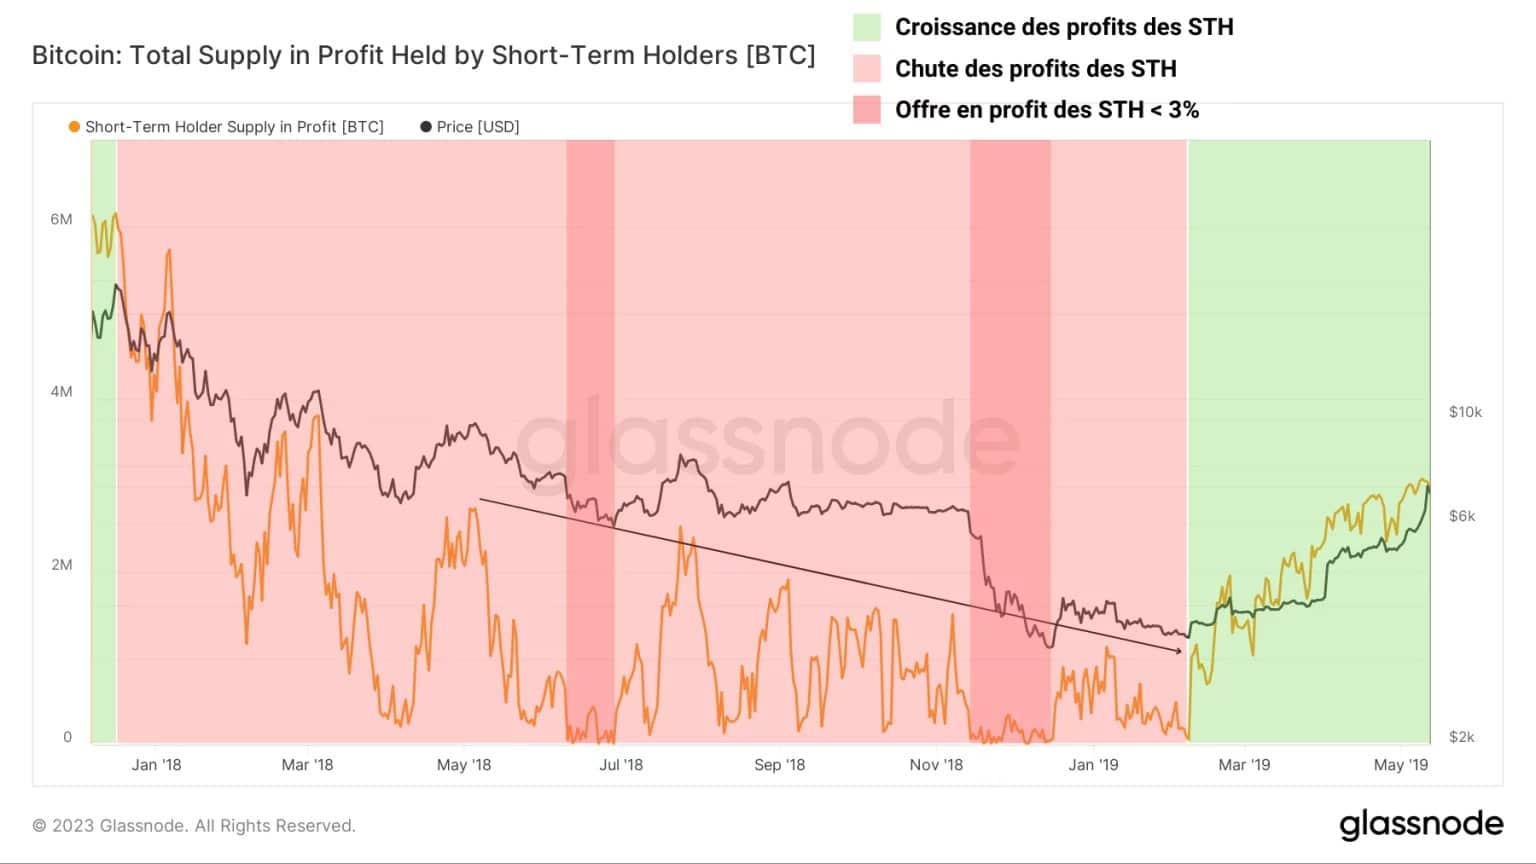
Figure 4: STH Supply in Profit (2018 – 2019)
Currently, we can see a very similar pattern developing, indicating that the conditions for a market reversal are developing.
After a rapid and powerful loss of profitability following the April 2021 sell-off, the STH cohort saw the profitability of its holdings decline gradually until January 2023, with the following four occurrences:
- January 2022: purge of leverage on derivatives;
- May 2022: Terra/LUNA collapse;
- June 2022: Celsius bankruptcy;
November 2022: collapse of FTX and Alameda Research.
Since the recent rise in the price of BTC, STH profit supply has risen again and now exceeds the levels seen at the second peak in November 2021.
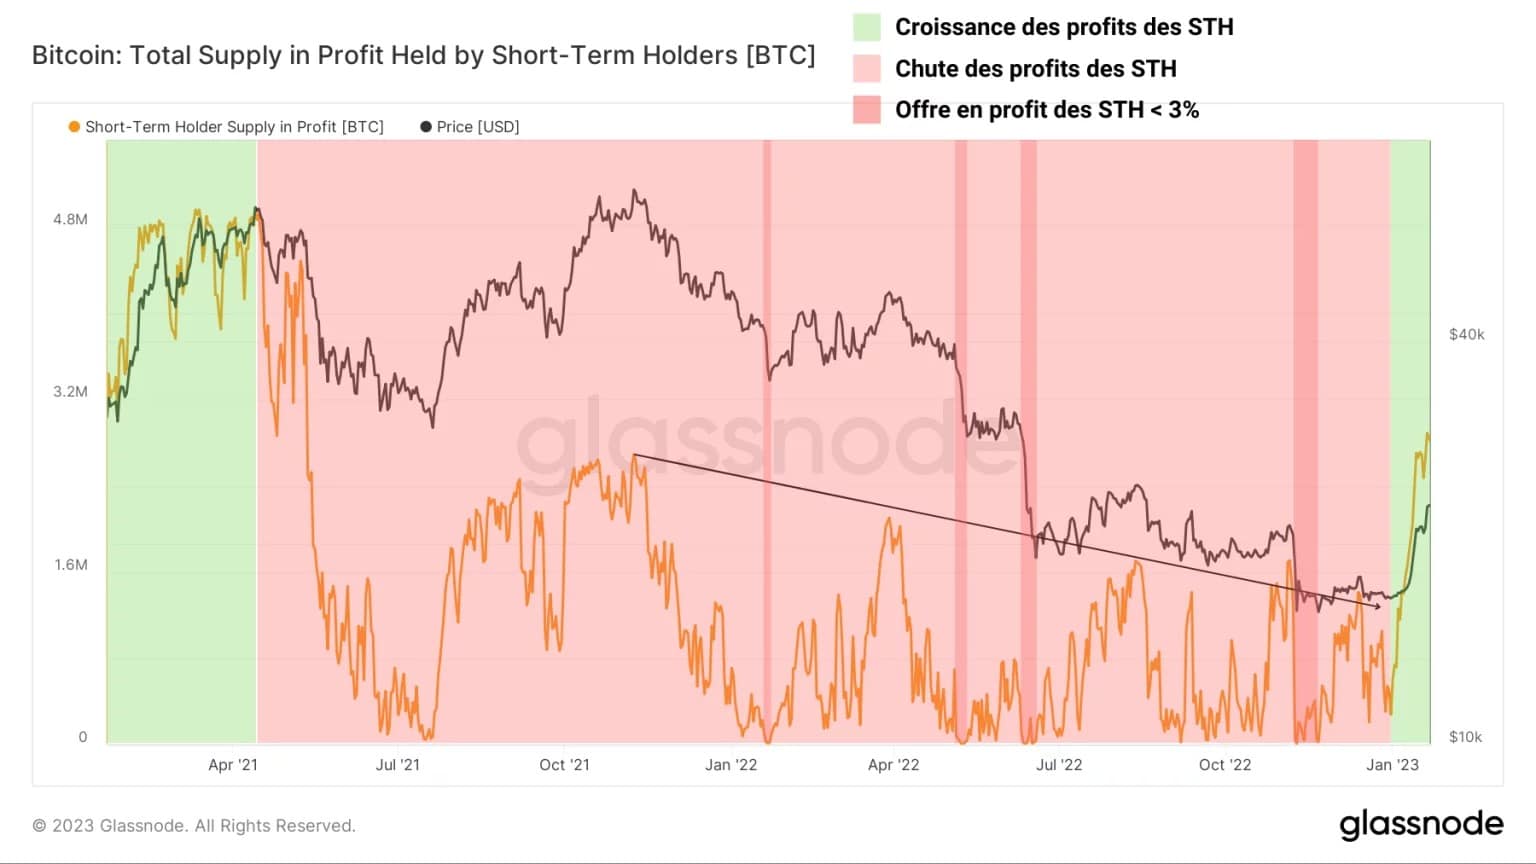
Figure 5: STH Profit Supply (2021 – 2023)
Summary of this on-chain analysis of BTC
In sum, this week’s data tells us that despite appearances, the transition from the end of the current bear market cycle to the beginning of the upcoming bull market is very similar to previous bear markets.
The comparative study of the supply of profits to short term holders indicates that the recent price increase has caused a significant recovery in latent profitability within this cohort, even allowing the levels recorded at the second ATH in November 2021 to be exceeded.
The current pattern of STH profit supply indicates that the conditions for a market turnaround are visibly developing.