
The price of Bitcoin (BTC) is still in deep trouble, trying to hold on to the $30,000 support. The recent capitulation has resulted in a significant loss taking and has tested the conviction of long term investors (LTH). Yet, the data indicates that the recent spending has been particularly youthful. On-chain analysis of the situation
BTC clings to the $30,000 level
The price of Bitcoin (BTC) is testing one of its historical support levels as the market struggles to recover from the debacle caused by the de-anchoring of stablecoin UST.
After printing a low of $26,513 on Thursday night, BTC is holding on to a price range between $28,000 and $31,000.
This capitulation phase, catalyzing the current bear market dynamics by exhausting the selling pressure of participants, is testing the conviction of long-term investors (LTH) still harboring substantial potential selling energy.
This week we will look at the overall spending behaviour of the market as well as the age and profitability of the coins sold to compare the magnitude of the current sell-off to those recorded over the last five years.
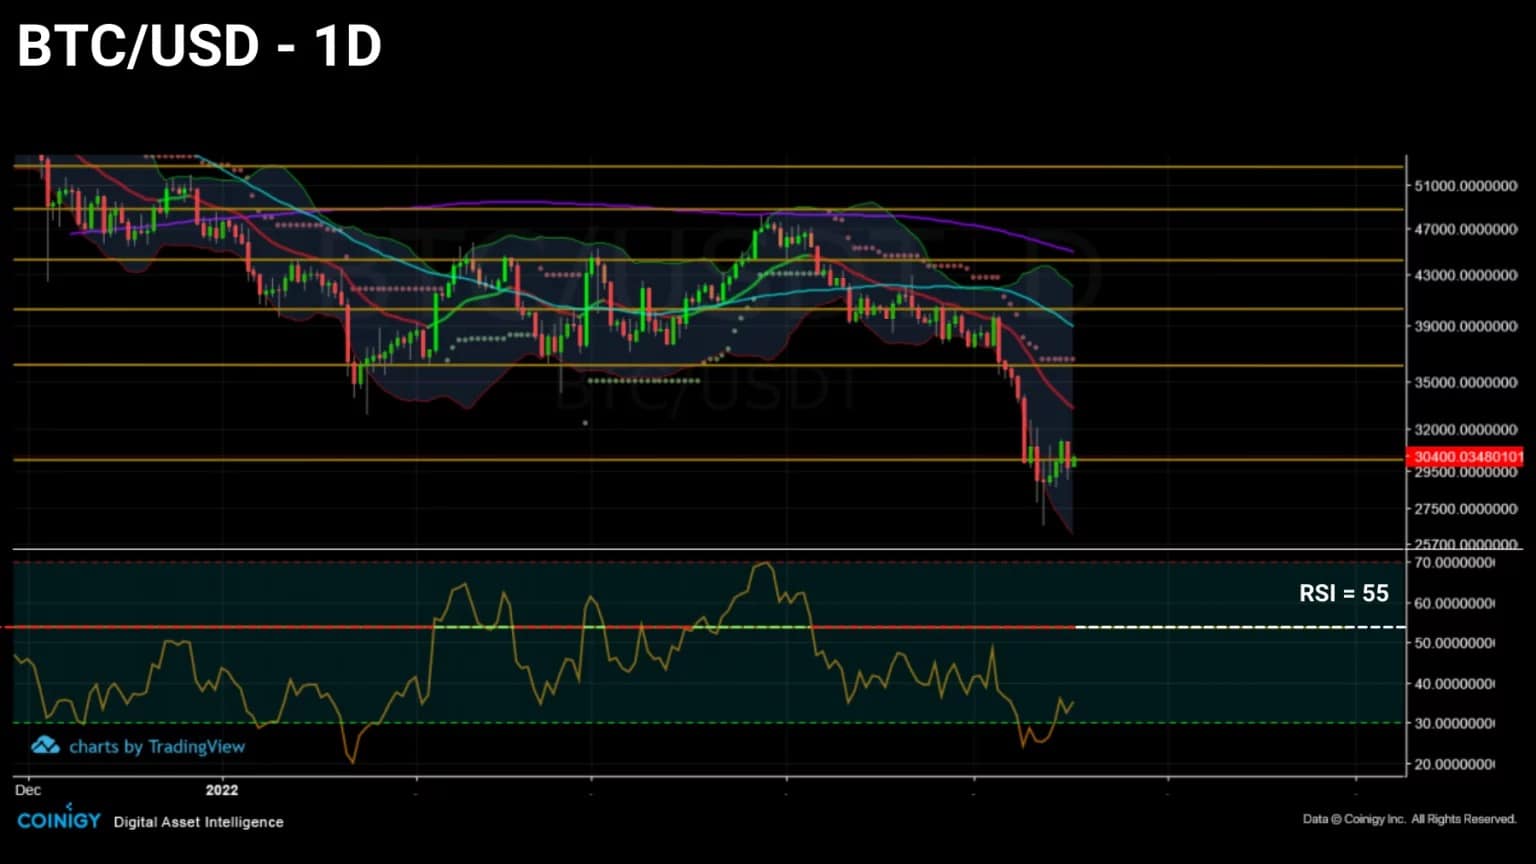
Figure 1: Daily Bitcoin (BTC) price
The depths of the bear market
Let’s begin our study with a brief background on the state of the market. With a drop of 57.95%, the current trend so far exceeds that of May and July 2021 in terms of deviation from the ATH.
Not far from the 65.21% value recorded in February 2018, the current drop racks up the fourteenth deepest drop in Bitcoin history and ranks sixth for the past five years.
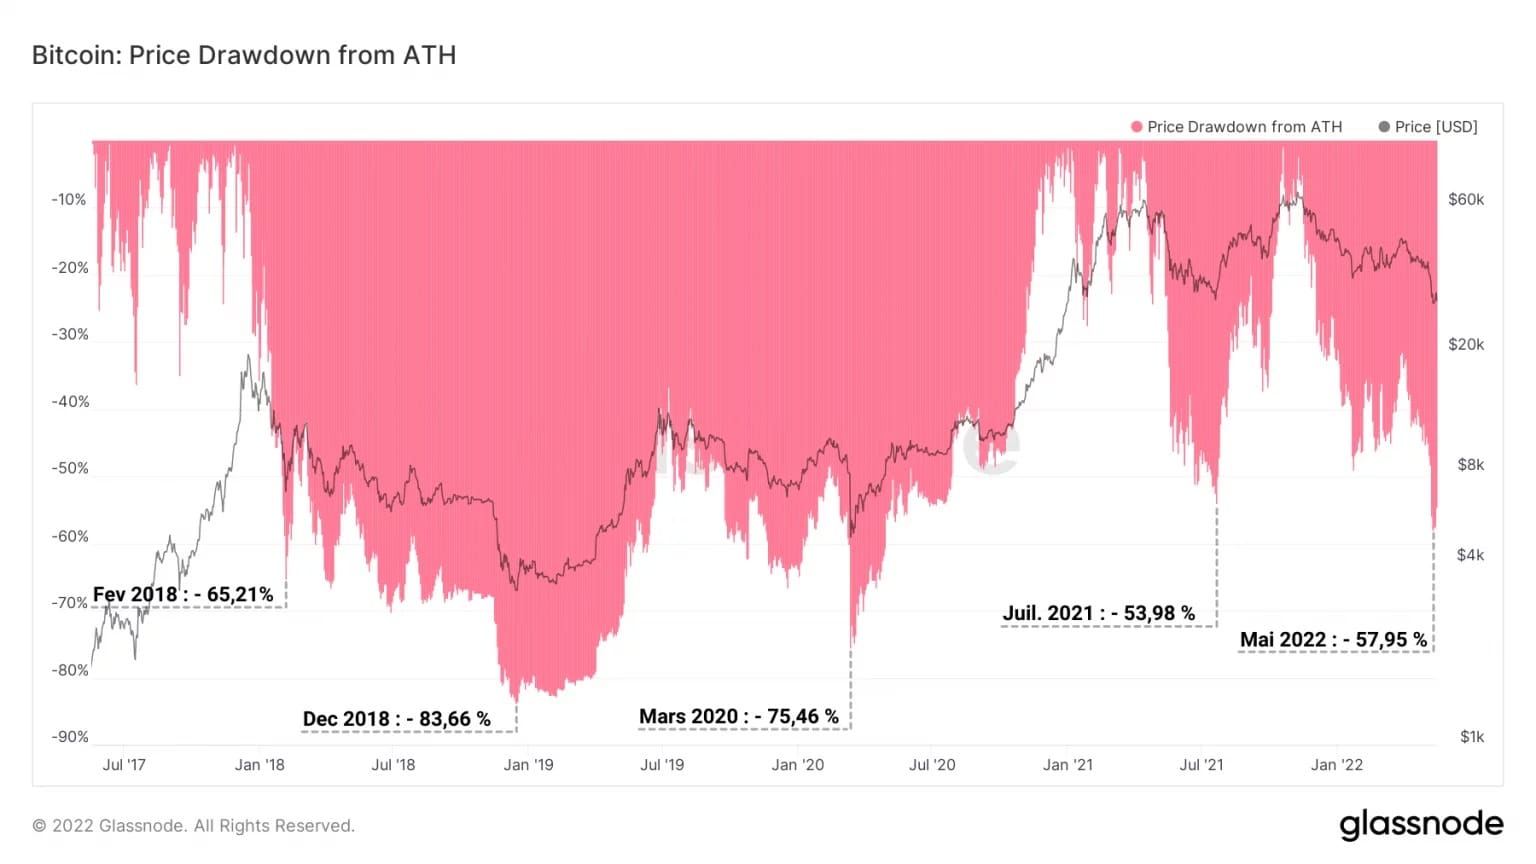
Figure 2: Declines since ATH
In addition, the monthly BTC yield is once again approaching the -30% threshold, signaling a buying opportunity, given the rarity of this occurrence (eight times in the last five years).
Caution, however. Such a low monthly yield is not an assurance that the price will stop falling. It simply identifies a moment in the market that is statistically favourable for investment.
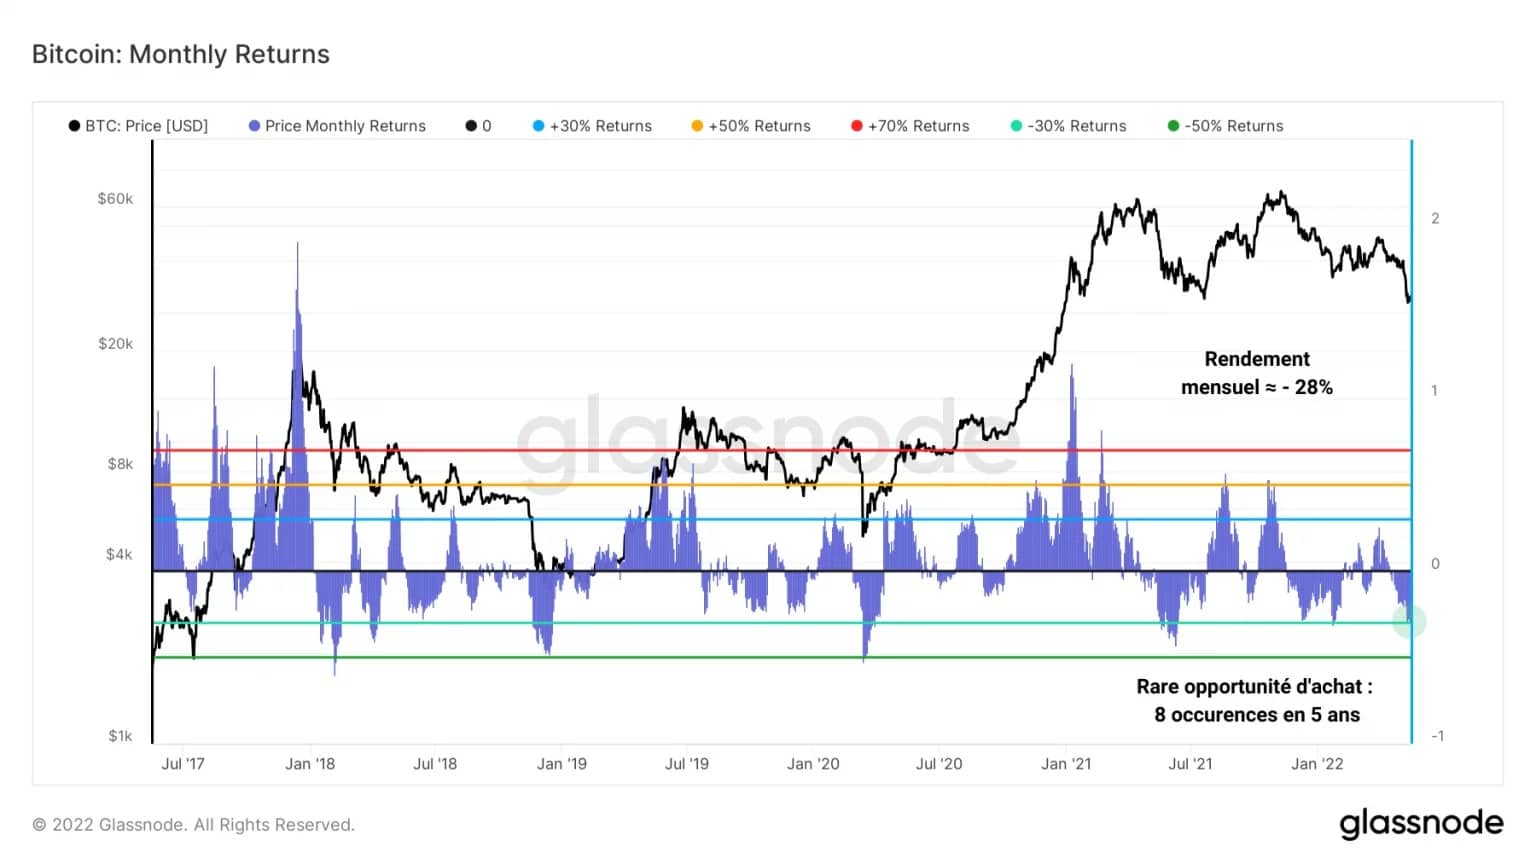
Figure 3: Monthly returns
Indeed, although the indicator has reached the -0.3 multiple twice in recent months, the price has continued to fall to current levels.
As for Bitcoin’s dominance, it sits at around 44.5% and is growing as small and mid-cap altcoins witness massive capital flight under the pressure of uncertainty and panic.
This trend, while nascent within the current market phase, is not unlike the bear market events of 2018.
Back then, BTC’s dominance grew as altcoins collapsed, ending up 90% bloodless and succumbing to natural market selection.
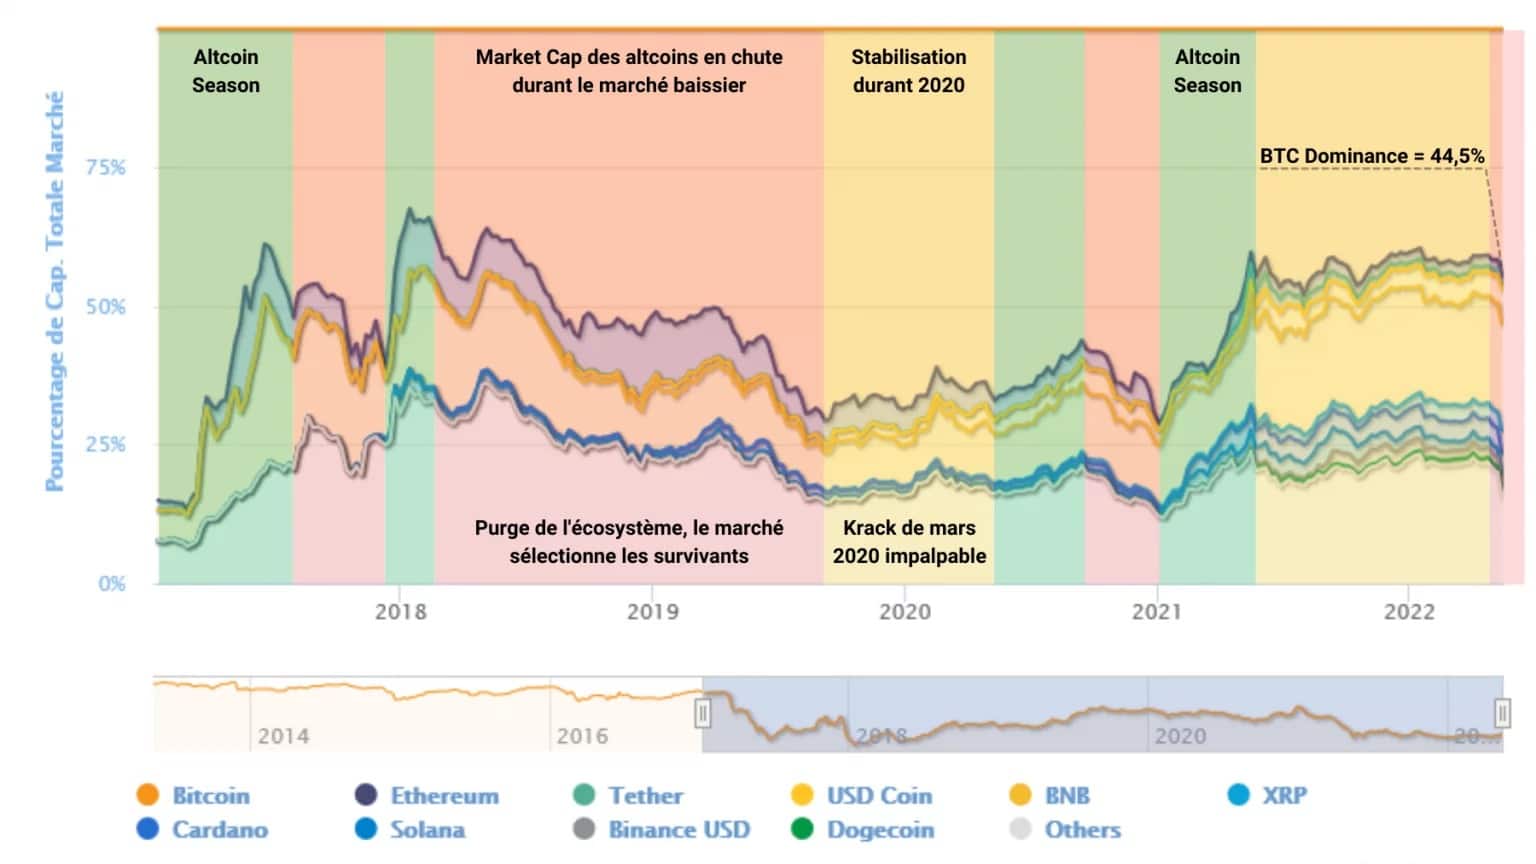
Figure 4: BTC market cap dominance
Spending is particularly young
By looking at the accumulation trend score, it is possible to observe the overall spending or saving behaviour of the market over time.
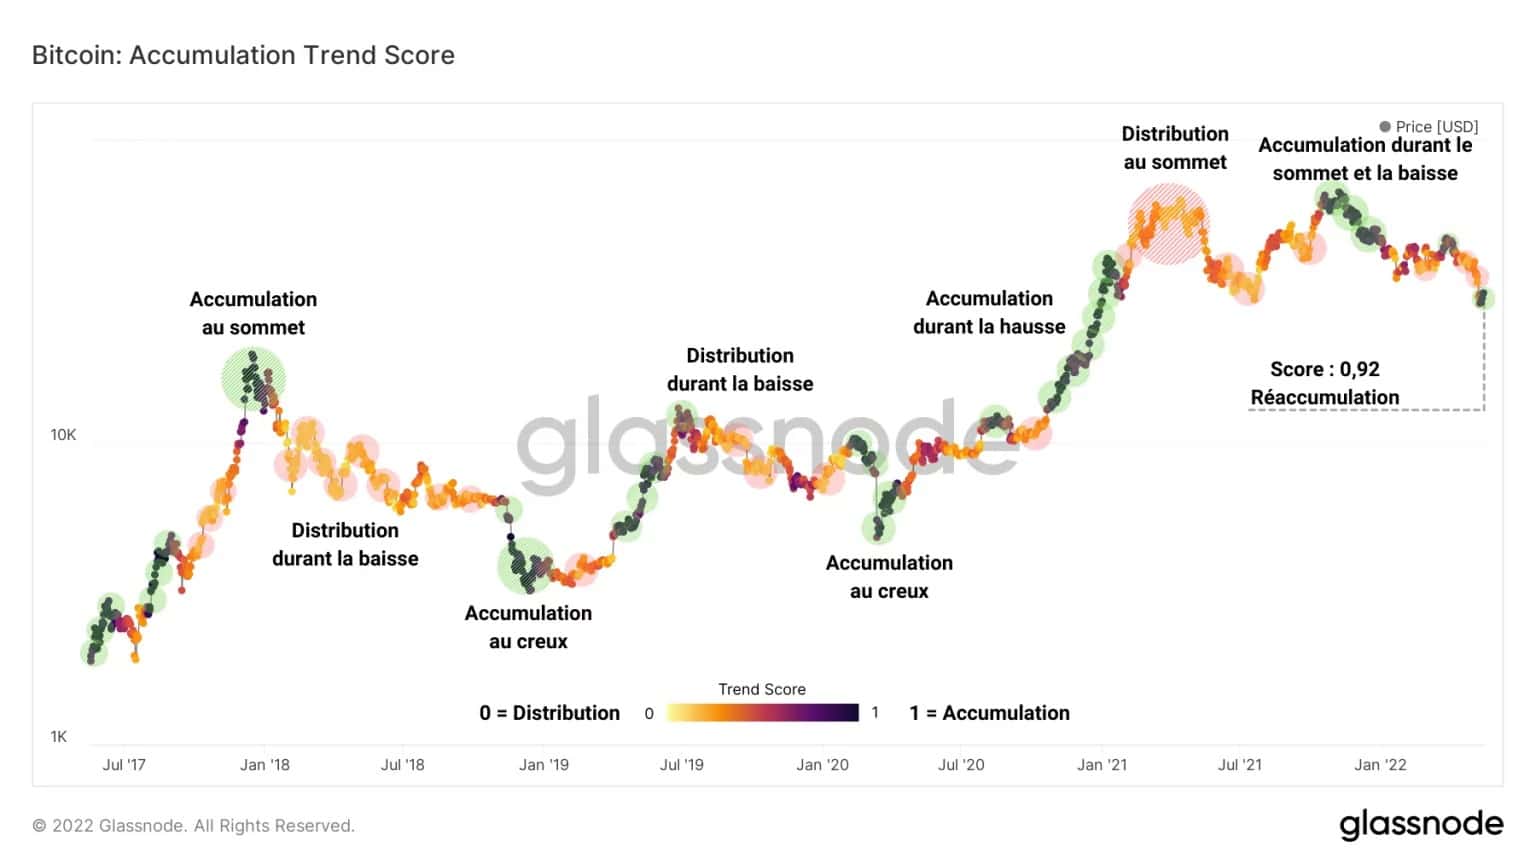
Figure 6: Accumulation trend score
Several facts emerge that are worth highlighting:
- the peak of the beginning of 2021 was remarkably well distributed by the entities having accumulated throughout the rise;
- the November 2021 high, as well as the drop to $45,000, was heavily bought and contributed to the ongoing capitulation;
- the market largely sold the $36,000 support invalidation but has been aggressively building up since this weekend.
So, despite a blatant panic move, opportunism has not been slow in the BTC markets.
Observing the age of the coins spent tells us that the panic phase involved a small number of old tokens, a sign that the movement was mostly driven by short-term investors.
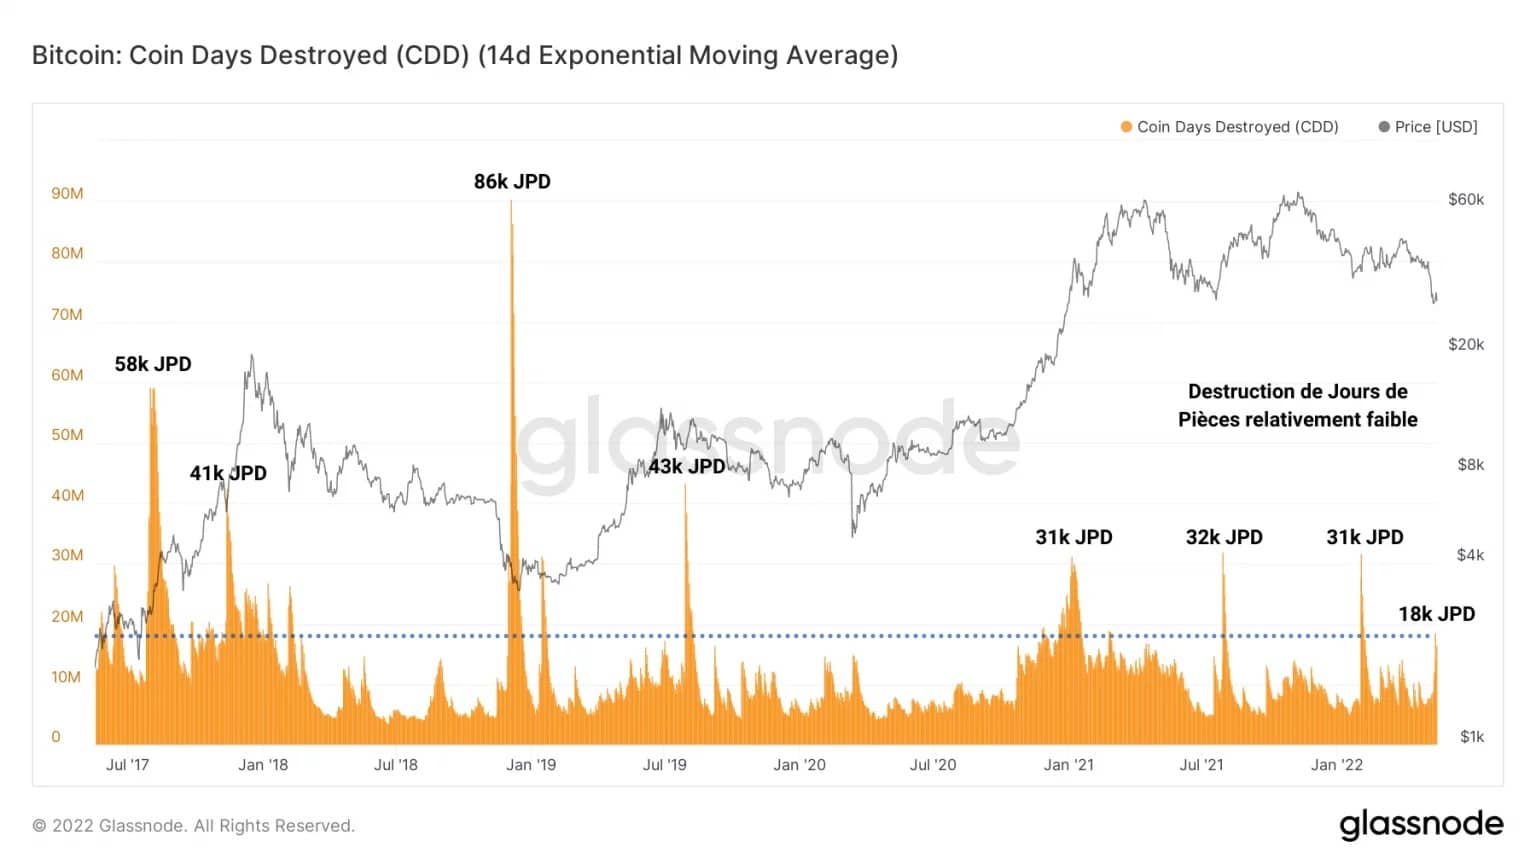
Figure 7: Destroyed Coin Days
The destruction of Coin Days caused by the recent surrender is notably low compared to recent declines, totalling almost 18,000 Coin Days Destroyed (CDD).
This relatively low value marks the absence of a significant volume of elderly coin spending in the past and reveals the palpable stoicism of most HODLers as well as the high price sensitivity of STH.
The visualisation below represents the revived supply (i.e. “supply out of its dormant state”) broken down by age. This chart is particularly useful for studying the movement of old BTC and comparing their purchase price to their spending price.
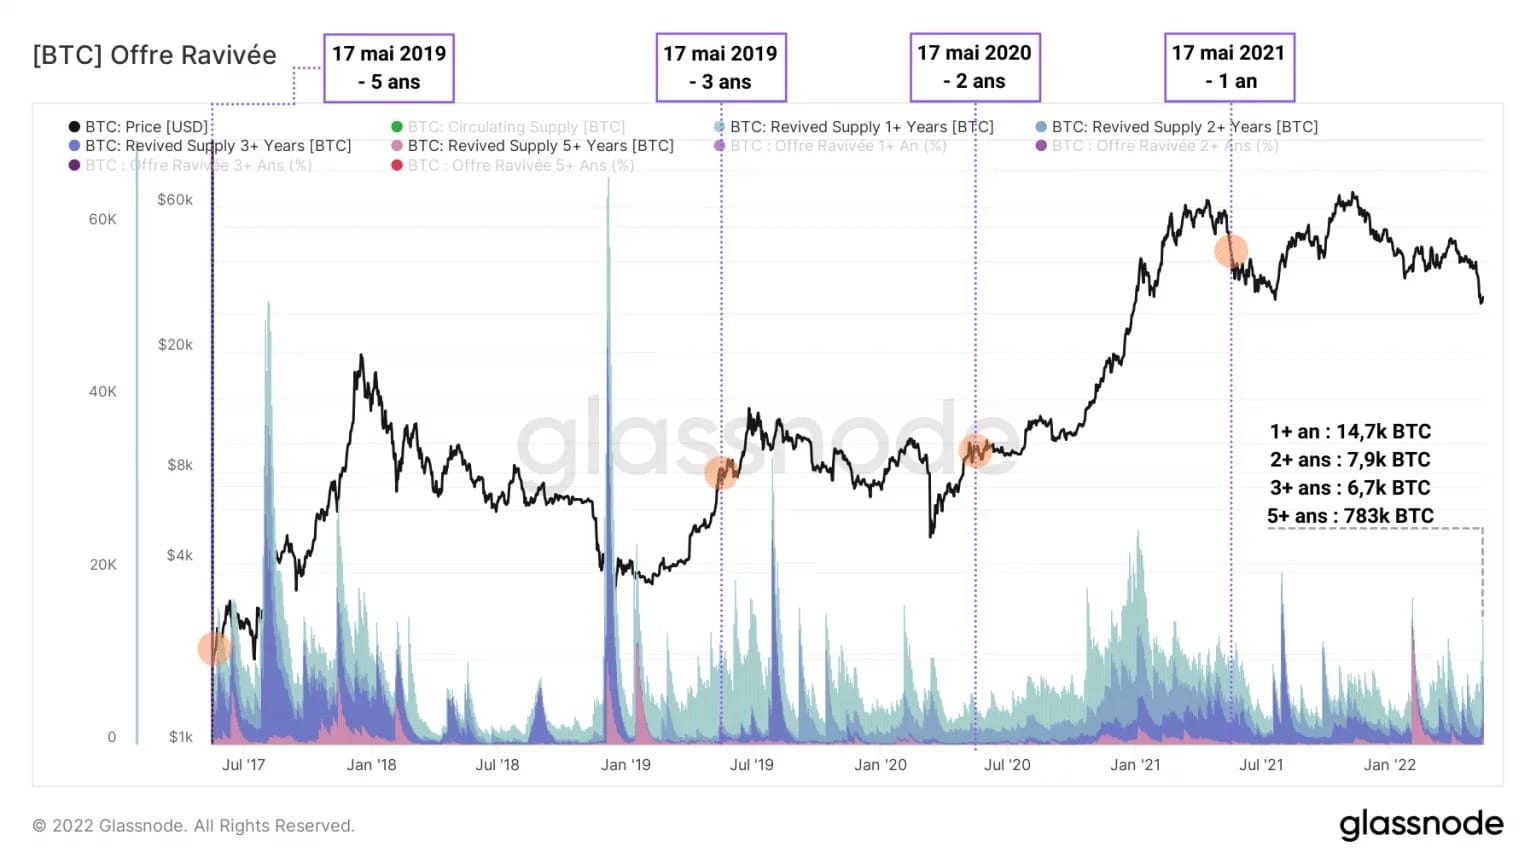
Figure 8: Revived supply
In this case, the lack of significant supply revival is visible compared to capitulations such as those recorded in January 2019 or July 2021.
In fact, half of the supply revived since last week (14,789 BTC) is barely a year old. Going back a year, it appears that these coins were acquired at the start of the May 2021 capitulation, coming with a base cost of between $60,000 and $45,000.
Having been sold when bitcoin fell below $30,000, these revived coins therefore realised a loss of between 50% and 30%.
The age bands of the volume spent corroborate the observations elaborated above in a clear way: when the price fell, almost three quarters (74.44%) of the volume spent was one hour old or less.
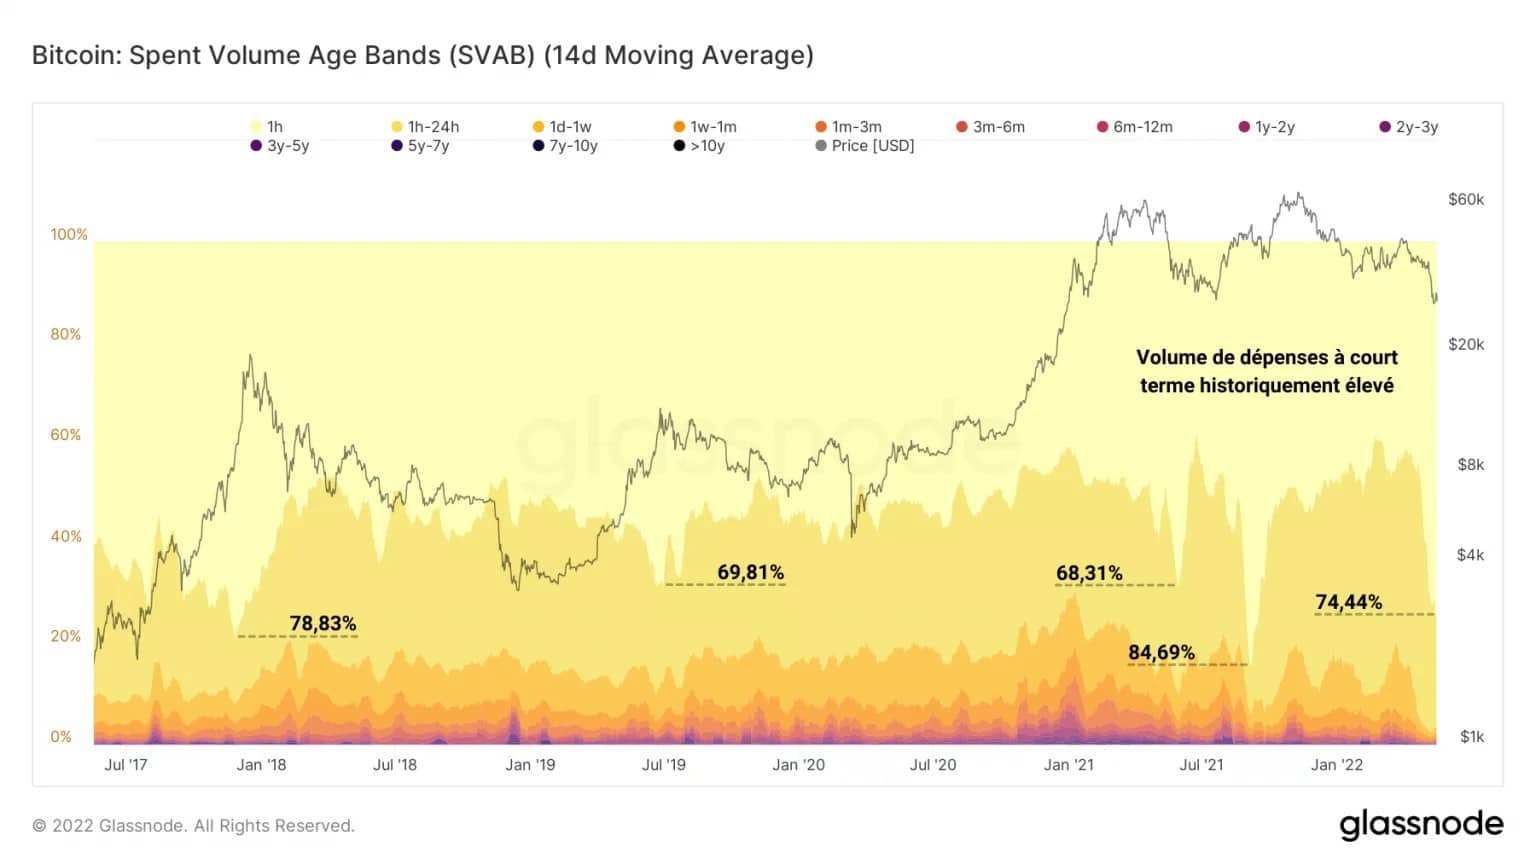
Figure 9: Age bands of volume spent
Comparable to the level reached in July 2021, this measure indicates that a majority of the spending done was held on a very short term basis, by short term investors, speculators or even trading robots.
As a corollary, this again implies that a very small number of long-term investors and HODLers gave in to the panic.
A historic loss-taking… or not
Let’s get to the profitability figures for recent sales. With 1.53 billion in realized losses over an average of 14 days, the market is now experiencing the 2nd largest USD loss taking in its history.
The recent losses are equivalent to the cumulative losses realised in the capitulations of:
- January 2018 ($666 million);
- Jan. 2019 ($350 million);
- March 2020 ($667 million).
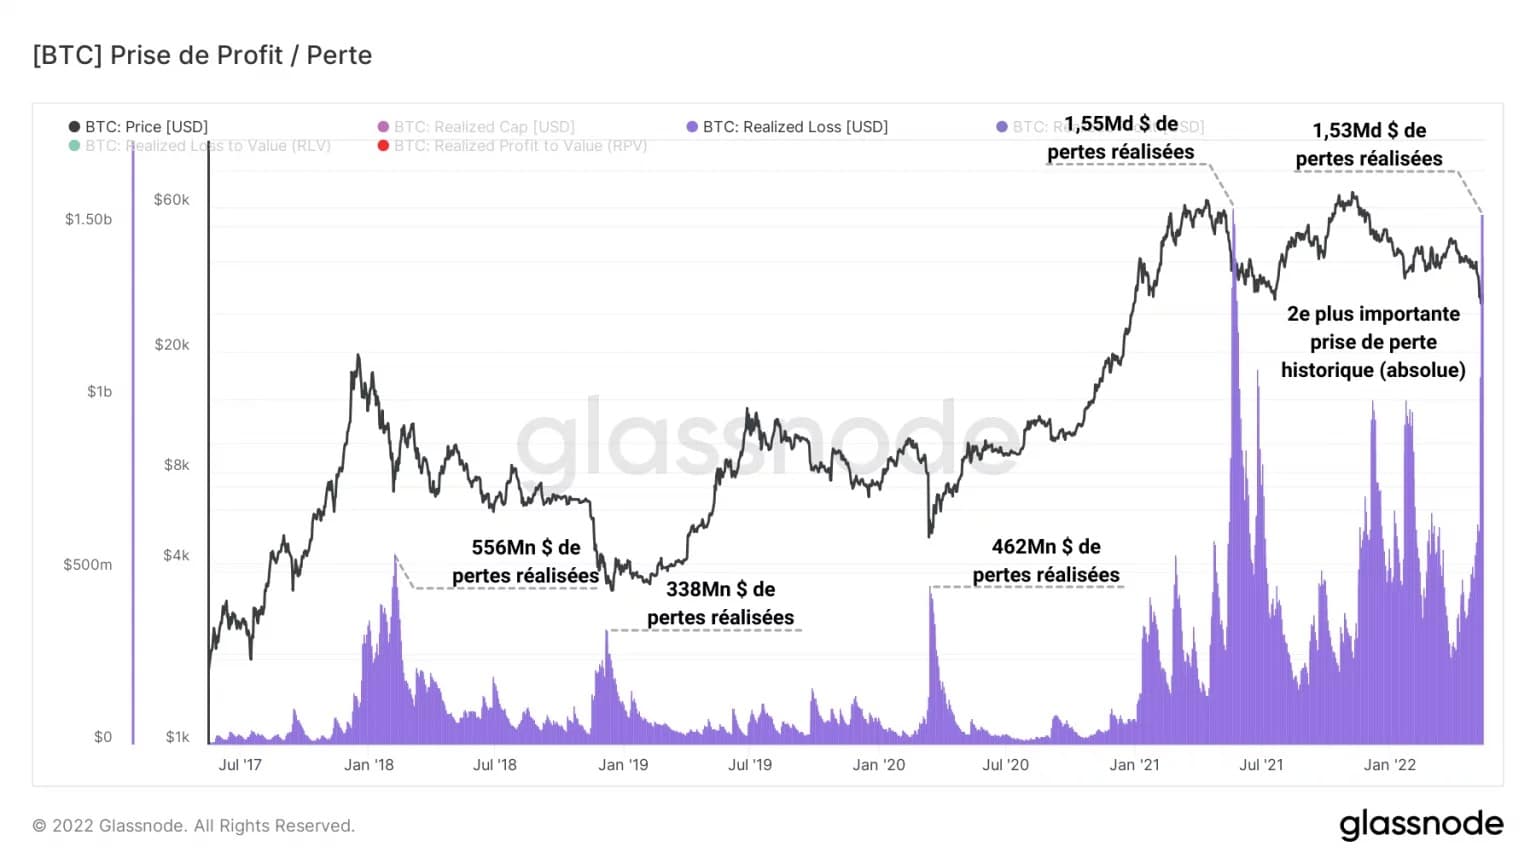
Figure 10: Realised losses (USD)
Denoting the immaturity and greed present in the market, these losses crystallise the pain realised by the market in terms of absolute value.
Yet, there are alternative ways of measuring this loss-taking within the parameters of the current market.
By dividing the realised losses by the realised capitalisation of the market, described as its aggregate cost base, we can obtain an estimate of the realised losses based on the value invested by the market.
The graph below therefore shows the Realized Loss to Value Ratio (RLV), to which an exponential moving average of fourteen periods is applied.
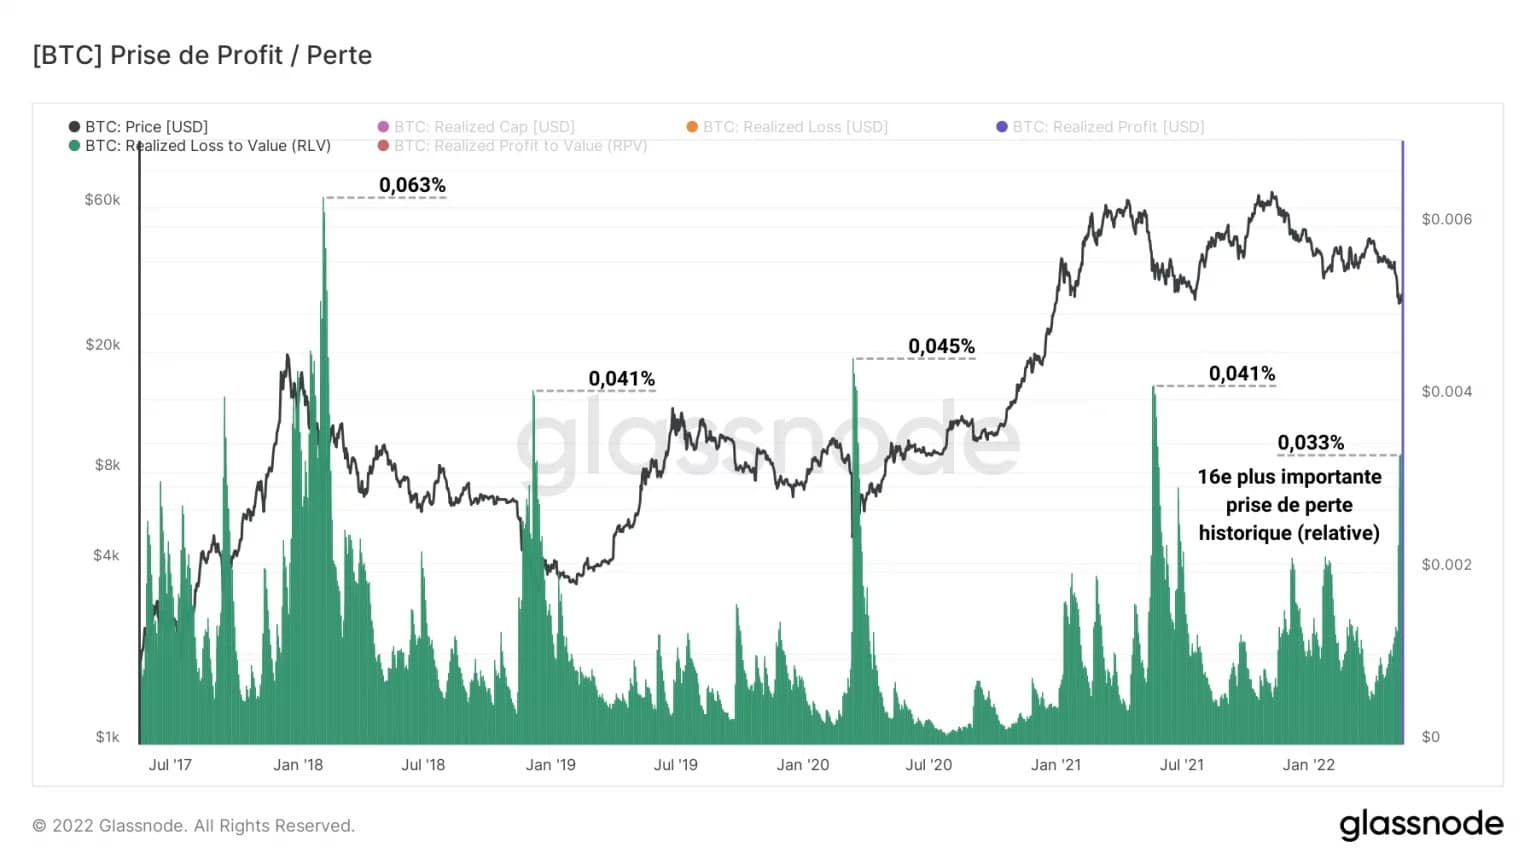
Figure 11: Loss to Value Ratio
It is clear then that the losses made in the last few days represent a tiny percentage of the value taken from the market over the last 5 years.
Far behind the capitulations of January 2018, January 2019, March 2020 and May 2021, the recent loss taking represents only 0.033% of the value realised by the market and ultimately ranks sixteenth in terms of relative value when the entire history of BTC is considered.
Let’s conclude this analysis by studying the profitability of short-term (STH) and long-term (LTH) investor spending.
The SOPR, or profitability of spending ratio, is an indicator that divides the price of a UTXO at its creation by the price of the same UTXO at its destruction. It is therefore equivalent to factoring the purchase price of a part by its sale price.
Concerning STH, holders of BTC less than 155 days old, we can see that the ratio fluctuates a lot, oscillating between great phases of profit and periods of deep losses.
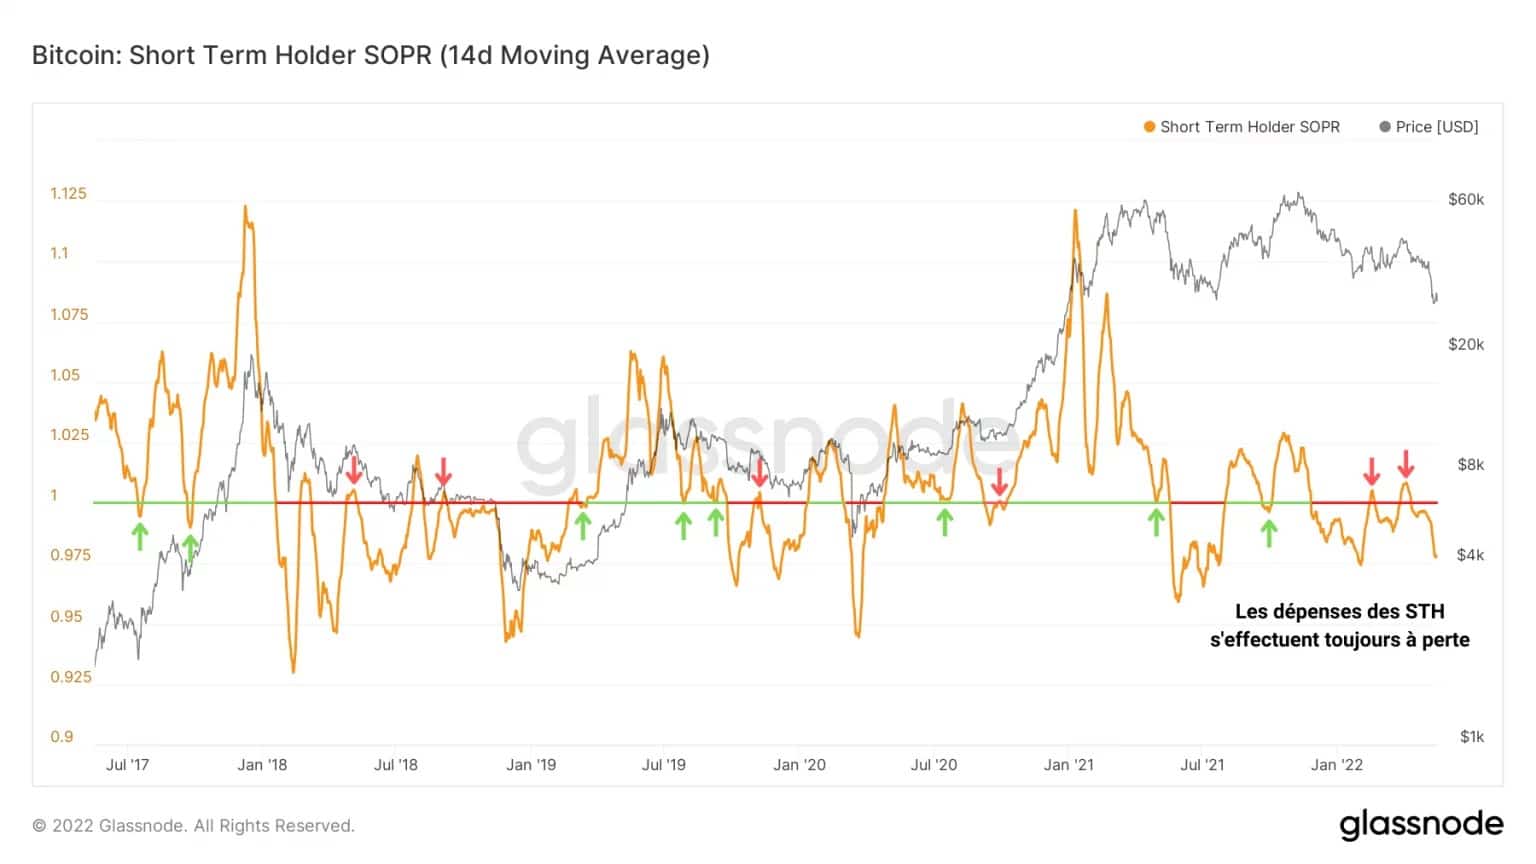
Figure 12: Profitability ratio of STH expenses
The break-even point (STH-SOPR =1) acts as a support or resistance depending on the trend, and its crossing confirms whether or not STH is returning to profitability, often associated with a short or medium term upturn in the price.
As things stand, STHs have been spending their assets at a loss since the beginning of 2022 and are therefore actively participating in the selling pressure.
This cohort is the one that has been burning slowly for months but has just found itself once again with its head under water.
In contrast, LTHs, coin holders aged 155 days and older, are selling closer and closer to their cost base and are gradually shedding BTC accumulated during the early stages of the current downtrend.
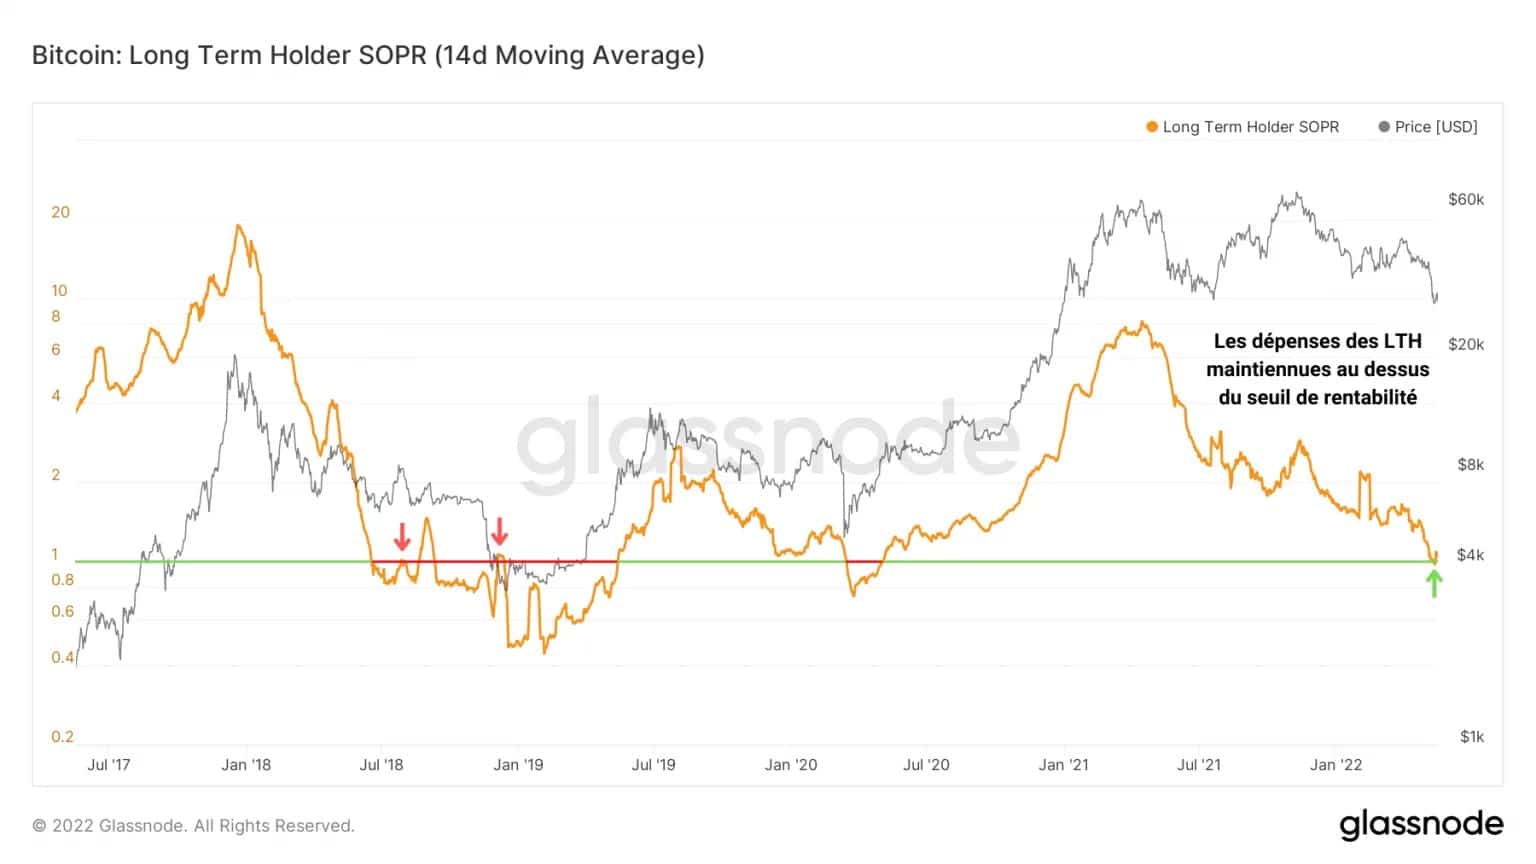
Figure 13: Profitability ratio of LTH expenses
Expenses are currently holding above the break-even point, which acted as a support during last Monday’s capitulation. After a brief stint in negative waters, the LTH-SOPR is back above 1 and appears to be stabilising.
This indicates that, at the time of the capitulation, a minor part of the LTH panicked and accepted losses. As such, within the recent market structure, when the BTC price dips below $30,000, it is the conviction of this cohort that is tested.
Already accumulating significant latent losses identified in previous analysis, long-term investors do not appear to be generally prepared to give in at such price levels.
However, the bottom crossing of the $28,000 level has great potential to test their willingness to HODL and may plausibly cause more pain.
Summary of this on-chain analysis
Overall, with a 57.95% drop, the current downtrend is one of the longest and deepest corrections of the past five years, although the ongoing capitulation forces us to be cautious in the short term.
The spending that occurred this week was particularly young, a sign that the move was mostly driven by short-term investors, and a testament to the strong conviction of HODLers as well as the high sensitivity of STH to volatility.
With a total of 1.53 billion realised losses over an average of 14 days, the market has taken a significant loss in USD, although the losses realised in the last few days represent only a small percentage of the value taken from the market over the last 5 years.
Finally, it appears that STHs have been spending their assets at a loss since the beginning of 2022 and are actively participating in the selling pressure while only a minor portion of LTHs have panicked and accepted losses during the downturn.