
A significant lack of on-chain activity despite the recent rise, coupled with a slight distribution of long term investors indicates weakness in the current attempt at a bullish recovery. It appears that new entrants are few and far between and are still acting cautiously, while some have taken advantage of the rally to cut their positions near breakeven. On-chain analysis of the situation
Bitcoin is back in range
The price of Bitcoin (BTC) is back in range after posting a local high of $24,123. Back towards the $21,000 level, the short-term uptrend seems to lack maturity and traction.
Onchain data on network activity shows a significant lack of investor engagement in recent weeks.
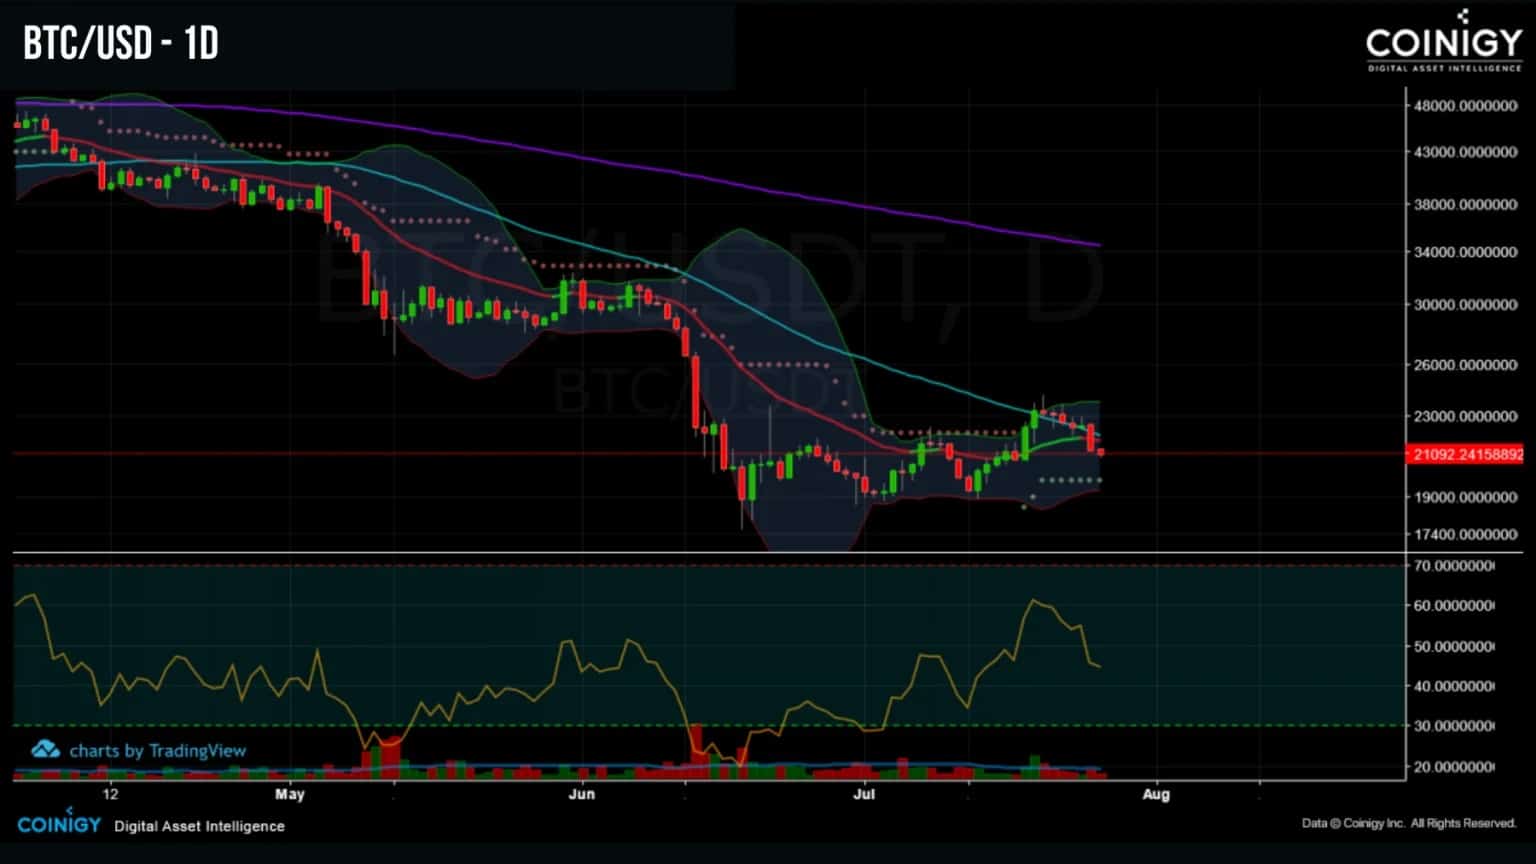
Figure 1: Daily BTC price
In order to assess the level of commitment shown by participants in the current bear market we will look at:
- onchain data on network activity;
- the spending behaviour of long-term investors.
Little activity despite the rise
One of the dynamics that can be used to detect a market regime change is the activity generated by participants on the Bitcoin network.
In bull markets, participants tend to make many trades, either to take positions or to take profit from pre-existing positions.
The opposite occurs in bear markets, when the majority of speculators abandon the market (red), leaving the network to its last resort users: the HODLers.
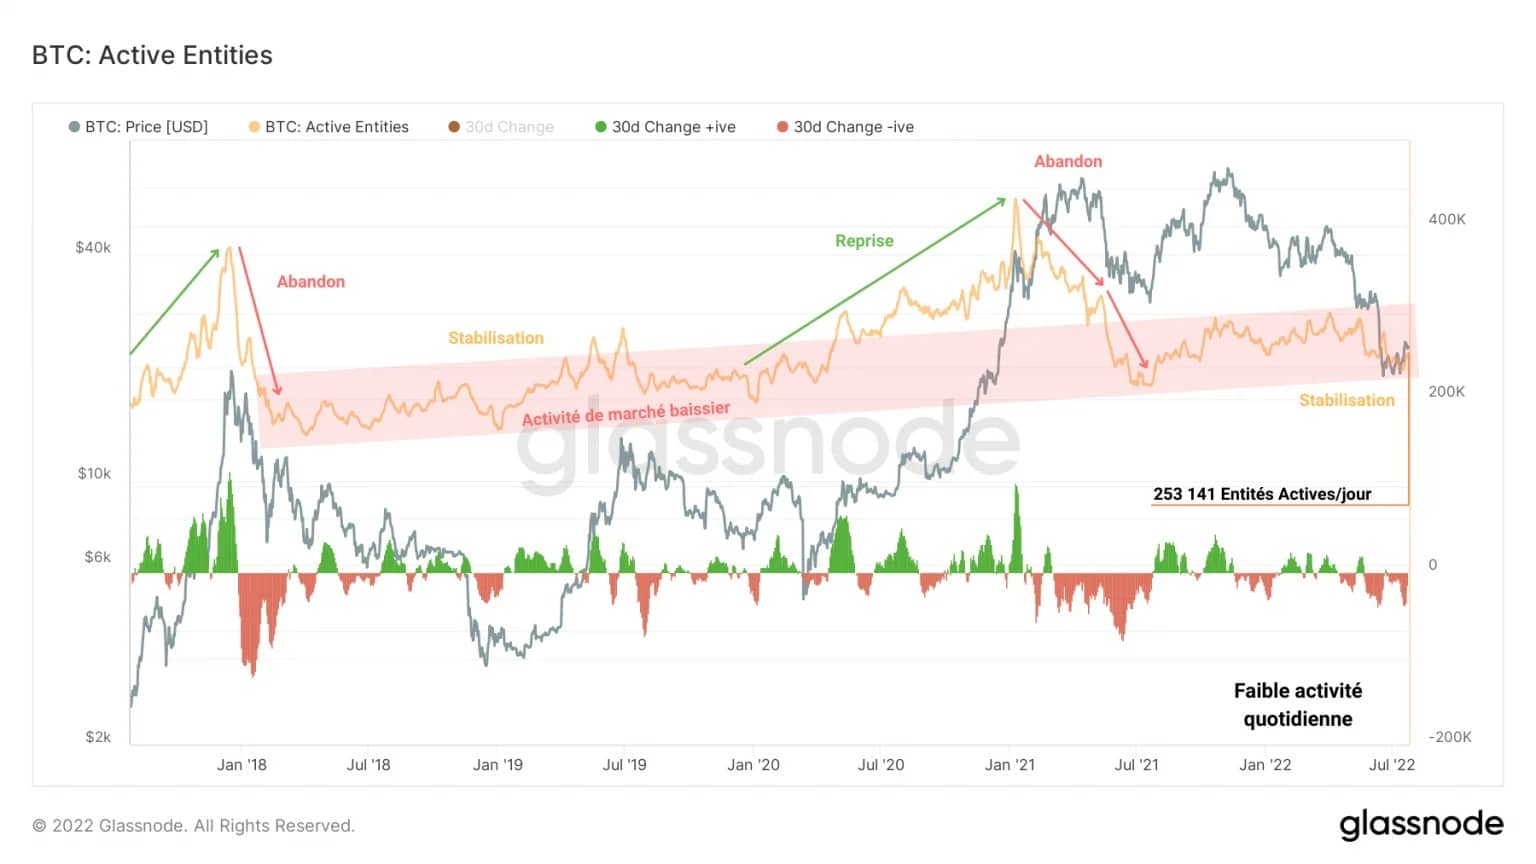
Figure 2: Active entities
Currently, we can see that the number of active entities present on the network has not changed much since our last analysis of on-chain activity.
It seems that last week’s increase did not generate significant excitement from market participants.
Indeed, the metric below, measuring the number of new entities joining the network on a daily basis, continues to stabilize near the bottom of the bearish activity channel identified last month.
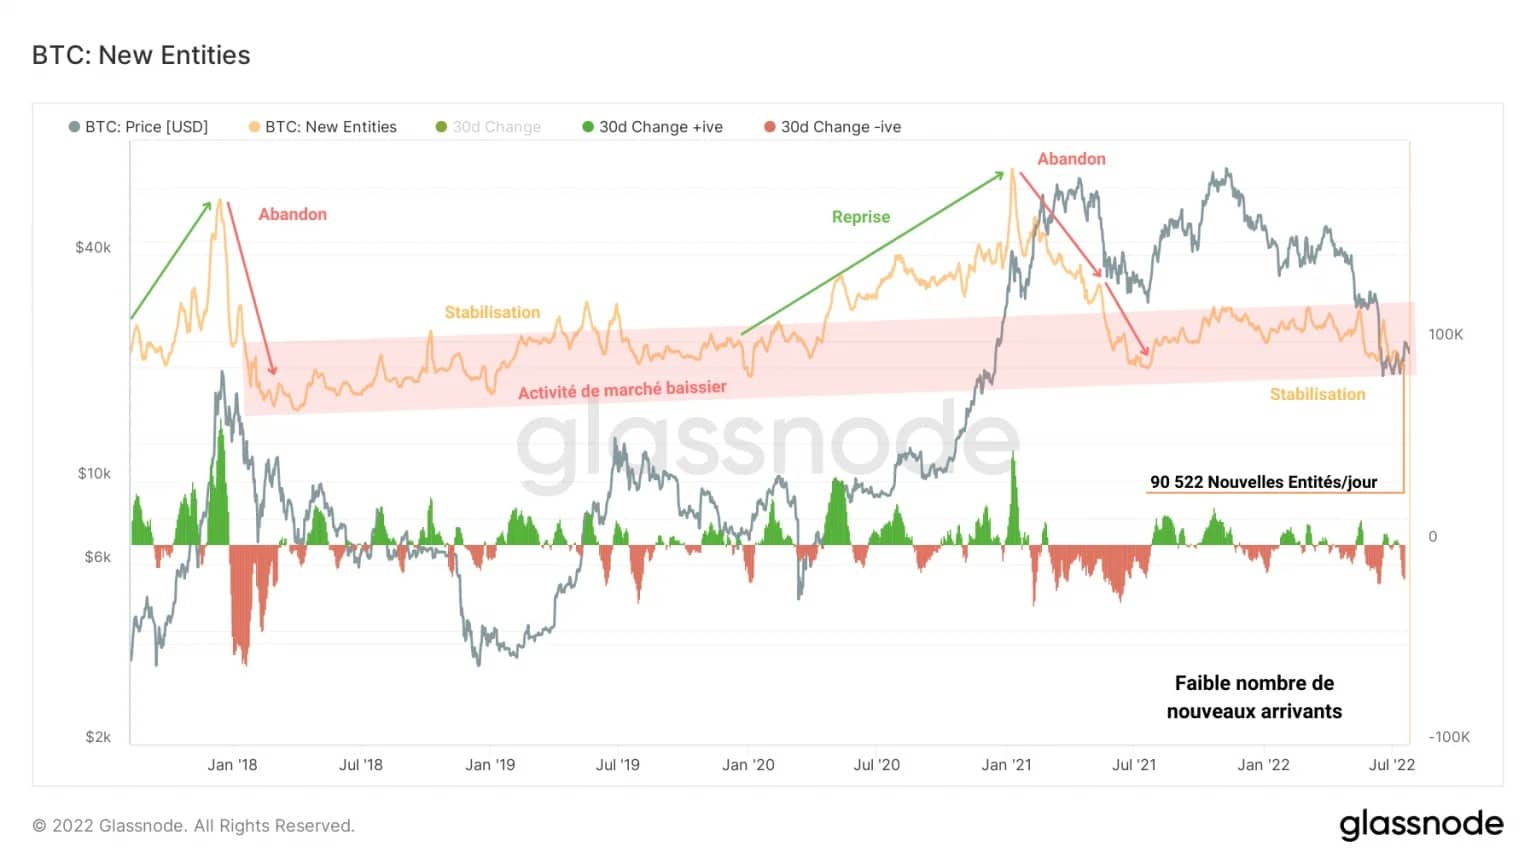
Figure 3: New Entities
This data shows a clear lack of interest, which can be explained by the unhealthy macroeconomic, geopolitical and energy context, warning potential investors to avoid exposure to asset classes considered “risky”, such as cryptocurrencies.
This tells us that, although a bear market bottom is forming, we are still not out of the woods.
Another metric that leads to this conclusion is the measure of the number of on-chain transactions made daily. This metric, while rising over the long term, has stabilised since September 2021 between 230k and 200k trades per day.
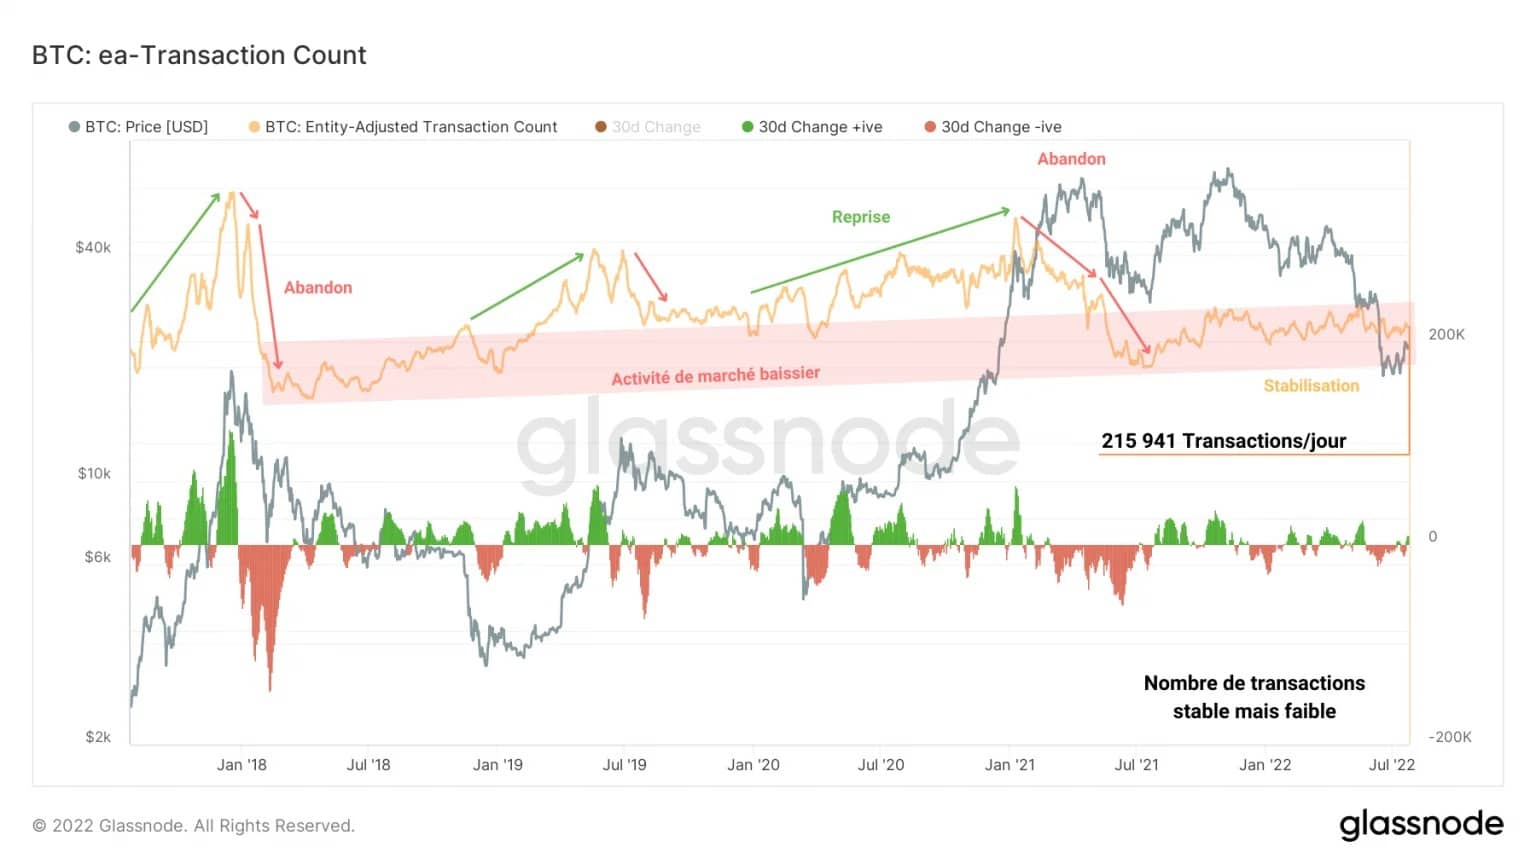
Figure 4: Number of Transactions (Adjusted by Entities)
This low but stable number indicates that HODLers are now concentrating the majority of demand for block space, while the few new entrants are conserving their energy until a more favourable market environment arises.
This lack of significant on-chain activity does not support a bullish scenario and suggests potential weakness in the recovery, which would cause us to retest the lower bound of the range before confirming a long-term trend reversal.
The fees generated by participants’ transactions on the exchanges are another way that leads us to a similar conclusion: the demand for block space is particularly low.
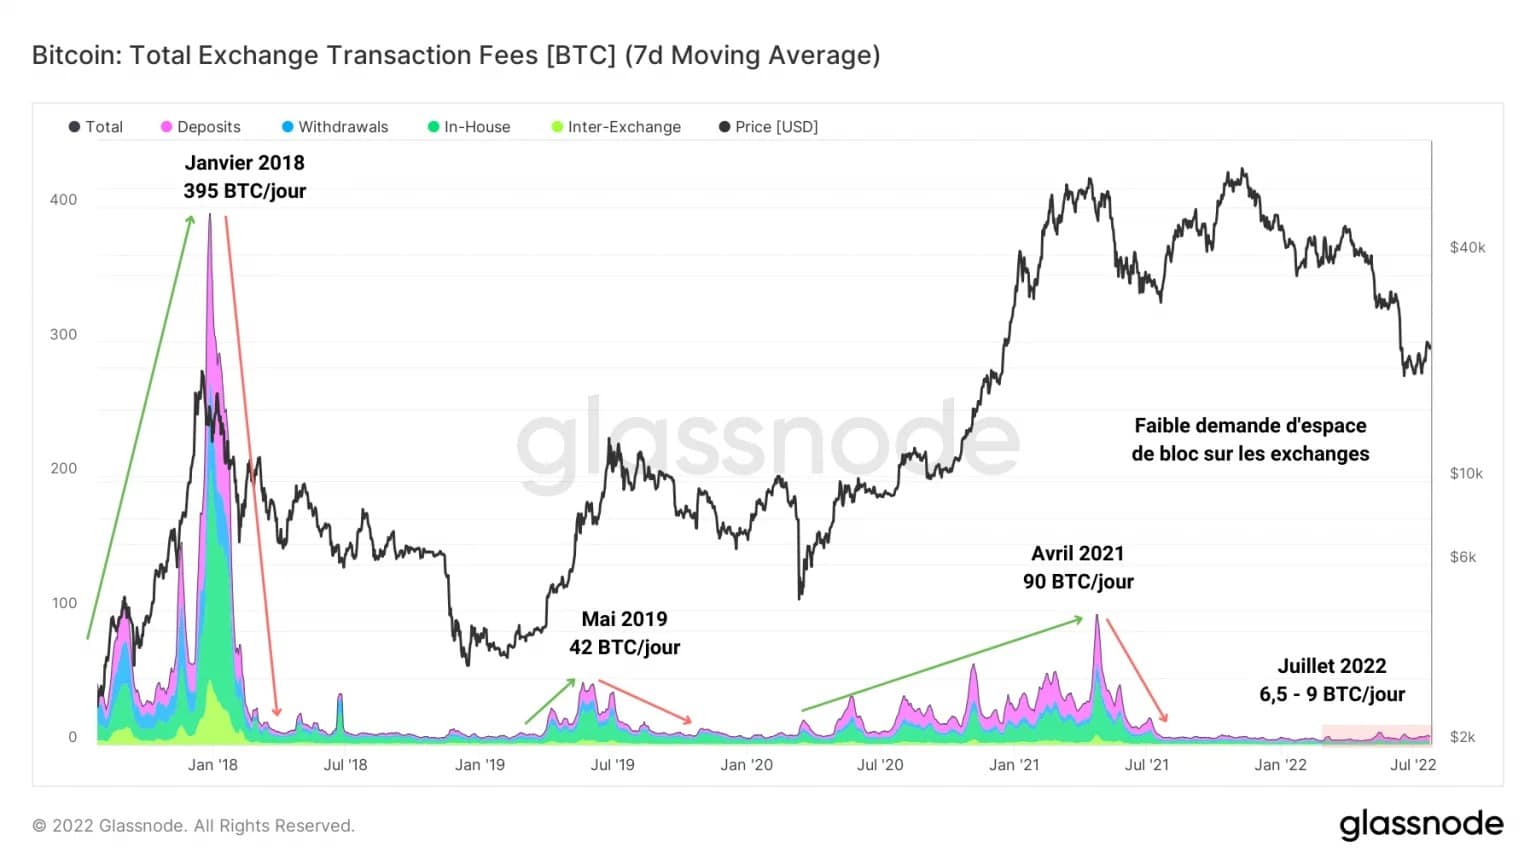
Figure 5: Exchange fees
Having fallen by 90% since April 2021, the fees paid by investors to deposit on exchanges (in order to see their transaction included in the next block, thus quickly) are close to an all-time low.
It seems that no one wants to rush and pay a high price to have their transaction validated, a sign that there is no urgency on the chain.
This lack of commitment and willingness to act will have to give way to a rise in on-chain activity data to indicate a return of investor excitement.
Long-term investors are trickling in
Another dynamic worth noting is the recent spike in destroyed coin days (DCD), a sign that some long-held BTC has been spent.
While the measure of JPDs older than 6 months – associated with long-term investors – has been structurally declining since the beginning of 2021, the recent spike warrants further attention.
Totalling over 13 million JPD, it signals spontaneous spending of old coins following a price increase within an overall downward trend.
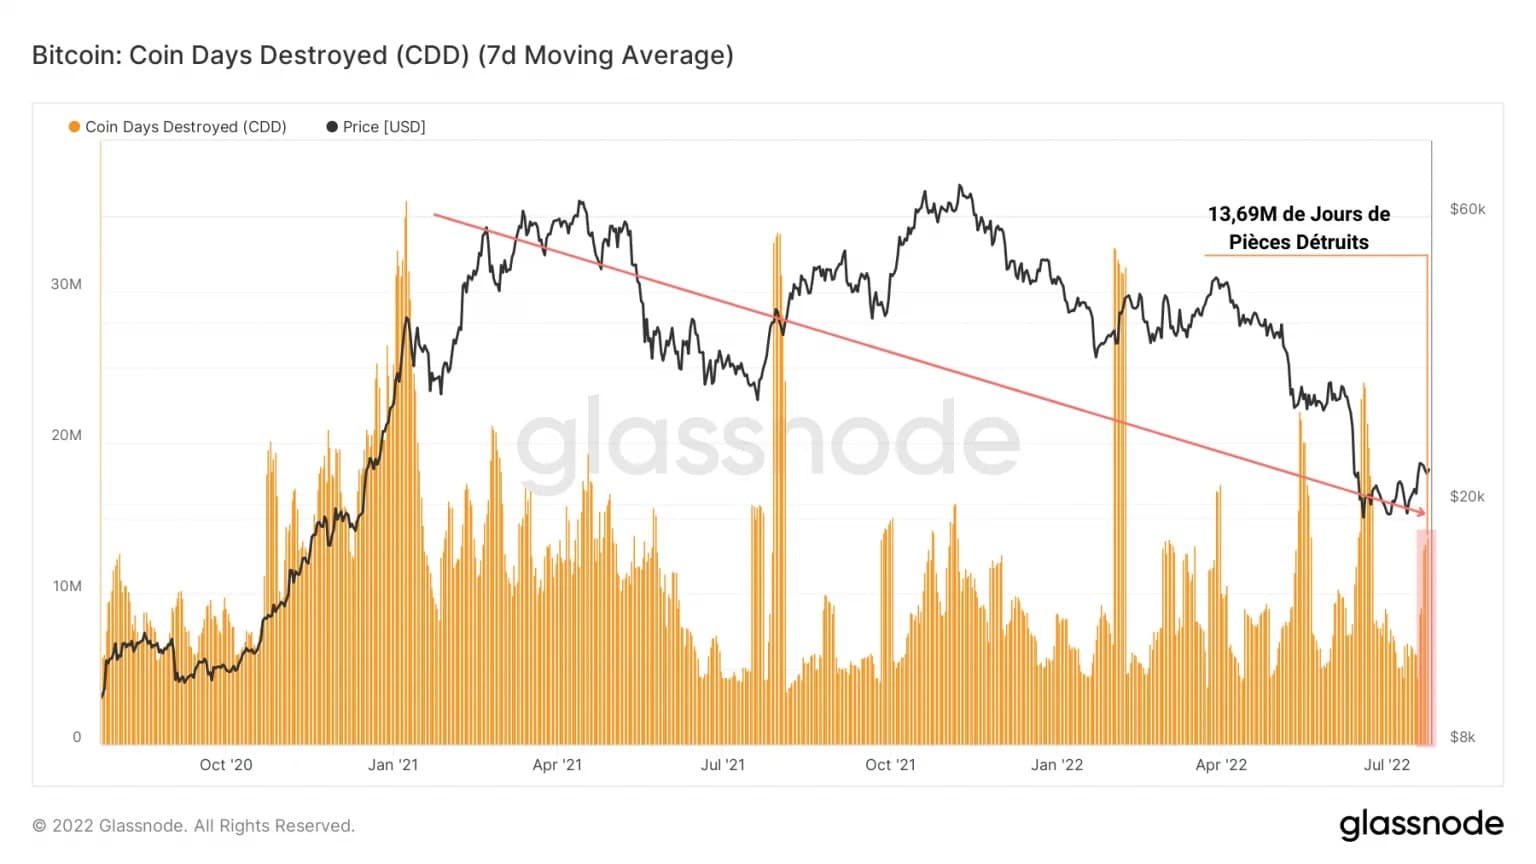
Figure 6: Days of Coins Destroyed
At first glance, this looks like an attempt to cut off positions, by some long-term investors, close to their break-even point.
Supporting the previous observation, the liveliness tells us that recent spending has caused a slight rejuvenation of BTC in circulation.
Providing insight into the saving or spending behaviour of long-term investors, liveliness:
- increases when the spending of old UTXOs dominates;
- drops when spending by young UTXOs dominates.
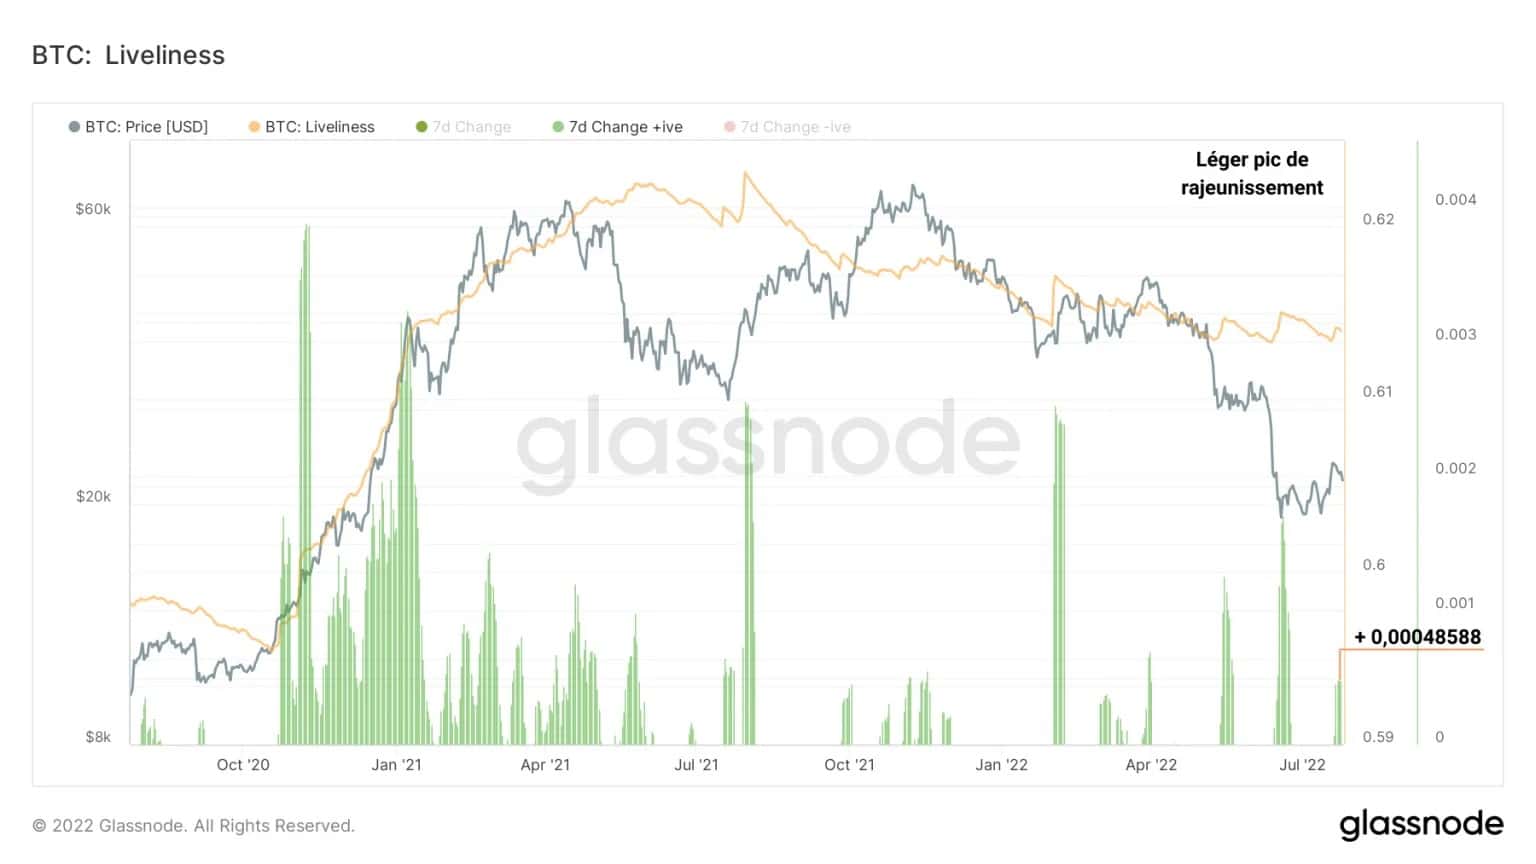
Figure 7: Liveliness
The magnitude of this increase in liveliness is minimal at this point compared to the recent bearish volatility events in May or June.
However, seeing old UTXO being spent on a bullish recovery attempt is not necessarily encouraging in the short term.
This thesis is confirmed by the evolution of the supply held by LTH over the past week.
Indeed, it appears that a moderate wave of spending has taken place within this cohort, with over 100,000 BTC exiting LTH portfolios.
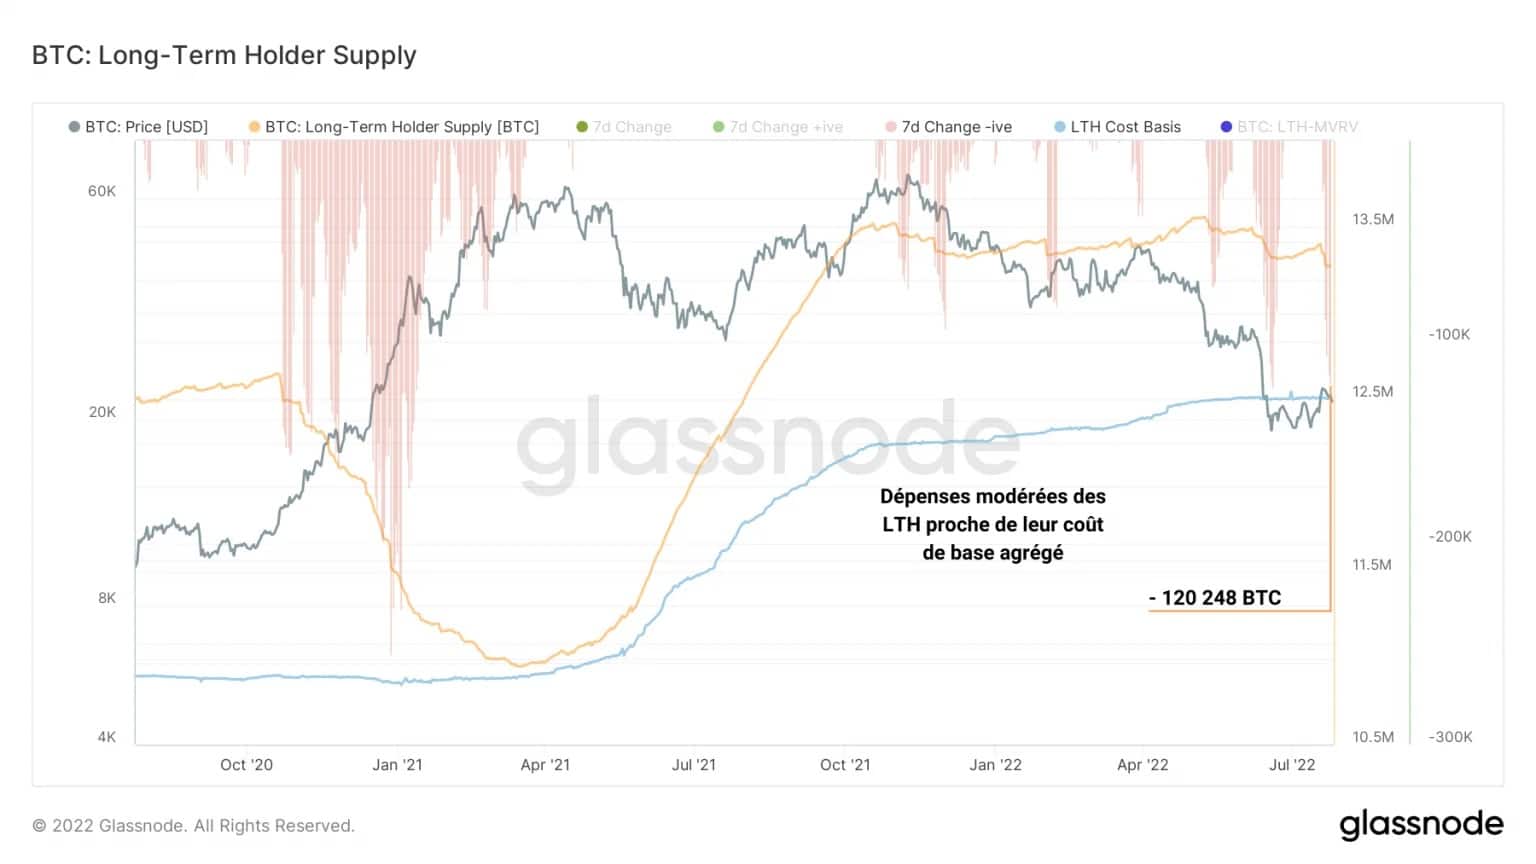
Figure 8: Supply held by long-term investors
The fact that this spending is taking place at a time when the market price is back above the cost base of this cohort indicates a willingness by some long-term investors to exit the market by selling BTC close to their cost base, valued at $22k.
We are therefore witnessing a – albeit moderate – exit event from these investors, despite their strong conviction. It would be appropriate to remain wary in the short term.
Summary of this onchain analysis
In sum, this week’s data reflects weakness in the price recovery, which has generated minimal excitement among the participant cohorts.
The on-chain activity metrics are all moving within their bearish activity regime and have not reacted significantly to the recent market rally. It appears that new entrants are few and far between and are still acting cautiously.
A spend of over 100k BTC from long term investors indicates that a minor portion of LTHs have taken advantage of the recent rise to close out positions close to breakeven, indicating a potential willingness to exit the market.