
A resurgence in Bitcoin (BTC) on-chain activity suggests a return of interest and commitment, while the breakeven test of spending profitability indicates that a decisive dynamic is taking place. On-chain analysis of the situation
Signs of vendor burnout are mounting
Following a period of historically low volatility, the price of Bitcoin (BTC) has exited the $20,000 level from above, moving above the 20 and 50 period moving averages until today’s decline.
Recent downward price resistance, coupled with observations of speculator caution, short-term investor accumulation, and long-term maturation and HODLing, reinforces the thesis suggesting that the current bear cycle is inexorably nearing its end.
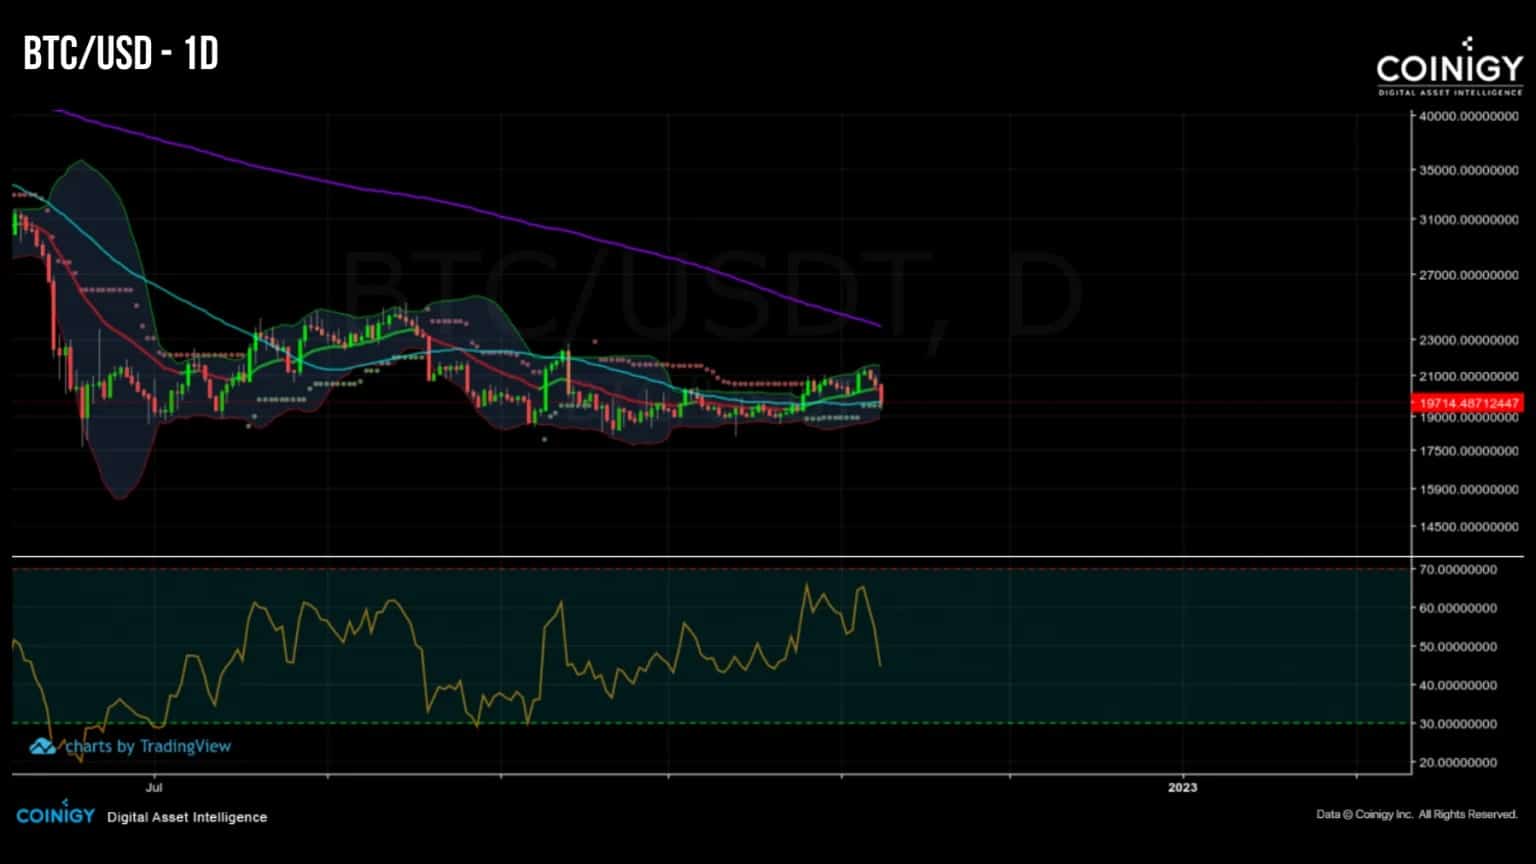
Figure 1: Daily BTC price
This week we will look at:
- the activity of entities on the chain;
- transactions pending in the mempool;
- the balance of realized profits/losses.
Resumption of on-chain activity
In our last analysis of on-chain activity, we highlighted a significant lack of user engagement in the Bitcoin network, resulting in disinterest and abandonment of the market by the least convinced participants (in blue, then orange).
However, the count of active entities has shown encouraging signs of recovery since October. Rising from 230,000 to 250,000 in nearly 30 days, this indicator shows a slight recovery in network solicitation, accompanying the price increase from $18,000 to $20,000.
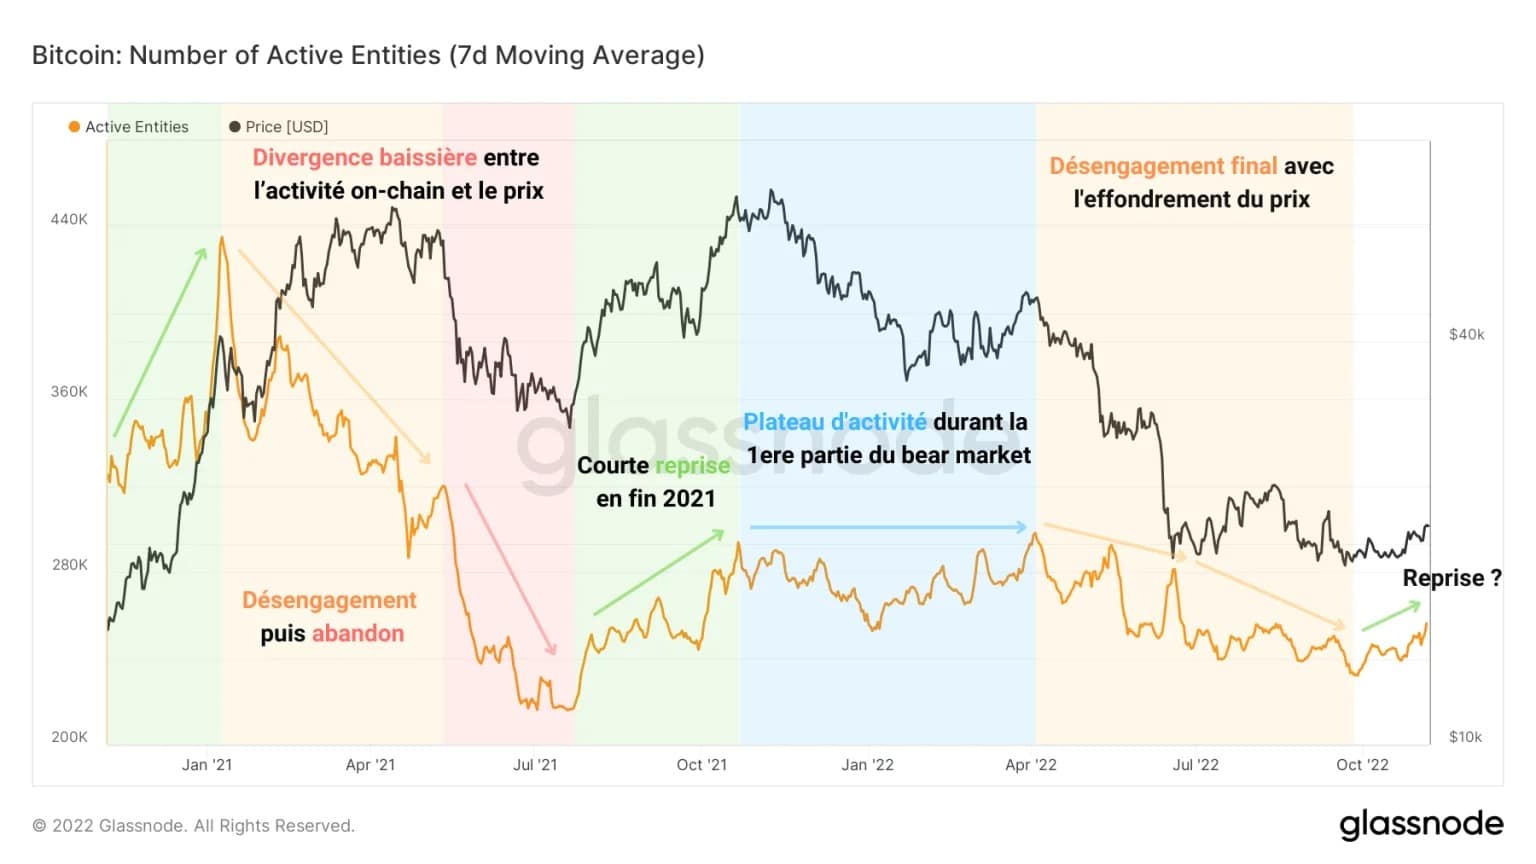
Figure 2: Number of active entities
This signal, still young, deserves to be considered but will need time to be confirmed to constitute a significant argument in favour of the bullish bias.
This recovery is particularly visible through the measurement of the number of transactions made on the network. Having traded below a ceiling of around 230k trades per day for almost a year, this indicator is sending out similar signs of recovery to those of March and April 2021.
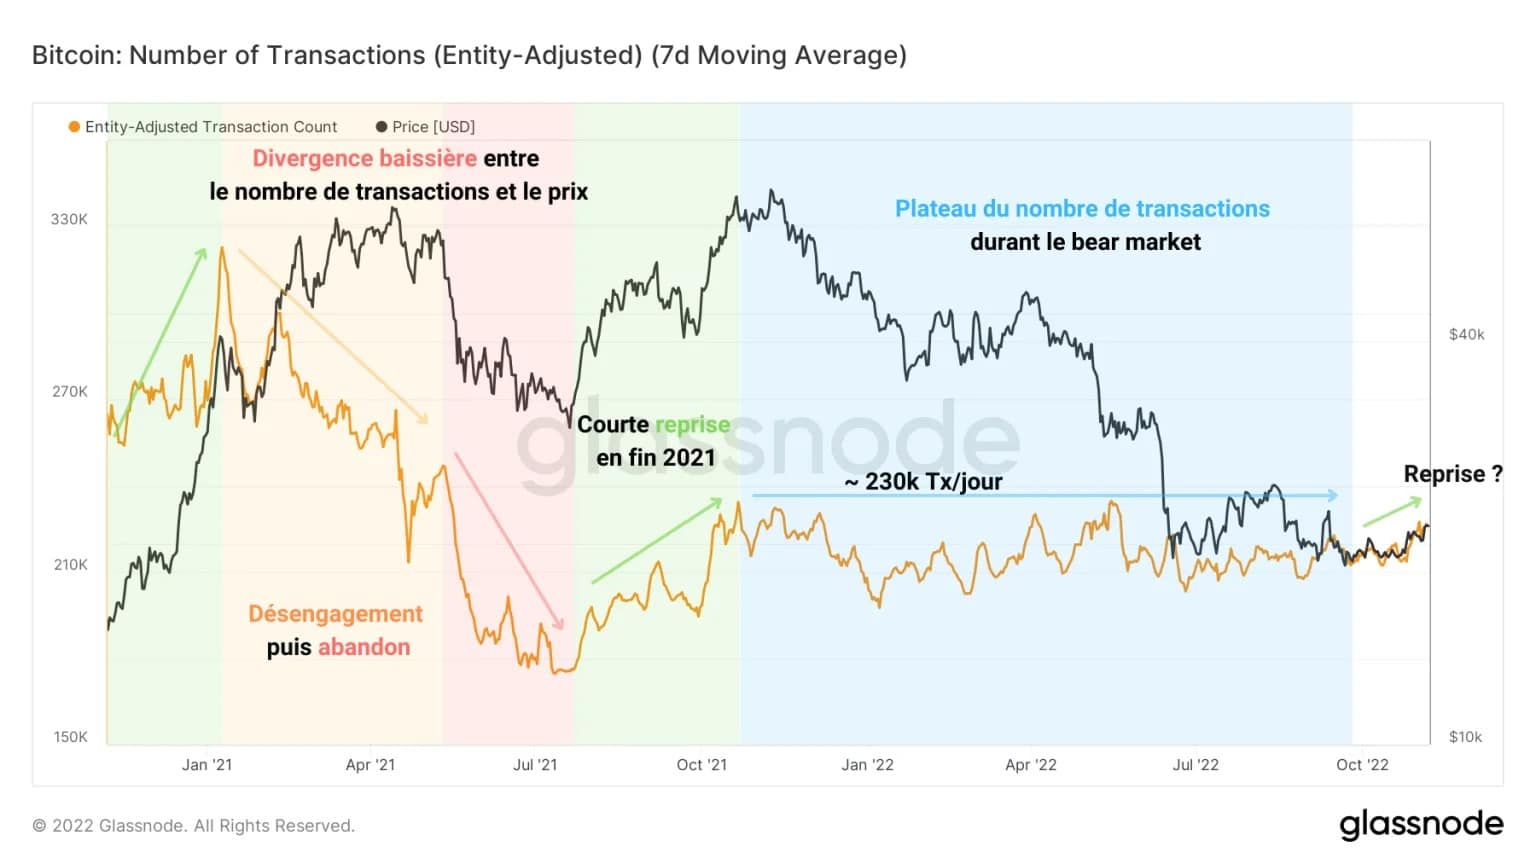
Figure 3: Number of transactions
The fact that a price increase is followed by a growth in the number of transactions is indicative of the interest of a portion of participants who are regaining confidence as the down cycle loses momentum.
A break of this measure above 230,000 transactions per day would be a very promising signal of commitment from on-chain entities.
The latter, gradually regaining confidence, and attracted by the current low prices, would resume their activity in a gradual and palpable manner as seller exhaustion dissipates their pessimism.
Concrete signs of commitment
Another way of looking at the level of demand and activity on the Bitcoin blockchain is to look at the mempool, the storage pool of transactions waiting to be validated.
Typically, an increase in the number of transactions, BTC and fees waiting in the mempool is synonymous with network congestion and a desire to include a transaction in the next block.
This phenomenon was particularly visible on 13 May 2021, when the price of BTC broke the $30,000 level following the collapse of the Terra/LUNA ecosystem, reflecting a sense of urgency and panic.
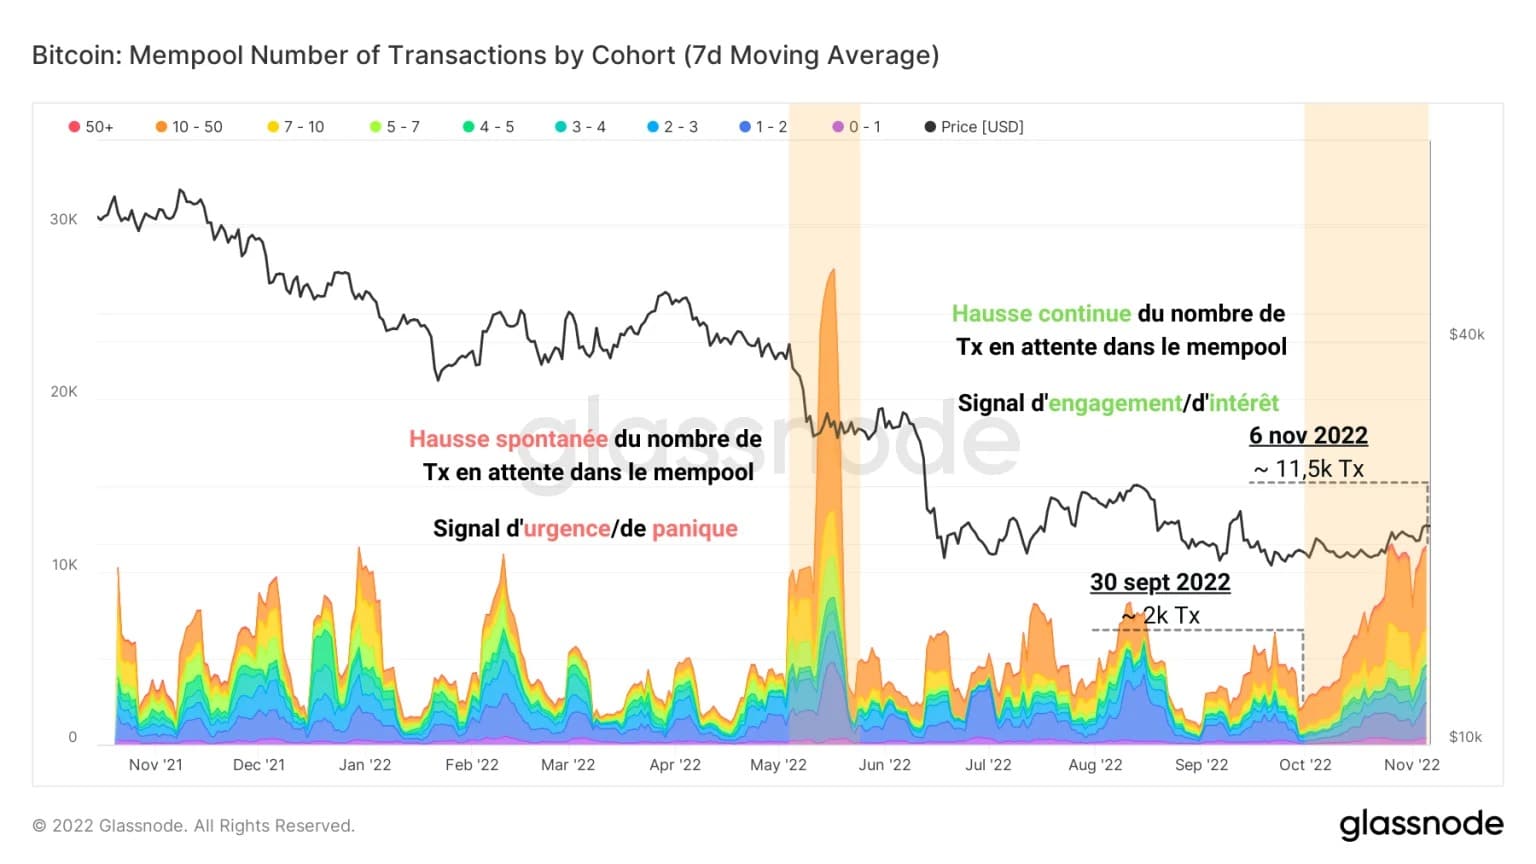
Figure 4: Number of transactions in the mempool
Since the beginning of October, a sustained increase in the number of transactions stored in the mempool indicates a return of interest and desire on the part of participants to complete their transactions as quickly as possible.
Confirming this, the number of fees associated with pending trades is also on the rise, indicating that participants are willing to deploy the capital necessary to see their trade validated.
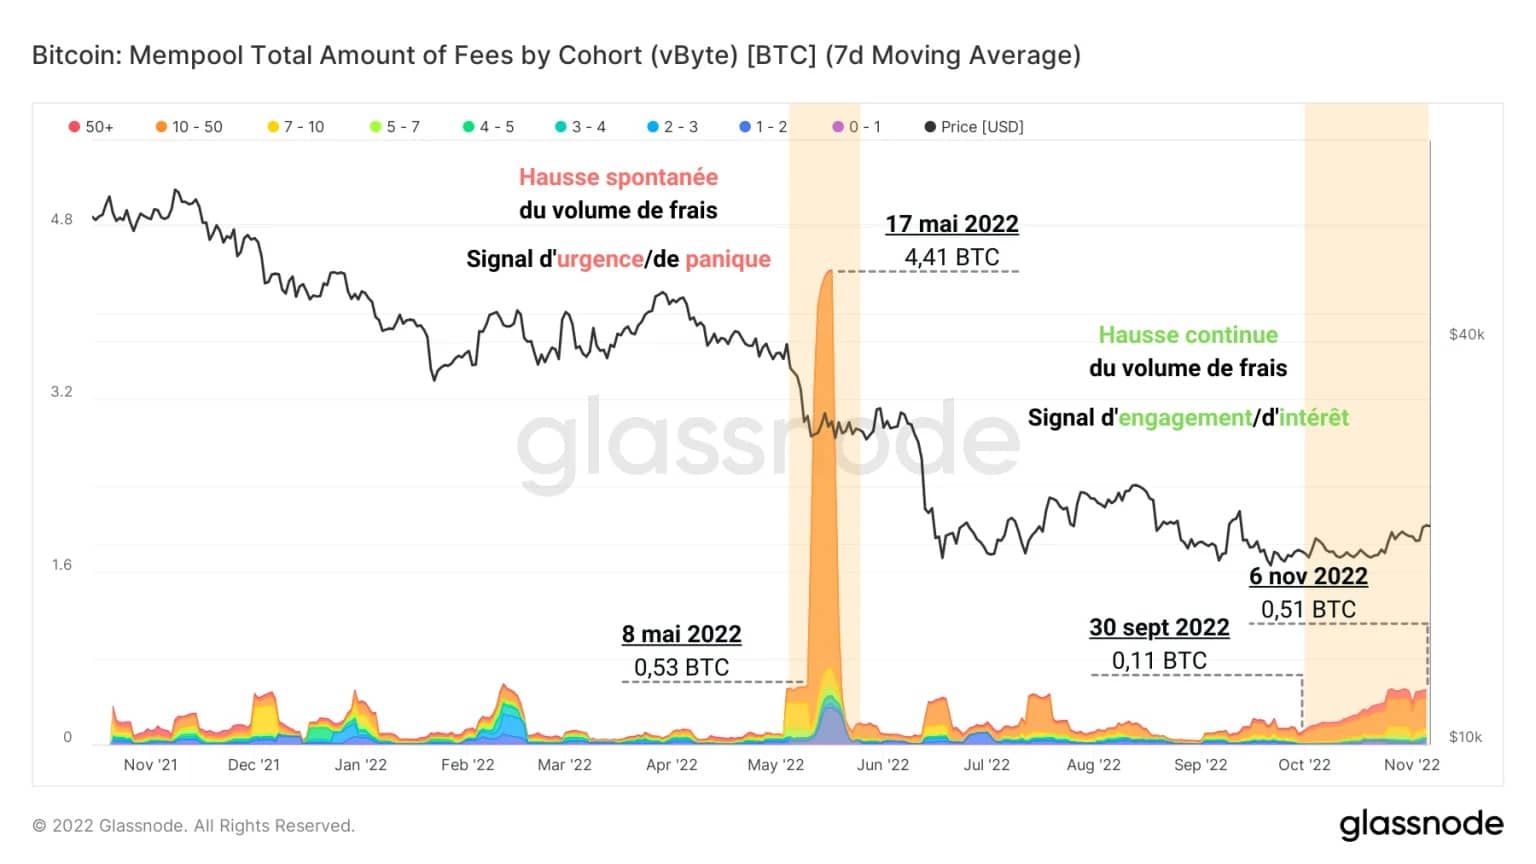
Figure 5: Volume of fees in the mempool
From 0.11 BTC on September 30 to 0.51 BTC on Sunday, this account has increased fivefold in one month, a significant increase.
This signal of interest and return of demand on the blockchain will be followed in our upcoming analysis to monitor this dynamic closely and identify a potential influx of new demand.
For a better understanding and appreciation of on-chain analysis, check out our podcast on the subject:
New test of the profitability pivot point
For once, the profitability pivot point mentioned in August is currently being tested as resistance.
The following chart shows the ratio of profits to net realised losses. Periods of positive profitability (green) are typical of bull markets, while periods of negative profitability (red) take place during bear cycles.
The pivot point between these two phases is concentrated around the neutral zone (realised profit/loss ratio = 1) and symbolises the equilibrium point between the two dynamics.
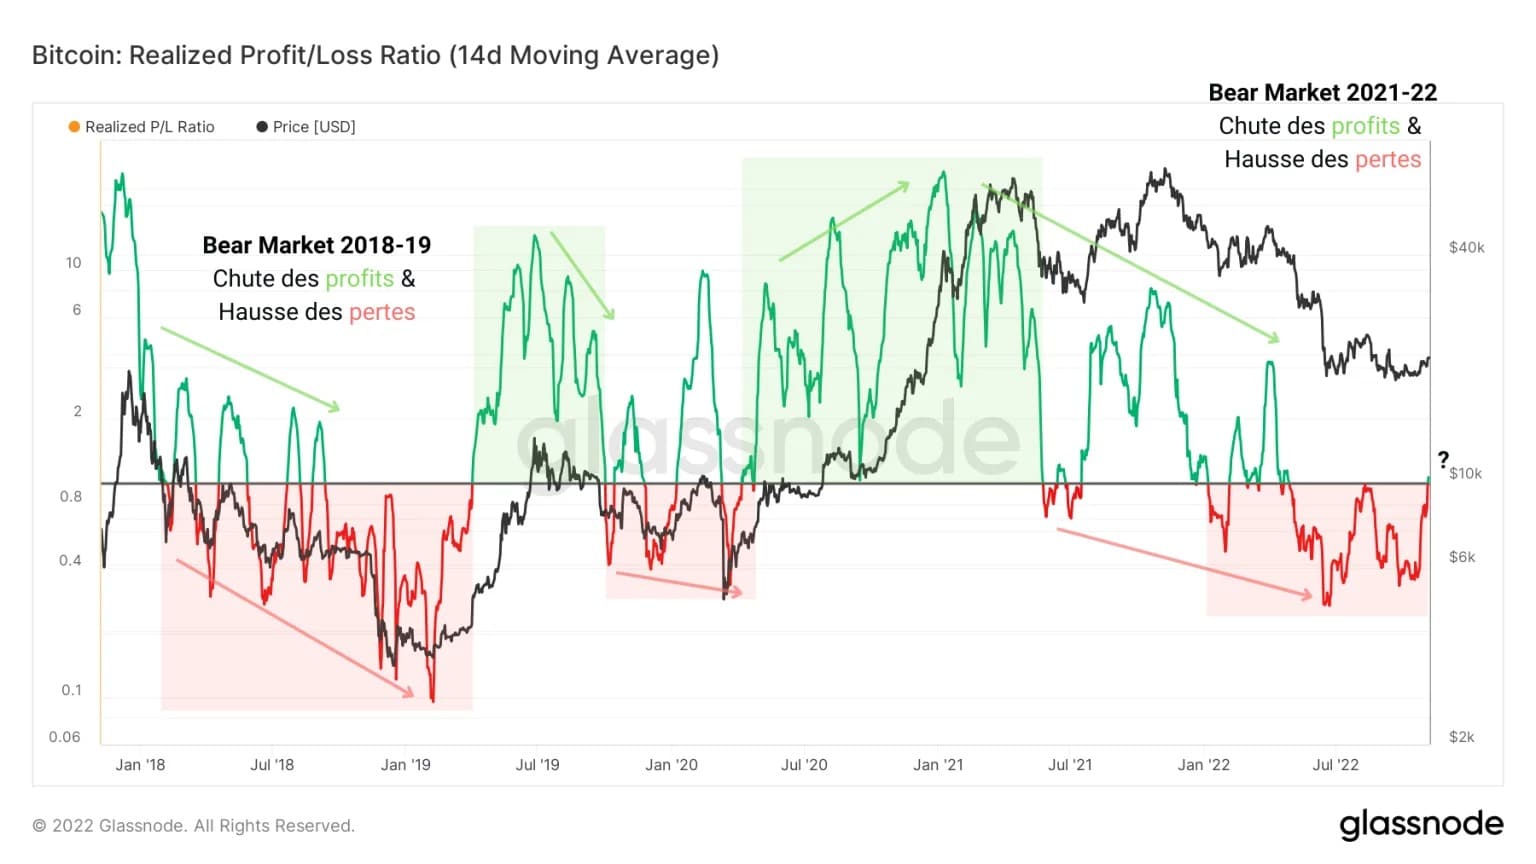
Figure 6: Realised profit/loss ratio
An upward break of this level would indicate a return to positive profitability of overall spending and would favour the return of a constructive bullish bias for the price action in the long term.
This level is clearly discernible via the measure of the expense profitability ratio (aSOPR), an analogous metric that calculates the average profitability of settled transactions over a given period.
Here too, we see that the neutral zone is currently serving as upward resistance (red arrow), meaning that participants favour selling when the price approaches their cost base.
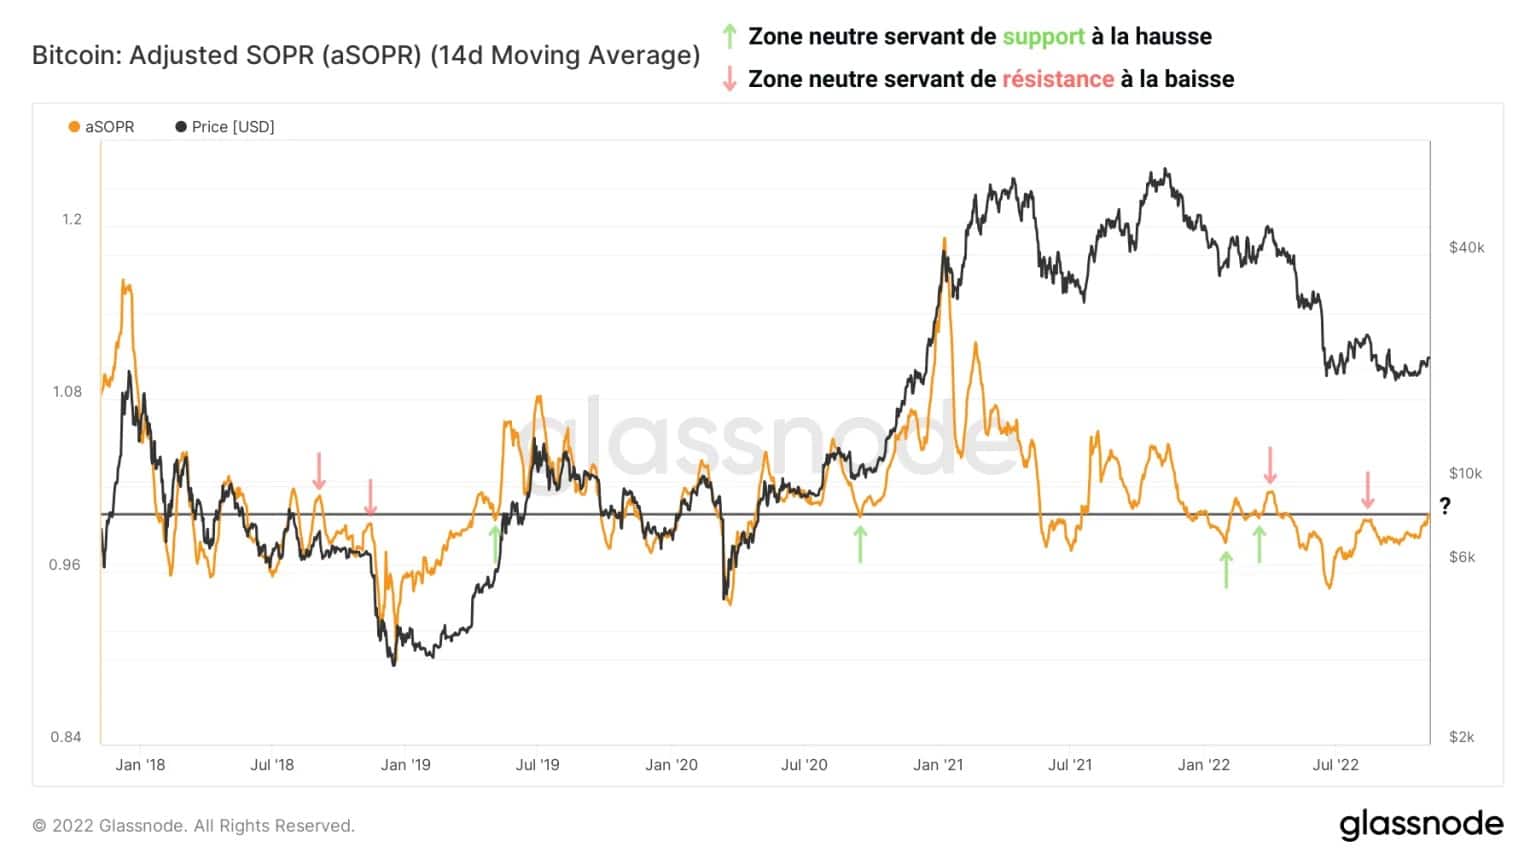
Figure 7: Expense ratio
A healthy dynamic would be to see the aSOPR rise above this pivot point, reflecting the confidence of investors who prefer to hold their position, or even double down close to their cost base, rather than limit their exposure.
The current profitability environment is reminiscent of August 2022, which ended in a dead cat bounce scenario, with investors leaving the market due to mistrust and limiting the losses.
That said, taking into account the dynamics mentioned in the introduction, it is plausible that the outcome of this test will be different.
By selecting the profitability of coins less than 155 days old, associated with short term holders (STH), we can notice that the STH-SOPR has already crossed the neutral zone.
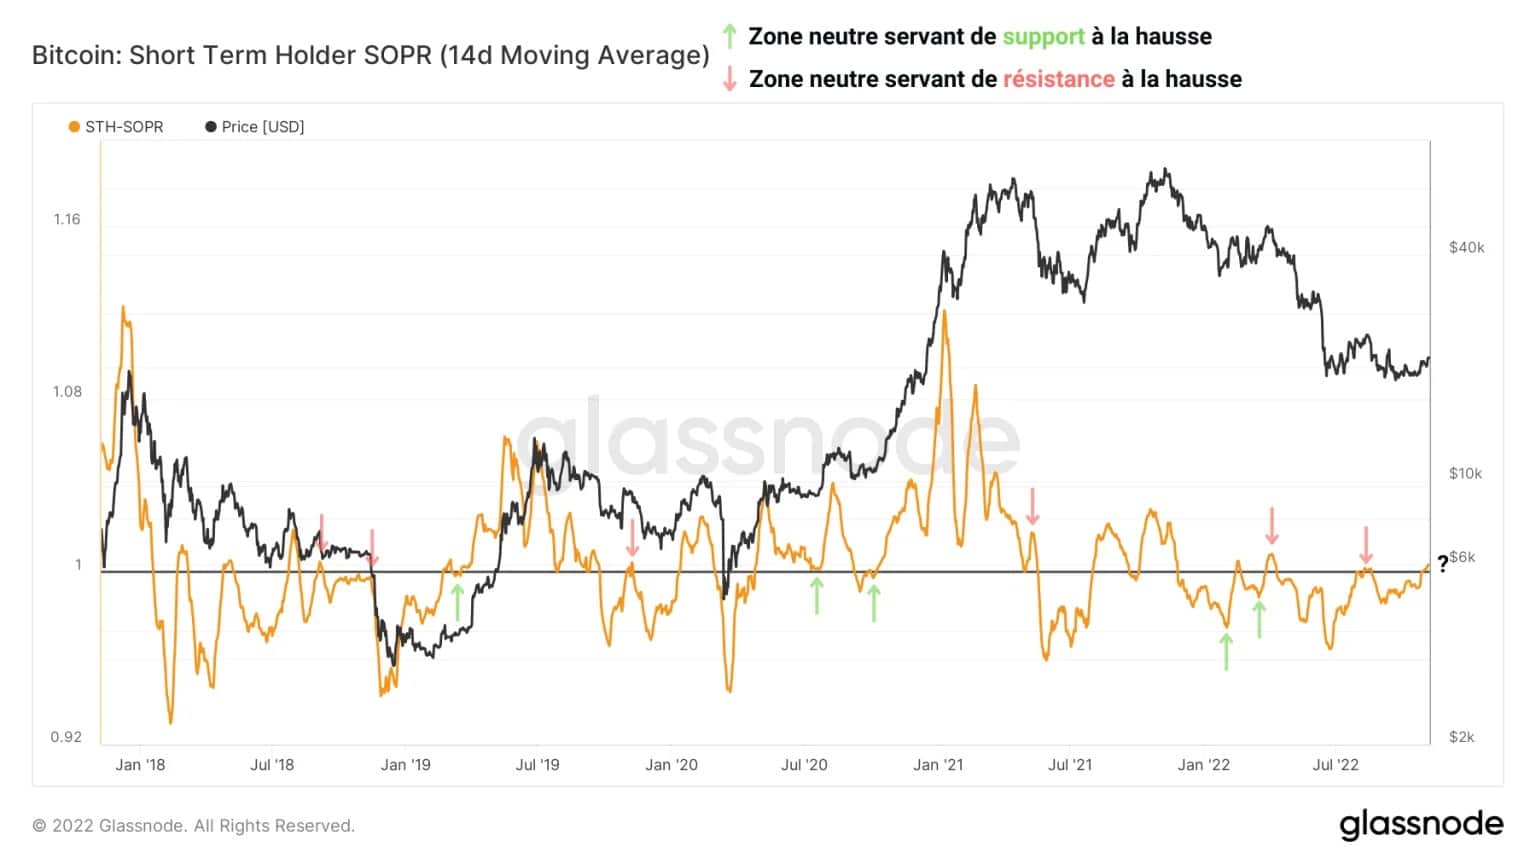
Figure 8: Profitability ratio of short-term expenses (STH)
With the short-term profitability of spending having started to build momentum for an upward turnaround, it will now be important to see whether this ratio can be maintained in positive waters, above 1, to confirm that short-term spending remains profitable.
If not, we could see another failed test of this pivot point, causing profitability to fall further and plunging STH into a state of latent loss that would put significant selling pressure on its shoulders.
The outcome of this test will therefore be determined by participants’ reaction to BTC price movements over the next few days.
Summary of this on-chain analysis
Overall, this week’s data indicates that a surge in on-chain activity has accompanied the recent rise in the price of BTC. Entities active on the network are making more transactions and increasing the volume of transfers settled daily on the chain.
This constructive observation is confirmed by the mempool study, which indicates that a new influx of demand is underway, albeit still limited in scope. It seems that some participants are coming out of their slumber and starting to anticipate a potential move in the coming weeks.
Finally, the test of the breakeven point for profitability of spending indicates that a decisive dynamic is taking place. The decline in loss taking is beginning to be felt and could give way to a profit taking phase conducive to the onset of a new bullish cycle.