: How likely is a bull trap?")
The crypto market is behaving surprisingly well this October, particularly the price of Bitcoin (BTC), which has now appreciated by over 100% since the start of the year. This upward trend raises questions, as it’s based more on prospects than hard facts. What are the risks of a bull trap?
Bitcoin, the risk of a relapse is high
Let’s start with the facts, the performance of cryptos and Bitcoin (BTC) over different periods. Bitcoin’s price is going to make some people jealous, as it occupies first place in several categories. First and foremost, it is the leader in terms of annual performance when compared with the major financial assets of all asset classes (see the first chart below). Surprisingly, BTC clearly outperforms equities, the riskiest asset class par excellence.
Bitcoin has also been the leader since the outbreak of hostilities in the Middle East at the beginning of October, with BTC outperforming gold and silver, the historic safe-haven assets.
Finally, bitcoin is the leader in its own camp, with a new annual high in BTC dominance, a fact that recalls the structure of the crypto market in autumn 2020.
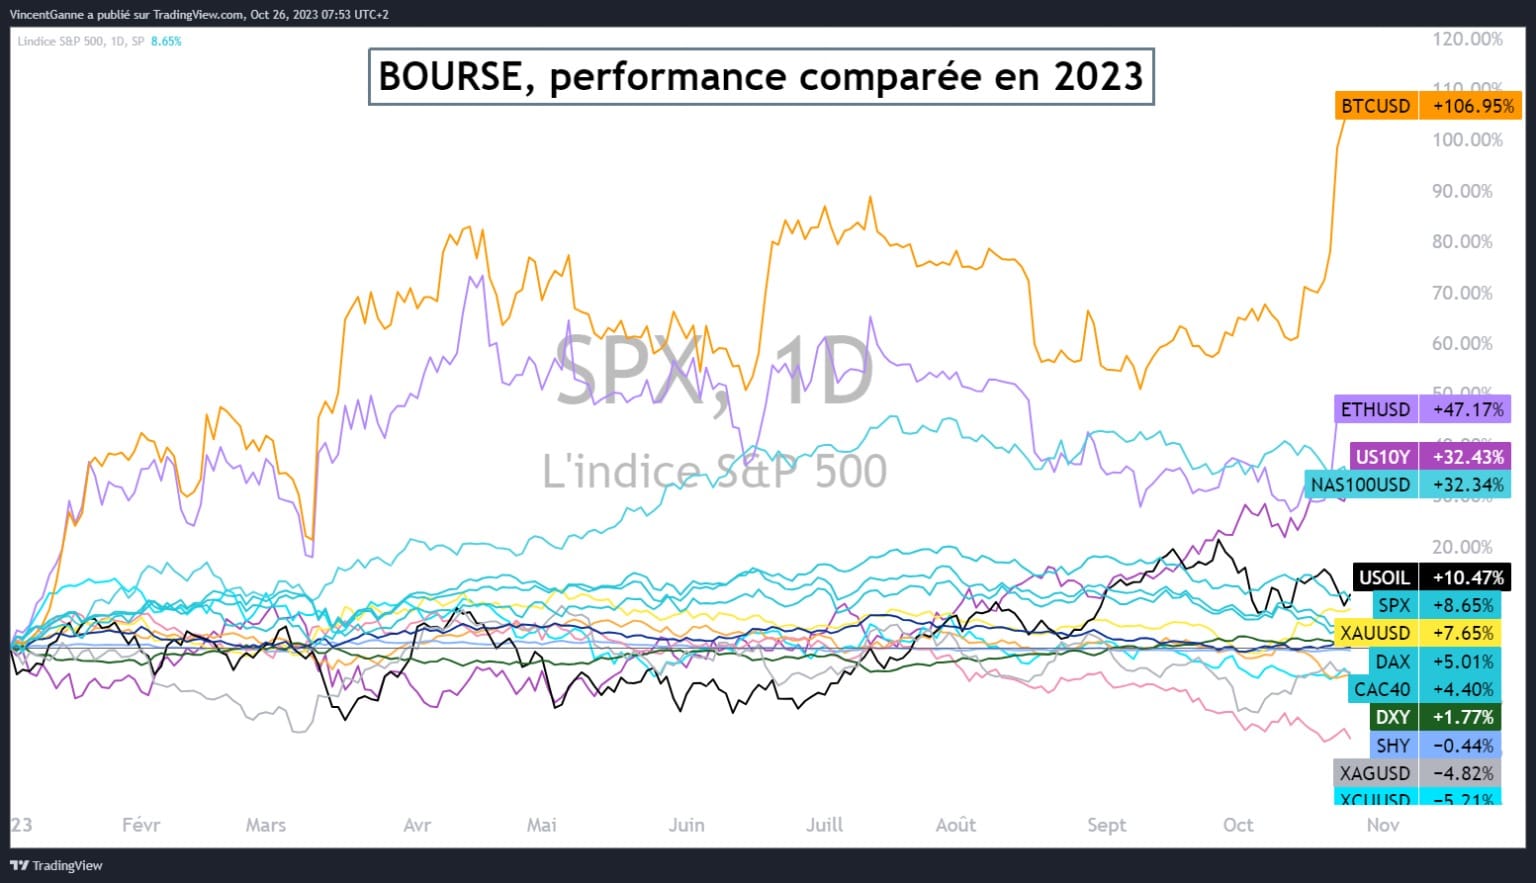
Chart that offers a comparison of the performance of major asset classes in the stock market since the beginning of the year
This bullish performance for BTC has many doubters, as there is no shortage of bearish pressure factors. Most of the recent rise is based on the market’s near-certainty that the SEC will approve the applications for bitcoin spot ETFs, in particular BlackRock’s. But what happens if the SEC approves the application? But what happens if the SEC postpones its decision for the umpteenth time, or worse, says no?
Added to this are global-macro fundamentals, which have always been a source of downward pressure on the price of BTC, except over the last few weeks :
- The bearish equity market trend;
- The upward trend in bond interest rates;
- The upward trend of the US dollar on the foreign exchange market;
- A pre-recession macroeconomic framework in the West.
Bref, there’s only one way to avoid a bull trap: a frank and massive yes from the SEC to BlackRock’s ETF at a time that’s not too far off. Otherwise, the bearish comeback would be violent
Support at $32,000 must be held
The fundamental debate is therefore open as to the sustainability of the recent rise in the price of BTC, and so is the technical debate. Below, I present the very last bearish chart scenario that is still possible, that of a vast ascending bevel that could still bring the market back to $15,000.
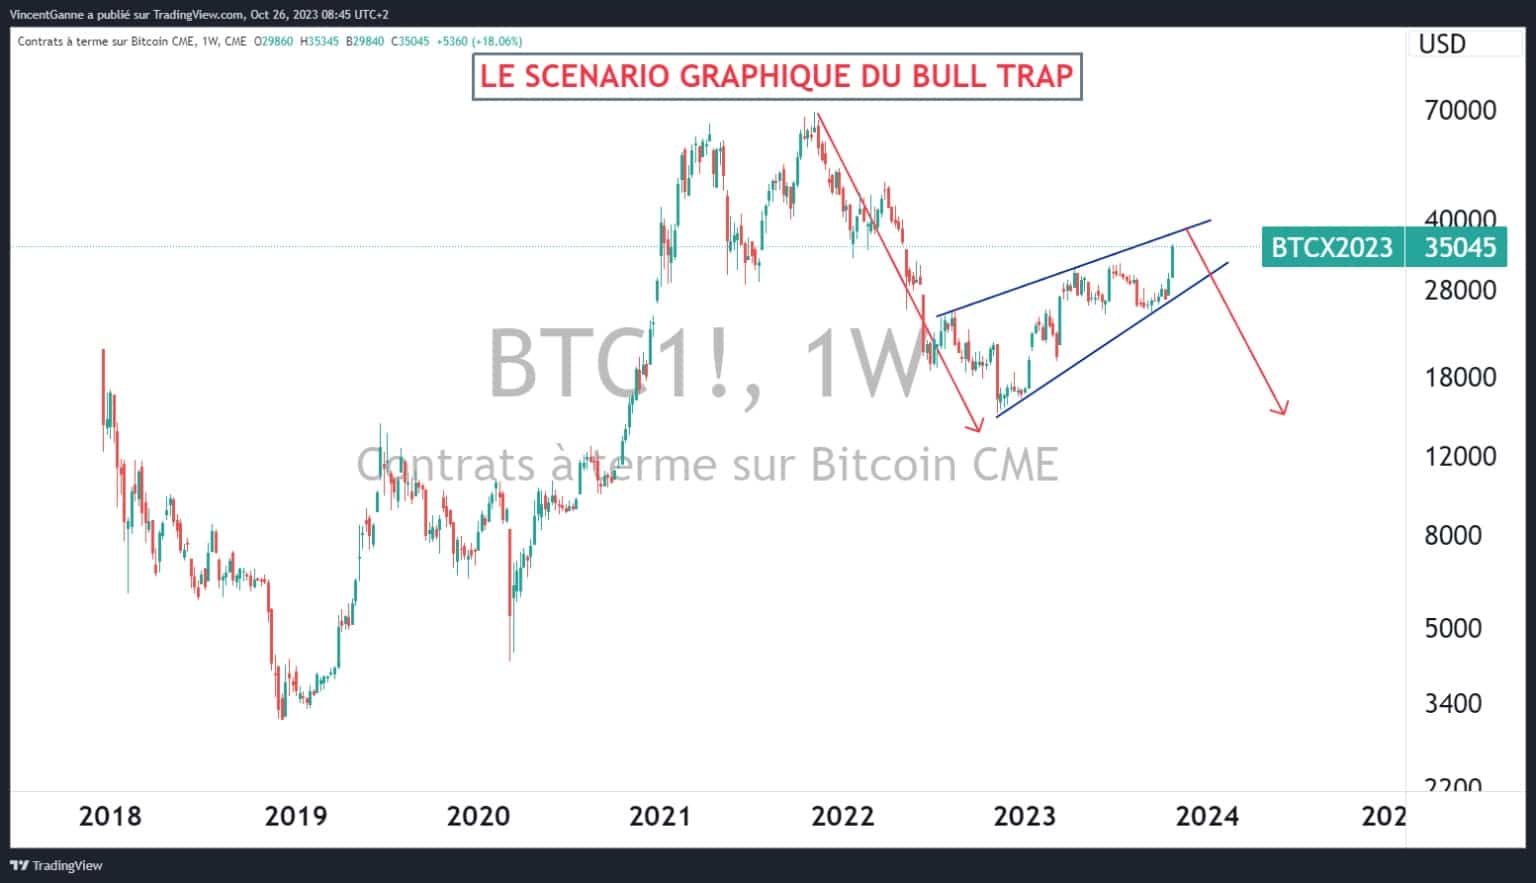
Chart showing Japanese candlesticks in weekly data for the CME bitcoin future contract