
Bitcoin (BTC) price forms a new jump ? Despite a timid distribution of holders over the long term, realised losses are falling as the market will soon decide its direction. On-chain analysis of the situation
Bitcoin rebounds from support for sixth time
Forming a slight bounce off the bottom of the range between $52,000 and $46,500, the price of bitcoin (BTC) reenters the 200 sMA daily and approaches the 21 eMA daily.
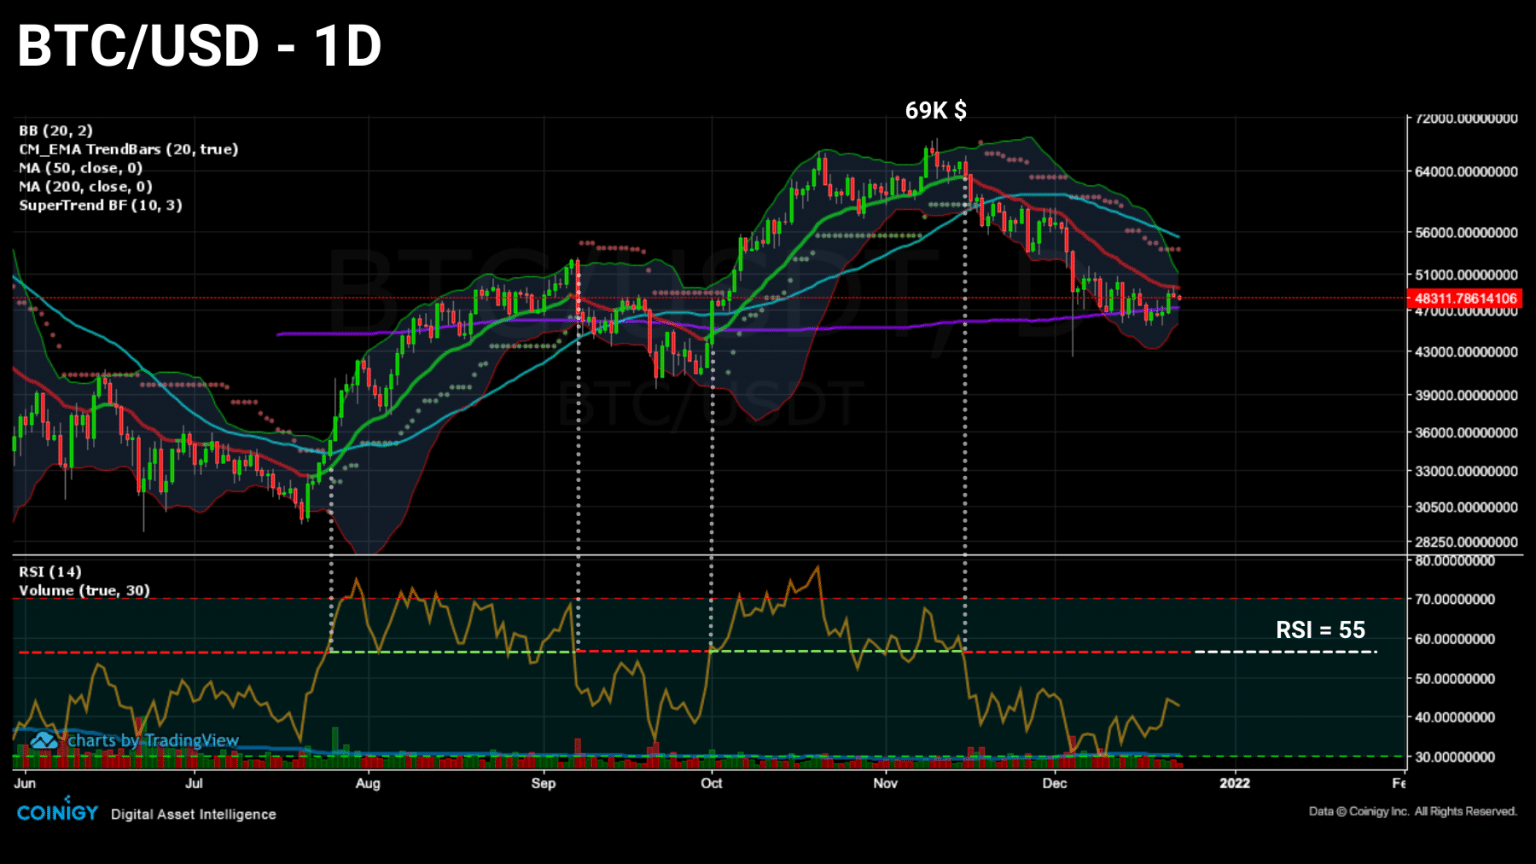
Daily chart of Bitcoin (BTC) price (Source: Coinigy)
Bitcoin (BTC) is progressing within a moderately dense volume cluster where the $50,000 area serves as a threshold to be breached in the short term.
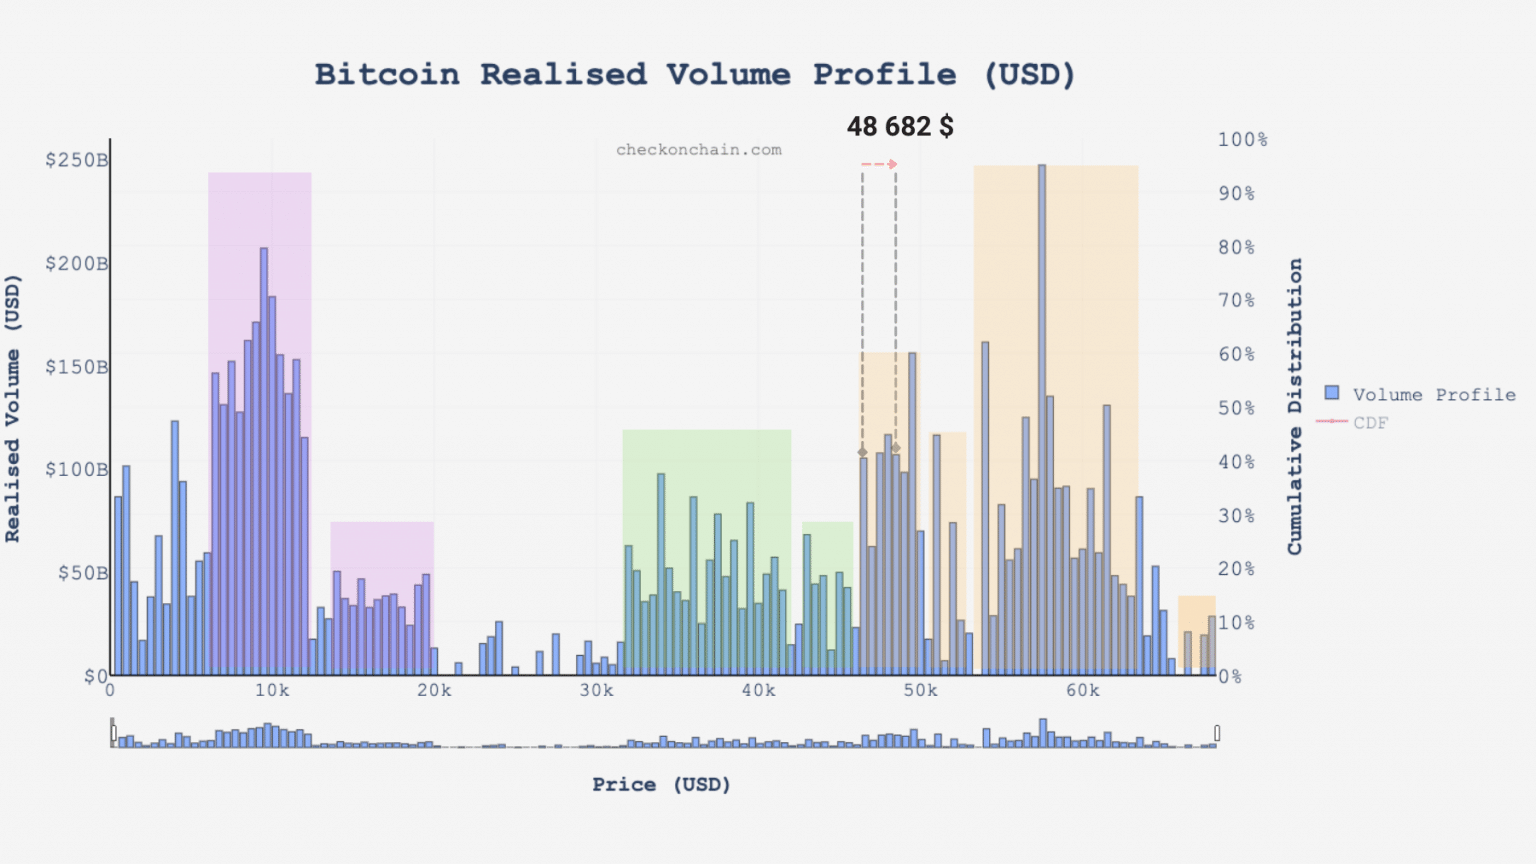
Realized Volume Chart of Bitcoin (BTC) (Source: checkonchain.com)
Let’s continue tracking spending dynamics to get a glimpse of participant behaviour at this stage of the correction. Profitability and age of BTC tokens will indicate the relative involvement of the cohorts and momentum will tell us about the inertia of the ongoing movement.
Decrease and convergence of spending
To begin with, let’s note that for almost 2 weeks now, losses and profits on the chain have been decreasing in concert.
This common decline indicates that profit investors are not willing to realize their gains at such price levels and that loss investors are slowing down their spending
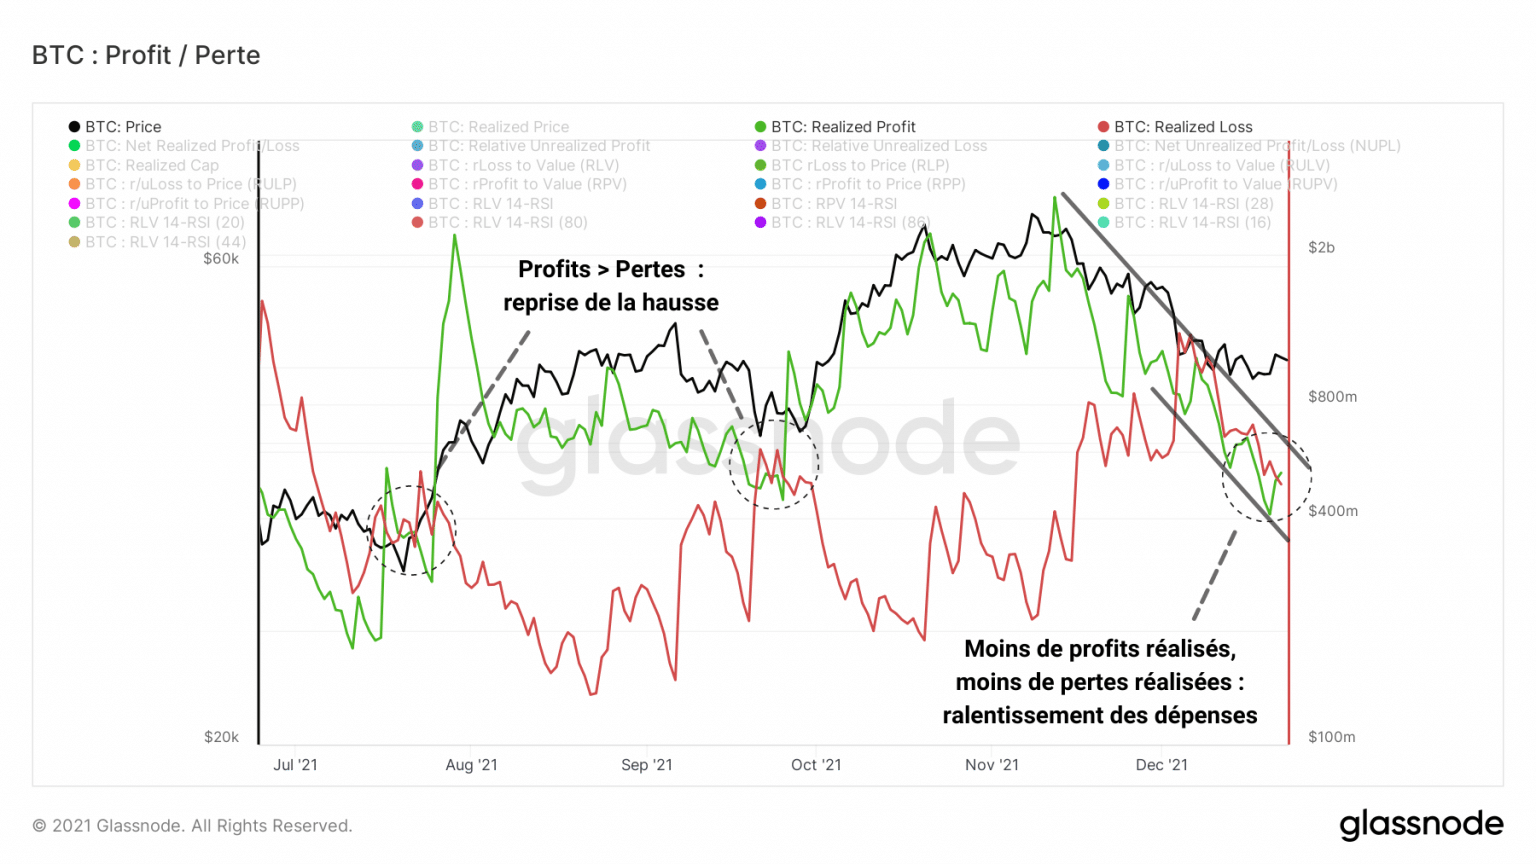
Chart of realized bitcoin (BTC) profits and losses (Source: Glassnode)
We are approaching the point where the market, if spot demand exceeds selling pressure, could see realized profits outweigh losses and begin a new bull run.
Indeed, after a period of severe pain induced in part by the liquidation cascades identified several weeks ago, the net total realised profit/loss (NRPL) looks set to return to positive values. This indicator, adding up the two data points mentioned above, establishes a daily profitability balance sheet.
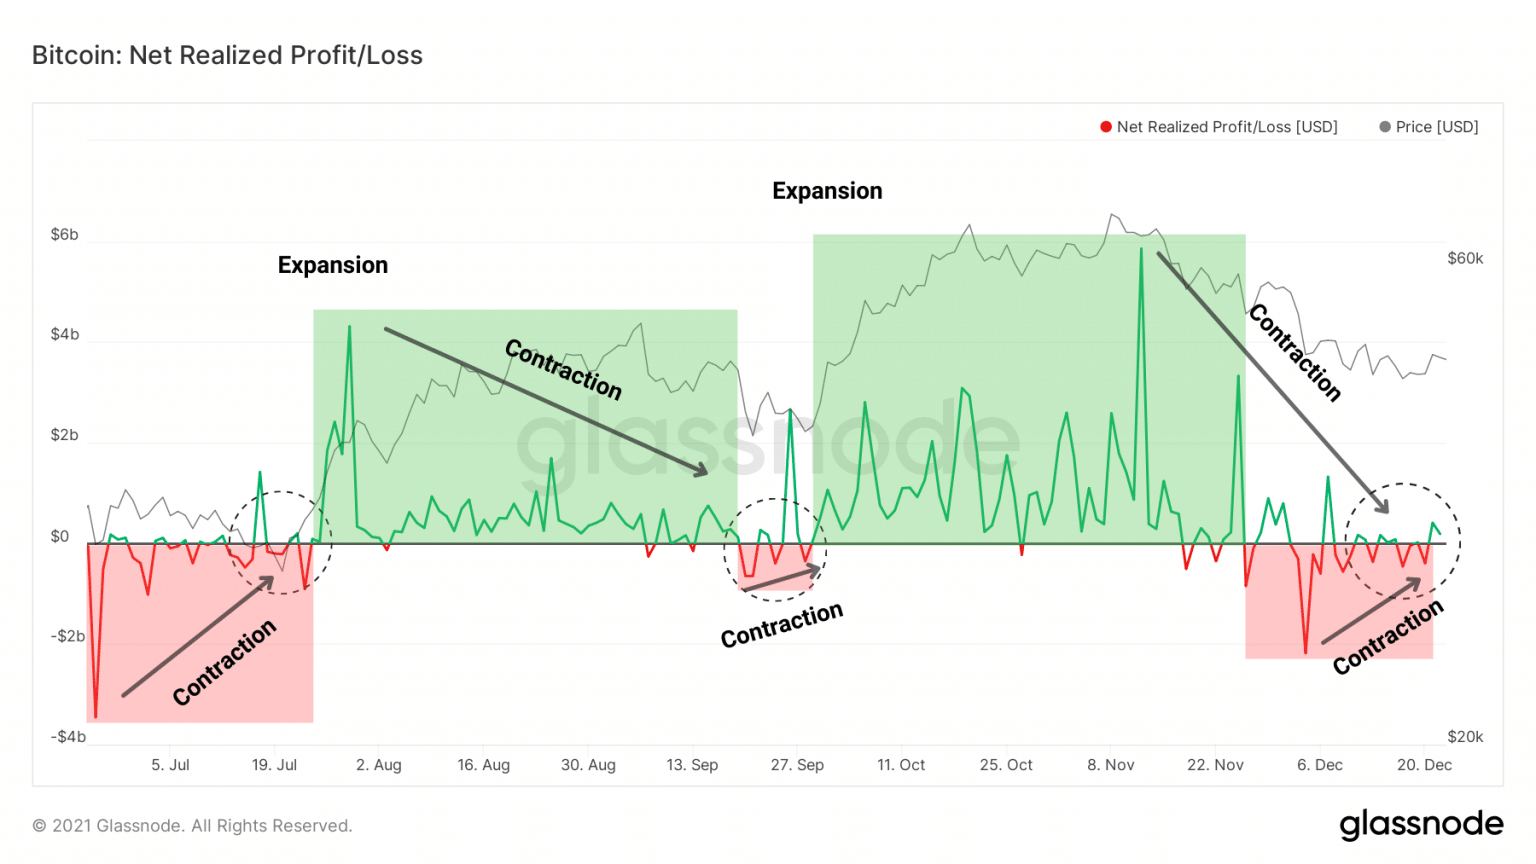
Bitcoin (BTC) NRPL Chart (Source: Glassnode)
A closer look at the indicator shows that there are both expansion and contraction movements that can be identified in the medium-term trend of this indicator.
In concrete terms, the decline in losses and profits is reflected here by a contraction of the indicator around 0, which will give the direction of the market’s profitability status in the next few days.
At this point, the market can :
- regain a rising profitability state (NRPL ☻ 0 and test 0 as support) and resume a gradual rise;
- make more losses than gains (NRPL ☺ 0 and tests 0 as resistance) and risk a panic of the most fragile entities which could lead to a capitulation.
Decline and convergence in spending
Moreover, it appears that recently spent tokens are getting younger. Clearly, the majority of bitcoins sold since last week were less than three months old.
This behaviour, illustrated via the age bands of UTXO releases, indicates that long term holders have participated little in the selling pressure highlighted since the $69,000 ATH.
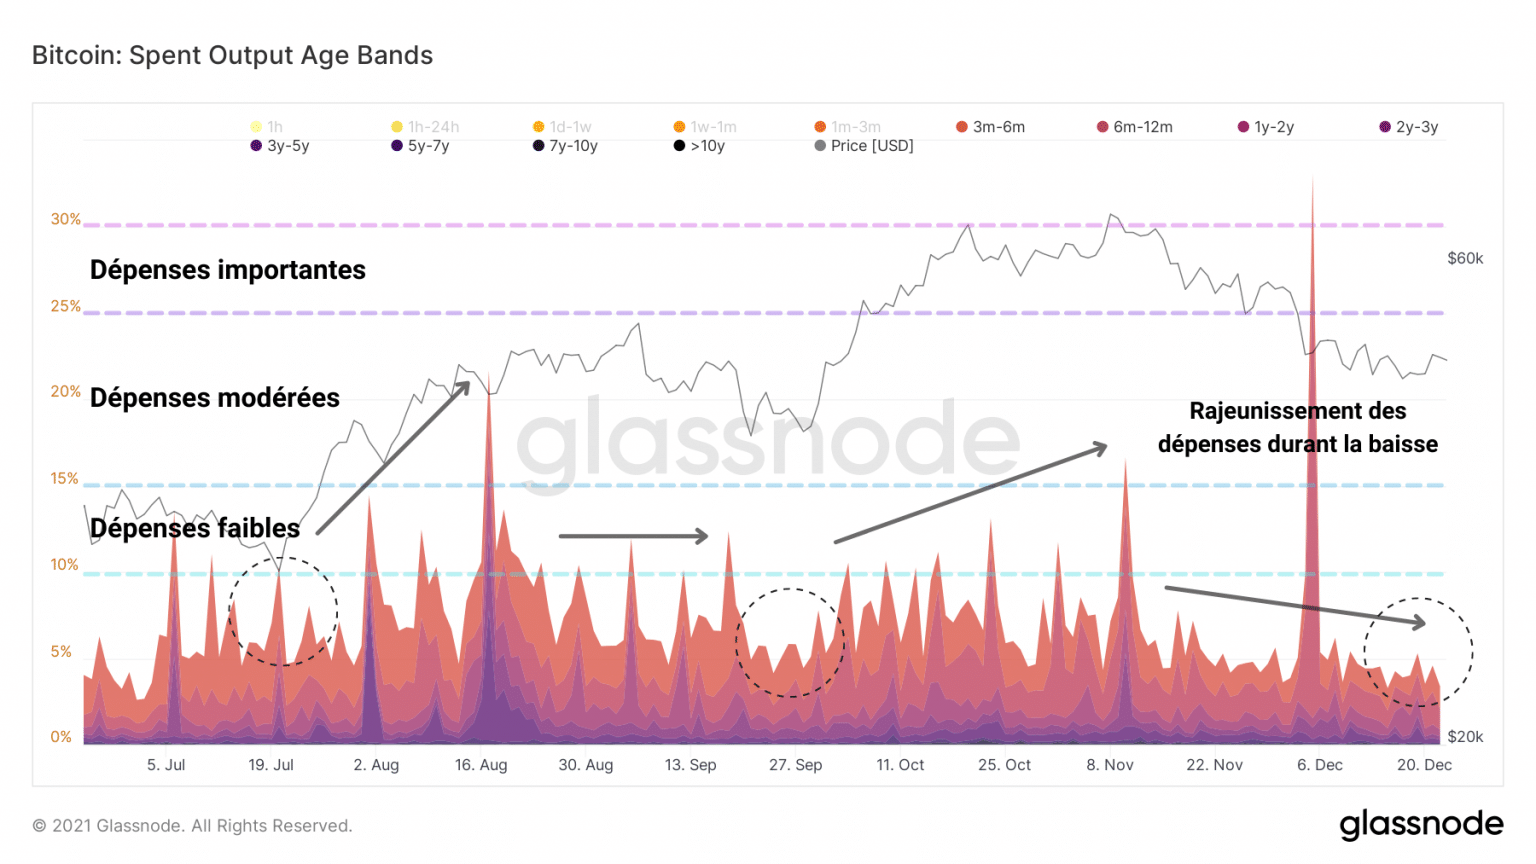
Bitcoin (BTC) SOAB Chart (Source: Glassnode)
So it was the short-term investors who influenced the short-term price action by selling tokens below their purchase price.
The days of destroyed tokens (DDT) count confirms this observation: fewer and fewer mature tokens have been liquidated.
This downward trend has been in place for several months and is evidence of the desire of long-term holders (LTHs) not to leave the market despite the correction.
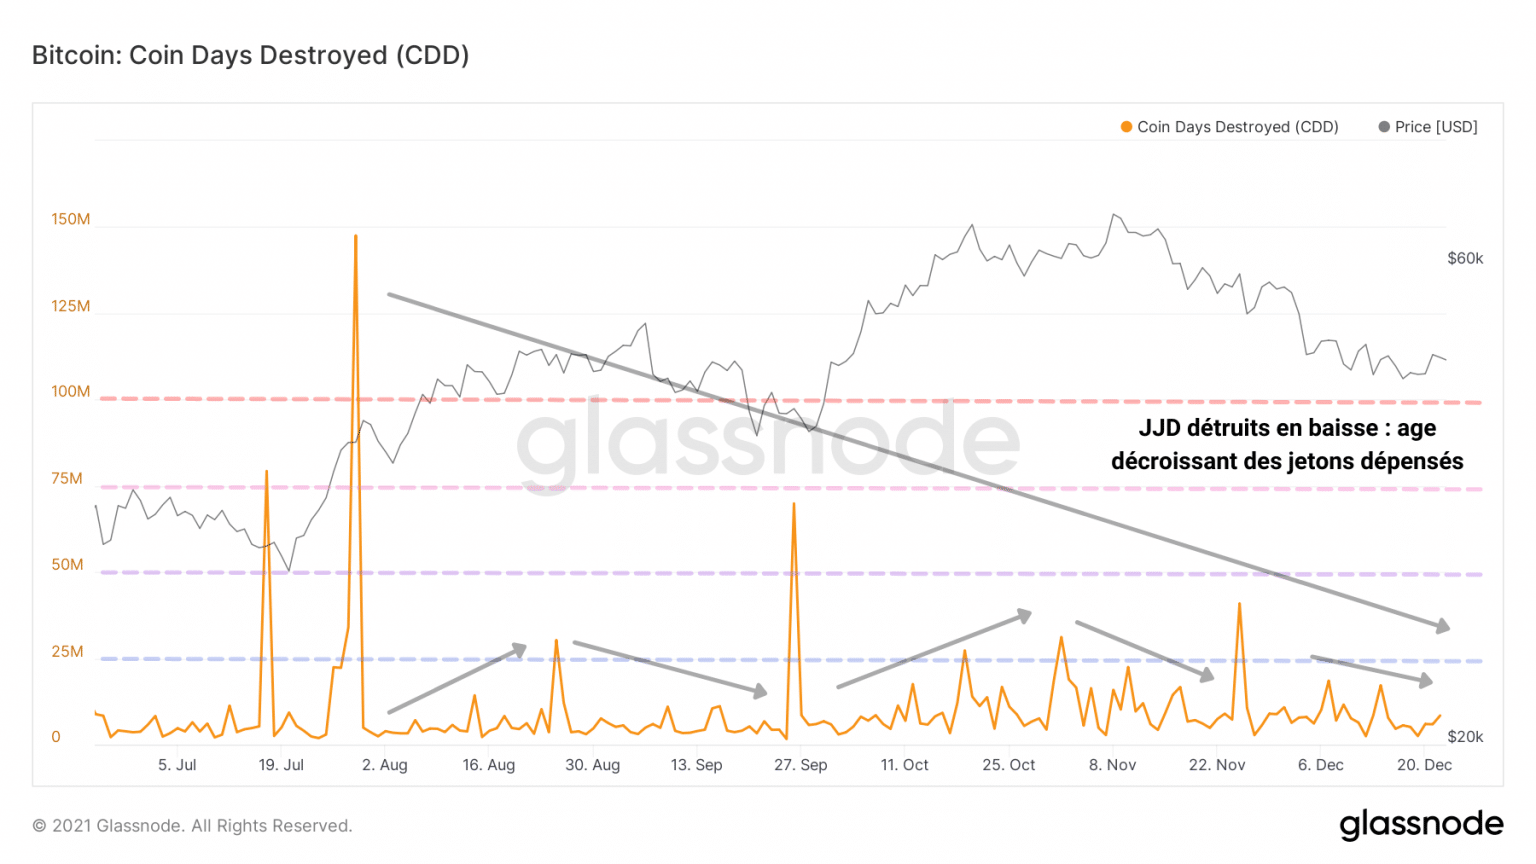
Bitcoin (BTC) JJD account chart (Source: Glassnode)
This is supported by a decreasing liveliness. Liveliness is defined as the ratio between the sum of destroyed JJs and the sum of all JJs ever created. This indicator increases as long-term holders liquidate their positions and decreases as they accumulate.
We can thus recognise that as a cohort, LTH as a whole favours saving over spending as destroyed JJs increase less than created JJs.
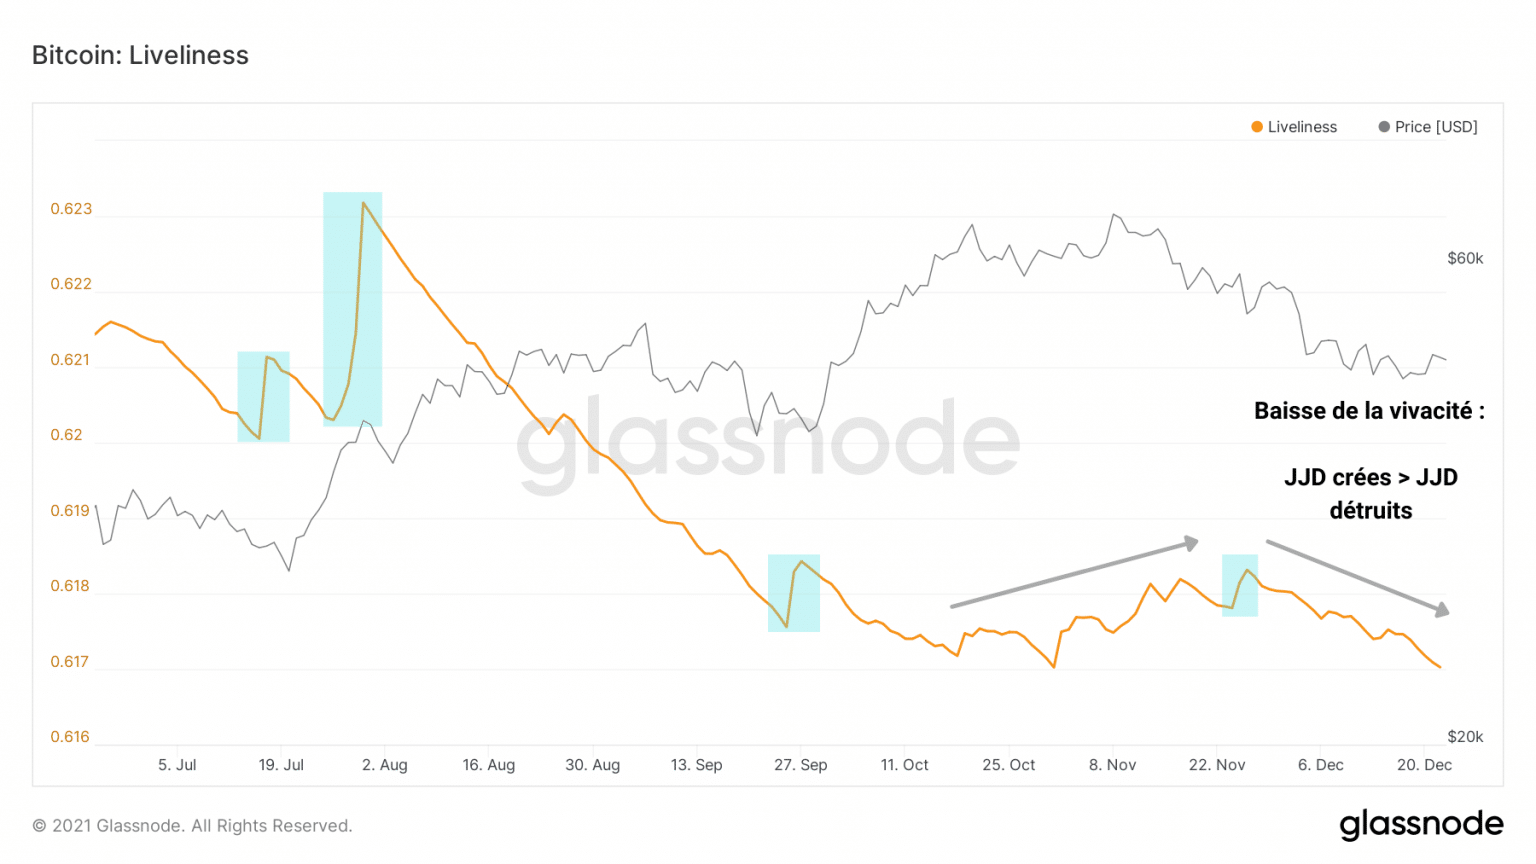
Bitcoin (BTC) liveliness chart (Source: Glassnode)
In sum, the LTH spending behavior described last week could fade by the next few releases if long term investors decide to scour the exchanges’ reserves again.
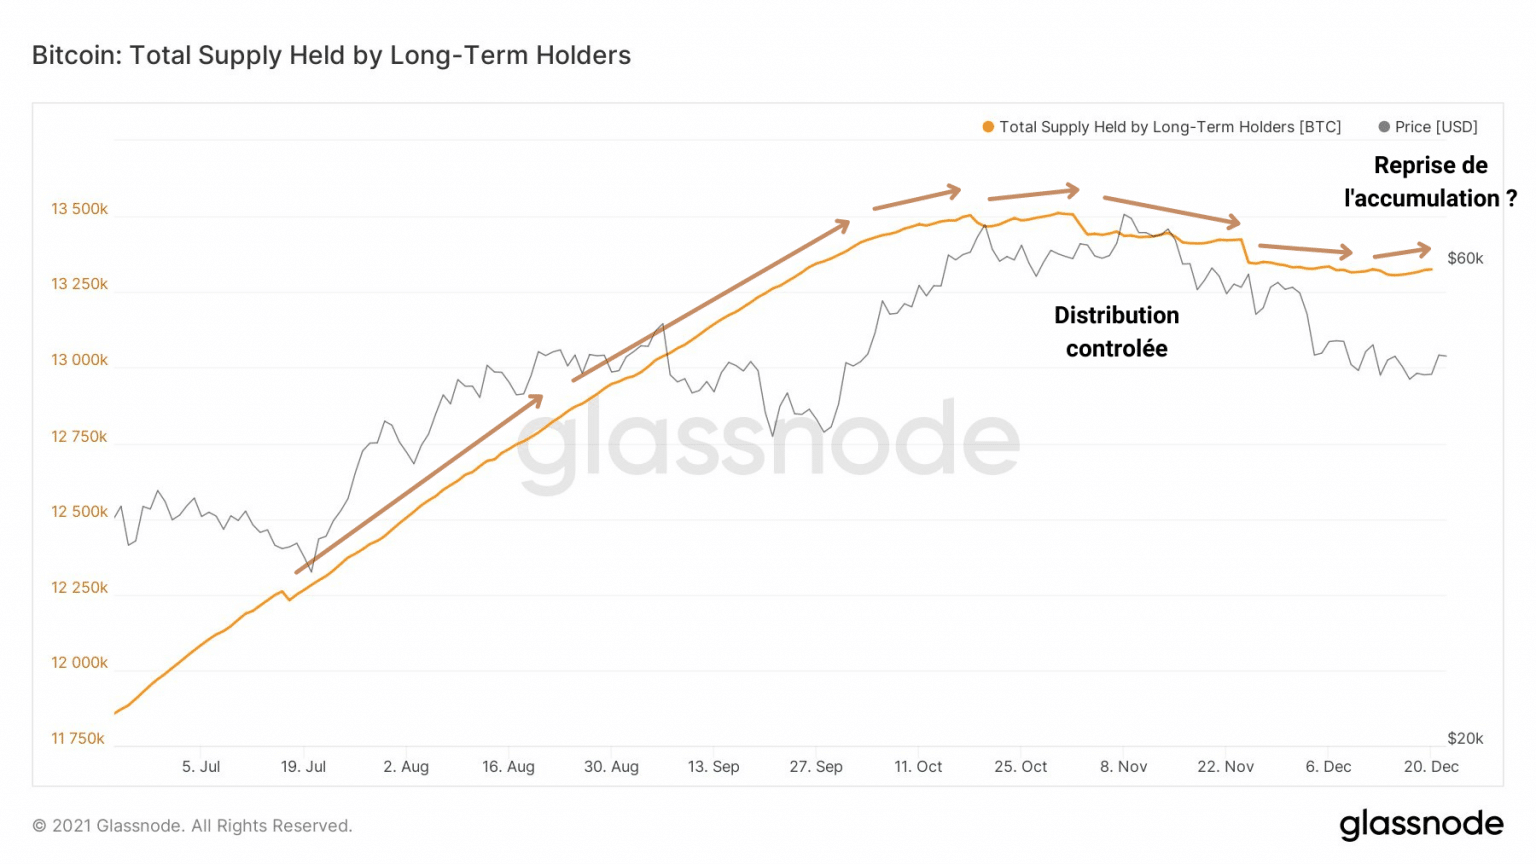
Graph of supply held by LTH (Source: Glassnode)
It is likely that some of them have taken advantage of recent sales to accumulate more BTC. Thus, the process of distribution from LTH to STH, a typical transfer dynamic in bull markets, could be postponed for several weeks or even months.
However, it should be noted that the current market dynamics have new aspects that only time and hindsight will allow us to understand.
Determining momentum
Let’s talk about market momentum. Momentum is the momentum, the fluctuating inertia of the market over time.
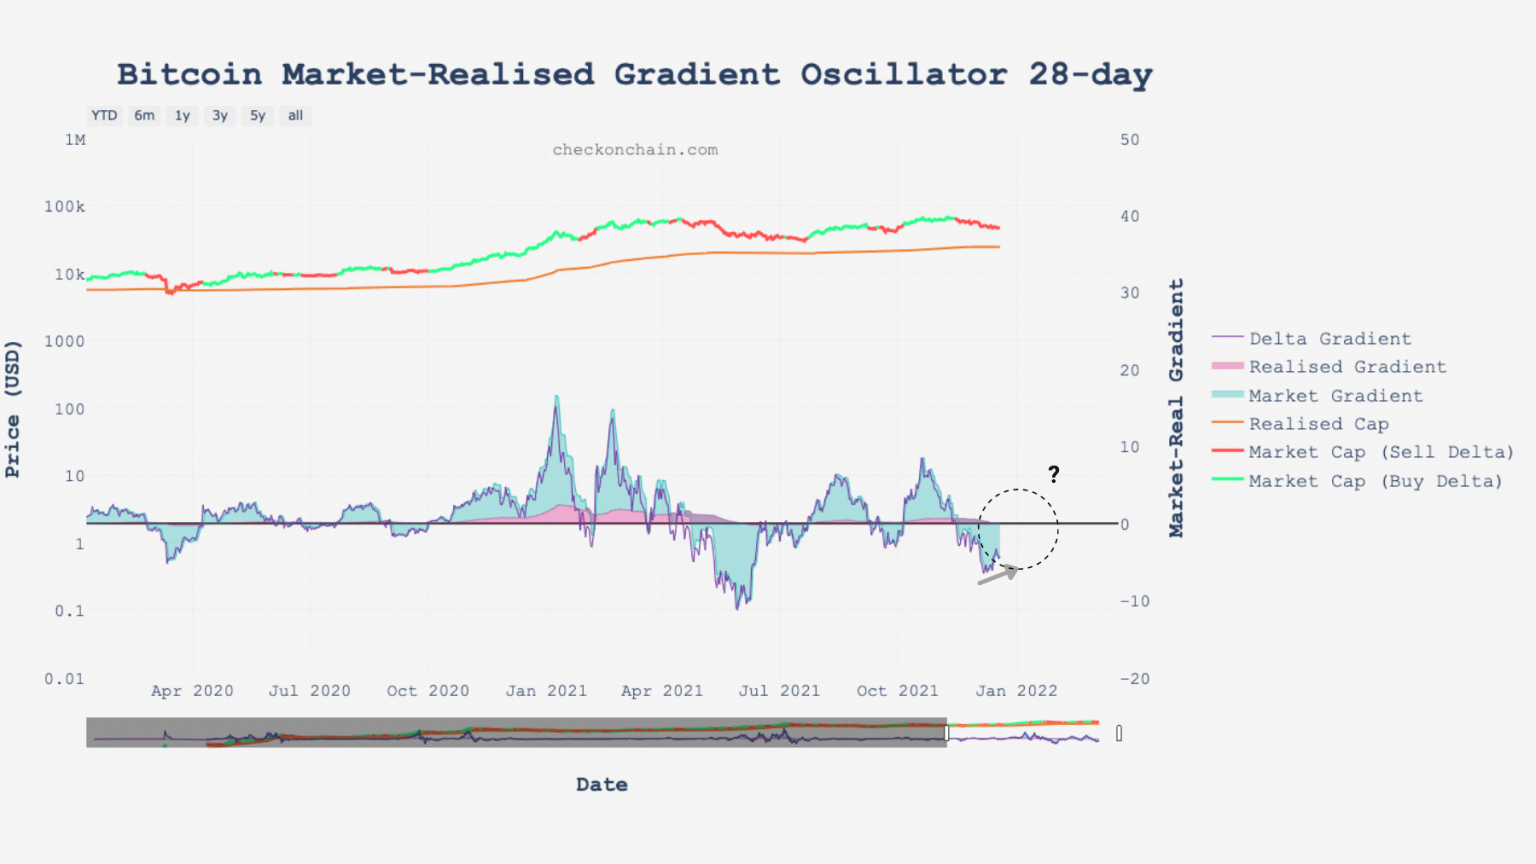
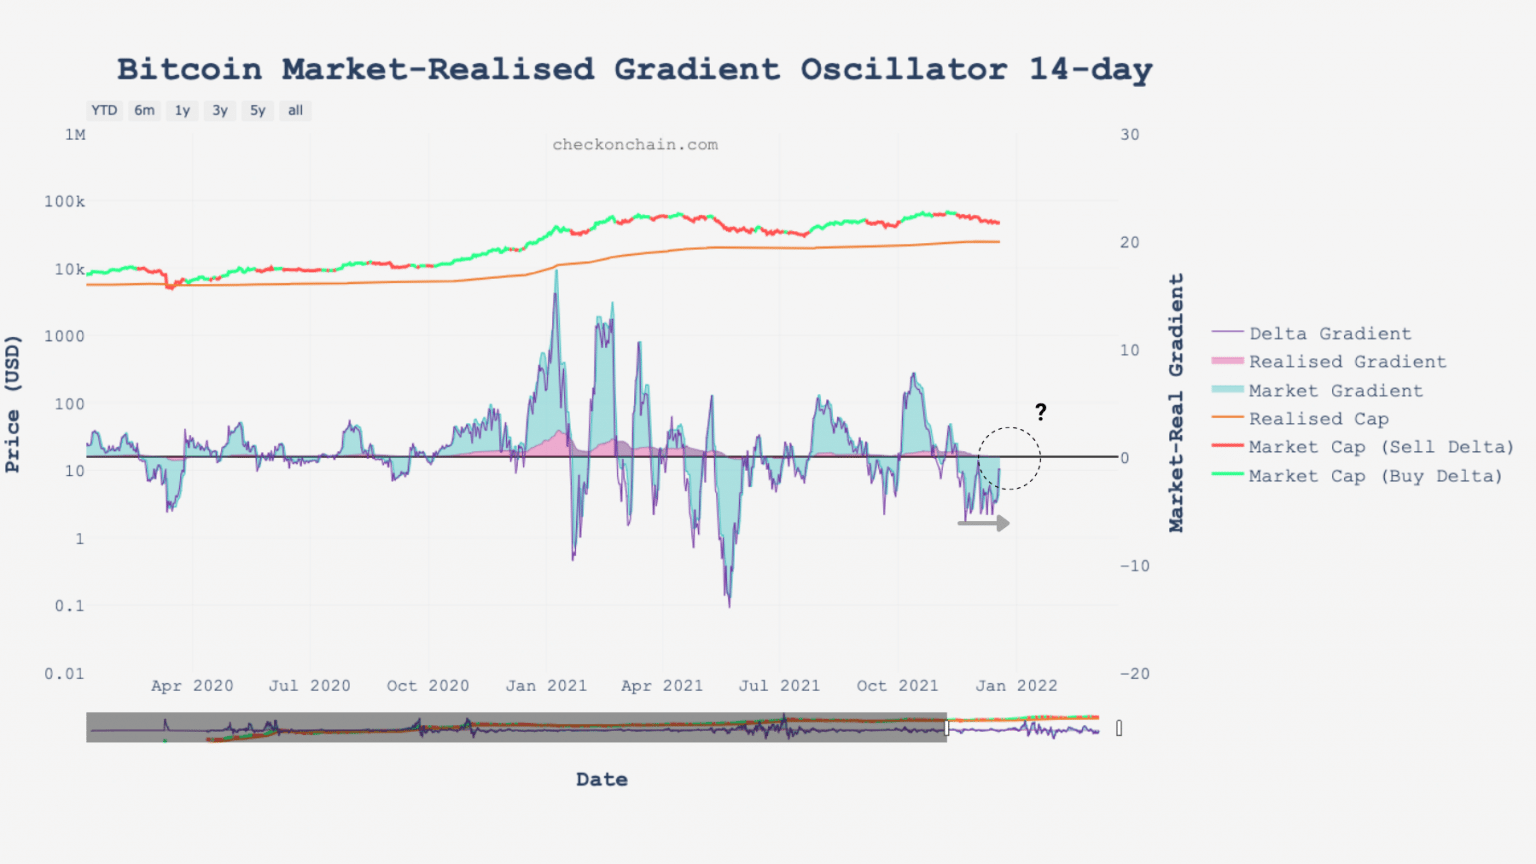
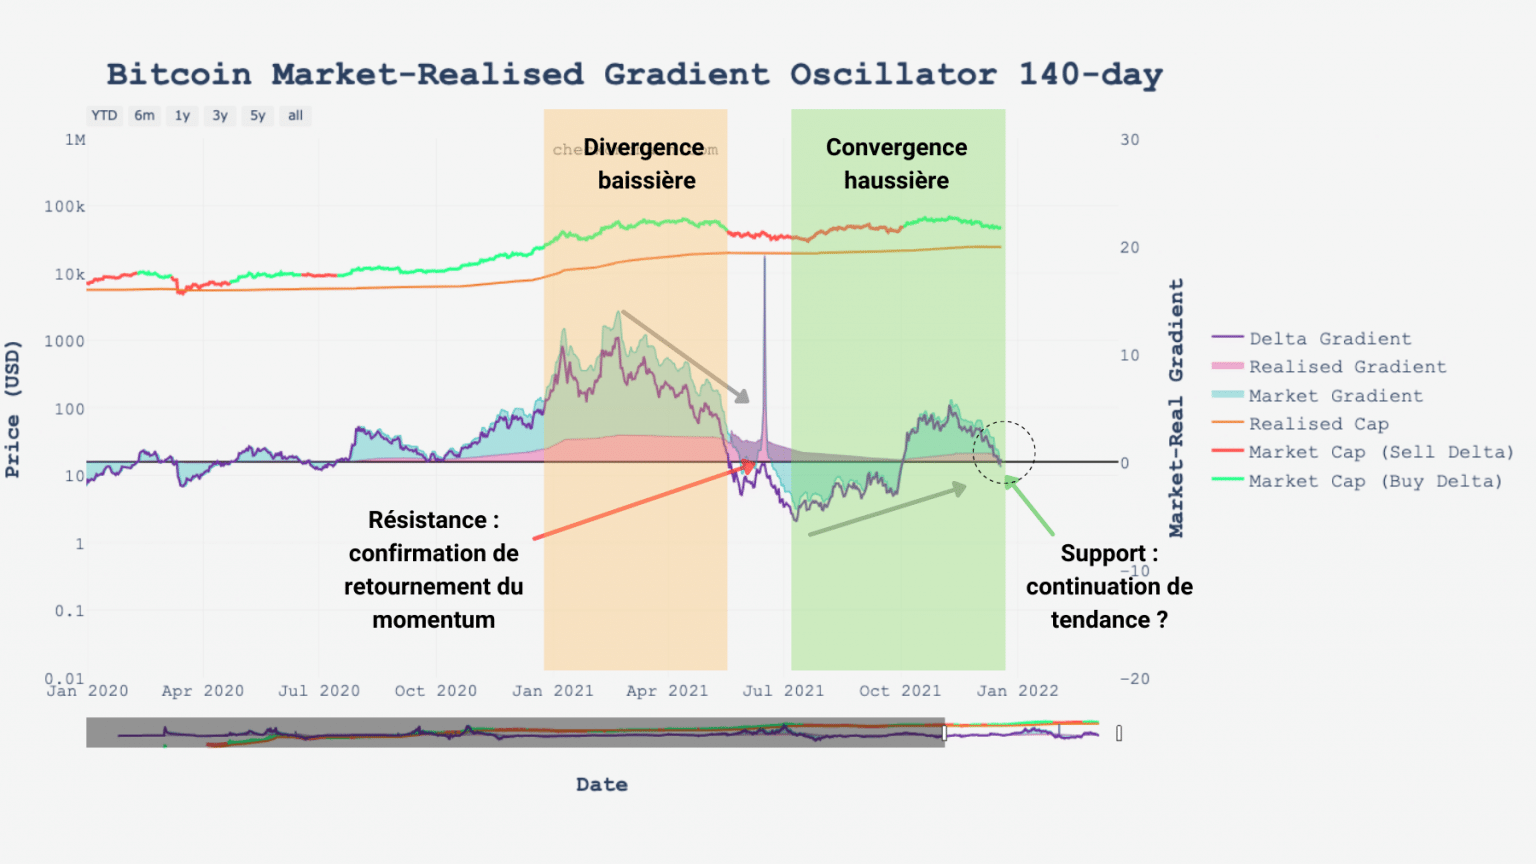
Shown here on three time scales (14 days, 28 days and 140 days), the MRG or realized market gradient (in purple) measures the tilt or verticality of the bitcoin (BTC) price.
- It can be roughly interpreted as follows:
- It measures market momentum to gauge the strength of a move.
- Higher or deeper peaks mean more vertical and wider movements.
- An increasing price, coupled with successive new highs, implies more power with each move.
- A declining price, accompanied by negative peaks, indicates a dissipation of momentum.
MRG-14, observing the short term, prints negative values but has just broken out of a lateralization.
Bitcoin (BTC) MRG-14 chart (Source: Glassnode)
Despite bearish price action, momentum is no longer weakening. Market inertia is stabilizing, which is constructive.
We need to see an upside break and then a full confirmation above 0 to expect a reversal.
On a monthly basis, the MRG-28 has barely bounced. It is marking a higher low than the previous one, which means a recovery that will also need to be confirmed in the coming weeks.
MRG-14 chart of bitcoin (BTC) (Source: Glassnode)
The 140-day gradient, capturing the market’s underlying momentum, is a useful trend signal oscillator for long-term investors.
It is currently approaching major support which also tends to be reached when market momentum is in one of two situations:
- About to rebound strongly from bull market support;
- About to enter a winter, bear market.
MRG-14 chart of bitcoin (BTC) (Source: Glassnode)
While these signals may seem contradictory, it would be appropriate to observe a confluence of the different gradients in order to get a likely glimpse of the next trend.
Synthesis
Finally, the expenditure study tells us that realised losses are slowing down as long term holders control their distribution, potentially initiating a range continuation in the short term.
With price momentum about to test important support, it would be opportune to see bitcoin (BTC) break out of the 21 eMA daily and hold above $52,000 within the next two weeks.