
Following a cleanup in the derivatives market, some short-term cryptocurrency holders are exiting their positions in response to the volatility in the Bitcoin (BTC) price. On-chain analysis of the situation.
Bitcoin (BTC) shakes up small holders
Trying to bounce back, the price of bitcoin (BTC) forms a floor of $55,573 after the loss of $60,000 support, now considered as a weekly ceiling.
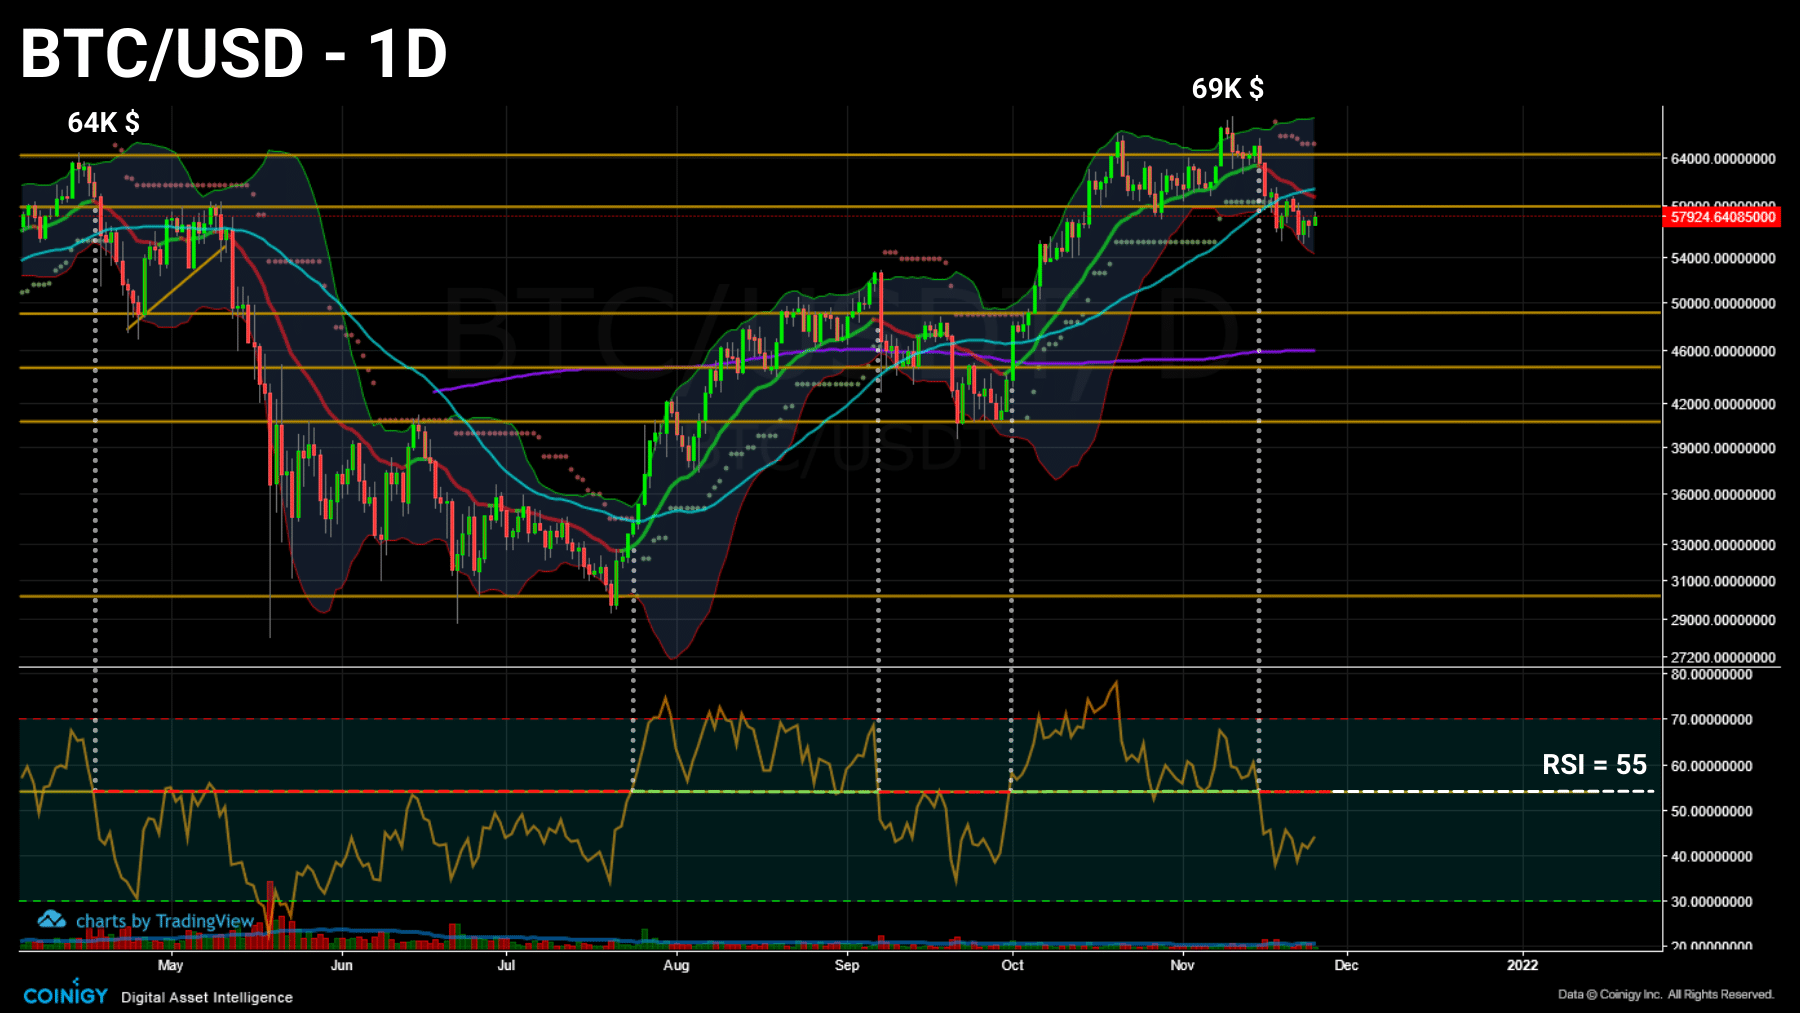
Daily chart of bitcoin (BTC) price (Source: Coinigy)
Swirling within a large volume cluster between $54,000 and $59,000, Bitcoin has recently tested the nerves of many participants by testing price zones that some short-term holders would be wary of revisiting.
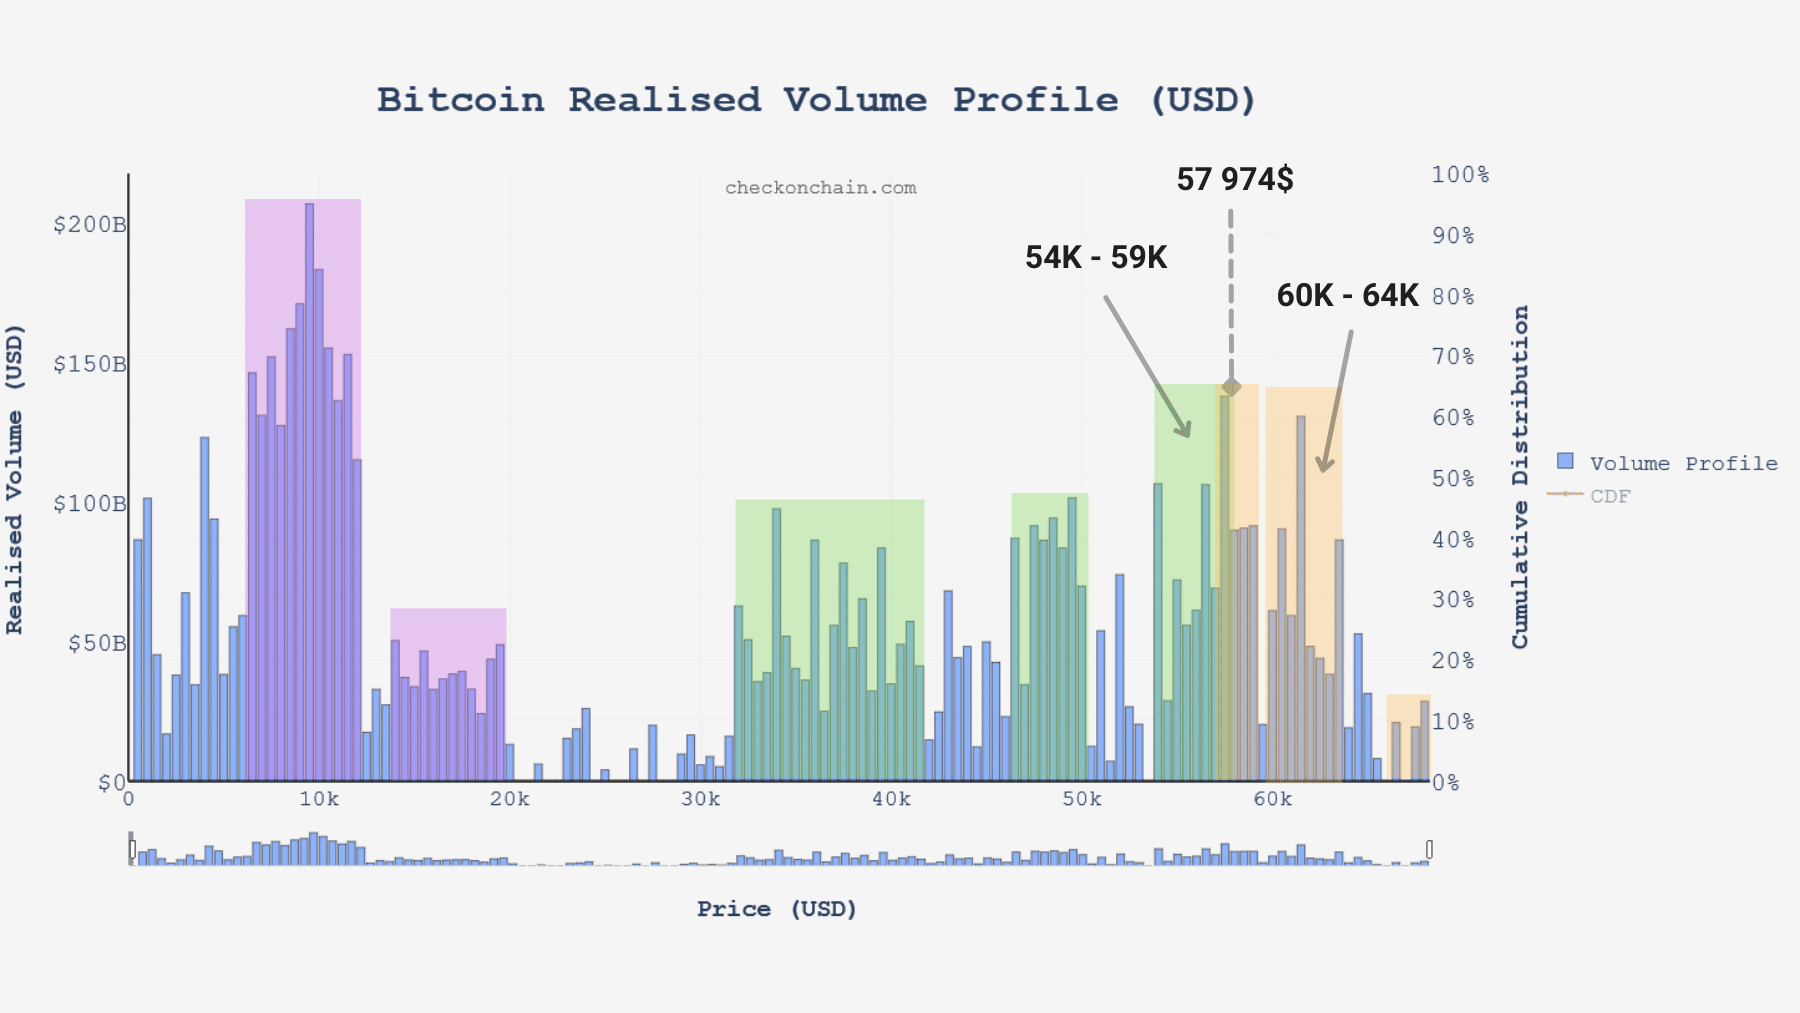
Graph of realized bitcoin (BTC) volume (Source: checkonchain.com)
Let’s take advantage of this consolidation to build on the metrics discussed in the last few analyses and study:
- the current position of the derivatives markets;
- the maximum pain point incurred by STH;
- the spending behaviour of LTH.
Tension in derivatives markets eases
Primo, the cleanup mentioned last week, continued as falling prices pushed speculators away from financial derivatives.
Falling 15%, open interest in BTC hit a monthly low of $22.3 million, relieving the market of excess risk.
With perpetual contracts trading at a slightly positive rate, optimism seems to have returned to a reasonable level despite the growing influence of derivatives markets since the beginning of 2021.
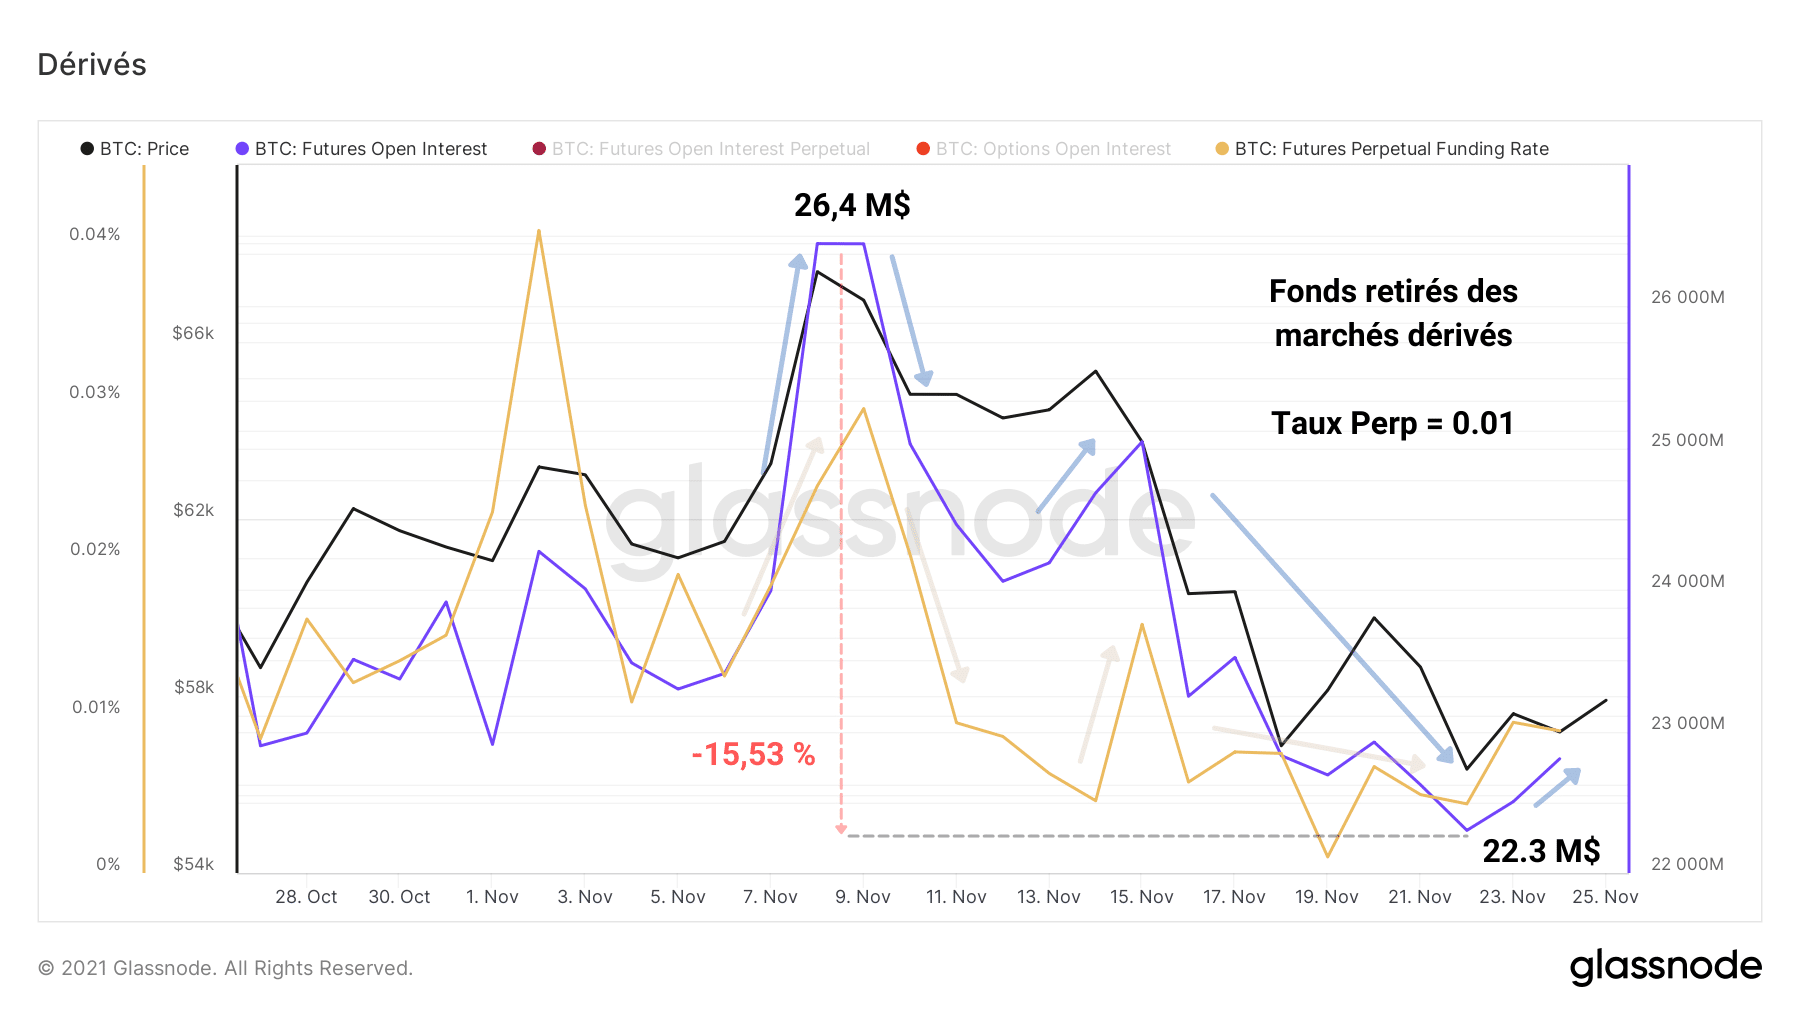
Bitcoin (BTC) open interest chart (Source: Glassnode)
As the liquidation count shows, a decreasing number of positions have been forced since last Friday, a sign that some of the speculators have learned their lesson… until the next time.
The turn would ideally have come for the spot markets to take over in order to restart a healthy rise, based on direct demand.
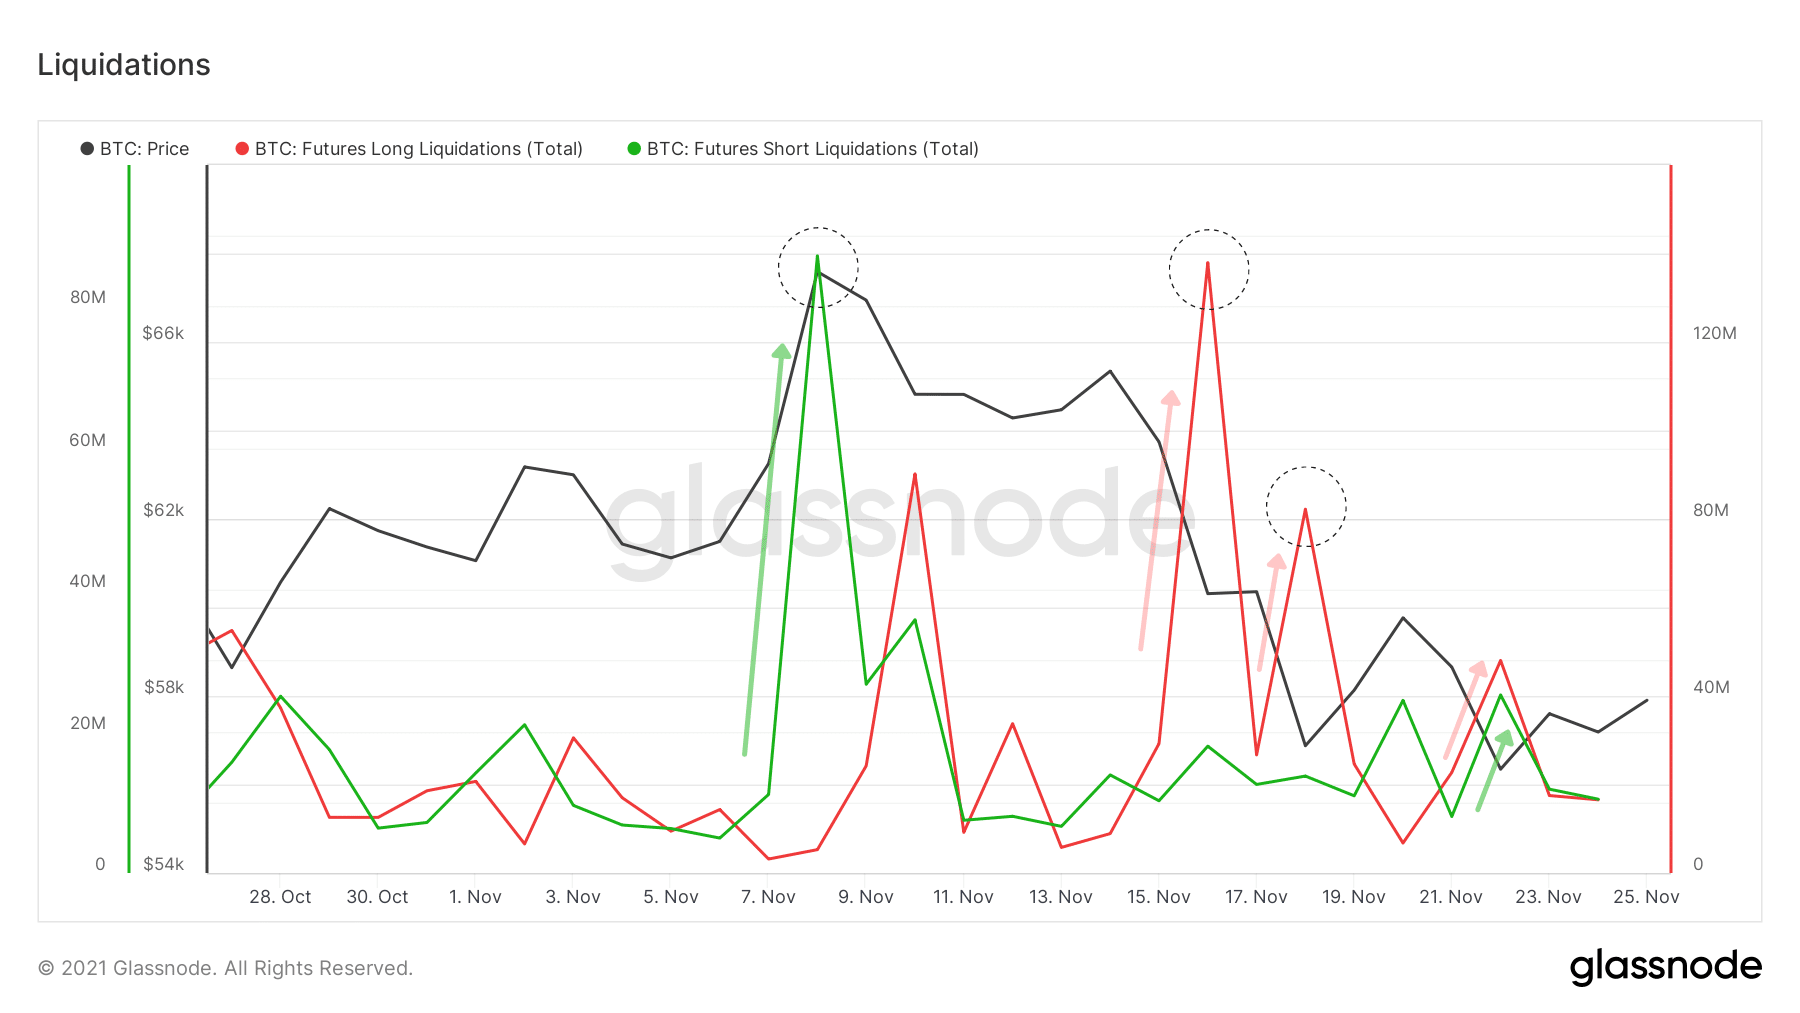
Chart of Bitcoin (BTC) future contract liquidations (Source: Glassnode)
A painful week for STH
Next, let’s turn our attention to another cohort whose impact on the recent correction is not to be overlooked: STHs.
This term stands for Short Term Holders and includes short term holders of various kinds (new entrants, active traders, small holders, etc.).
Despite their different levels of market understanding and invested capital, all these entities have a psychological trait that unites them.
Indeed, emotionality, the irrational reaction to volatility, is a behaviour that can be observed recurrently within this cohort.
Known for not holding BTC for more than 155 days, STHs have also participated in the fall of the bitcoin price by agreeing to sell tokens at an increasingly unattractive price.
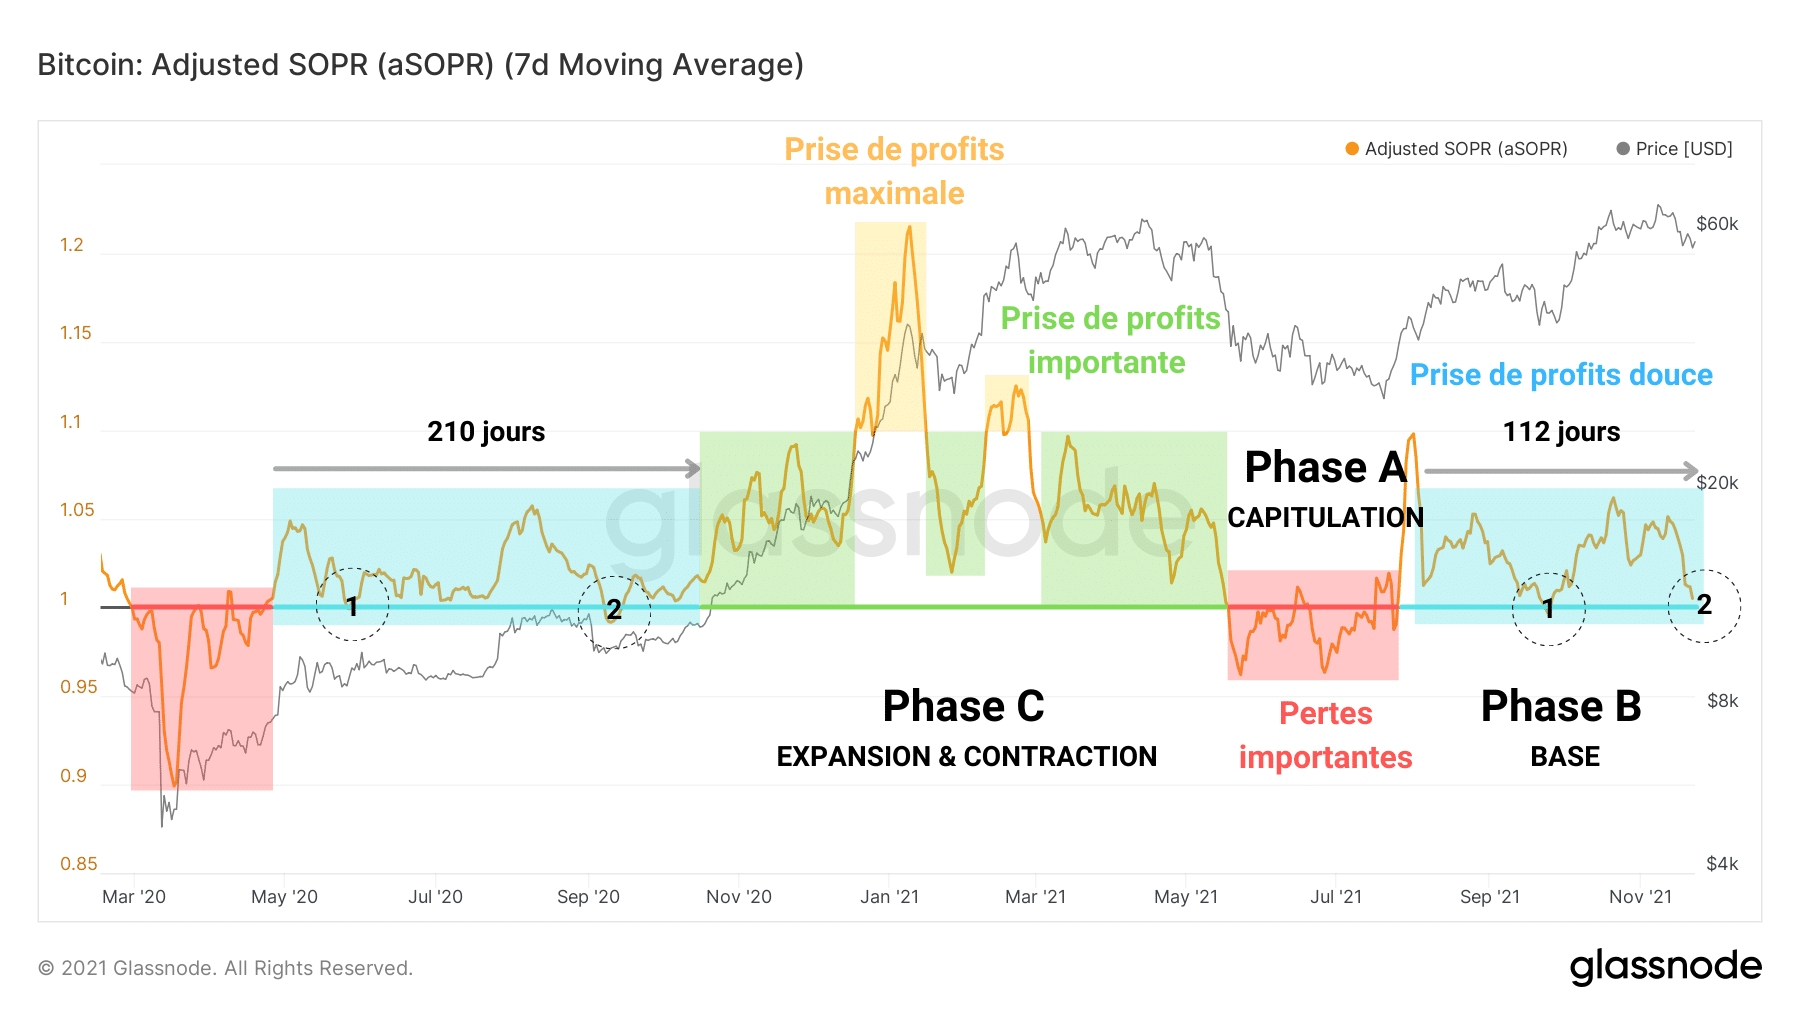
Chart of bitcoin (BTC) aSOPR (Source: Glassnode)
Highlighted by aSOPR, the dynamics of this week’s gains indicate a rapid decline in profitability during the correction.
Some STHs literally bought into the new ATH before reversing course as the price fell, inducing short-term selling pressure and sending the aSOPR back towards its neutral threshold.
To better illustrate this point, let’s borrow the Permabull Niño analysis tool. By targeting UTxOs with an age of less than 155 days, we can derive their valuation and realised price.
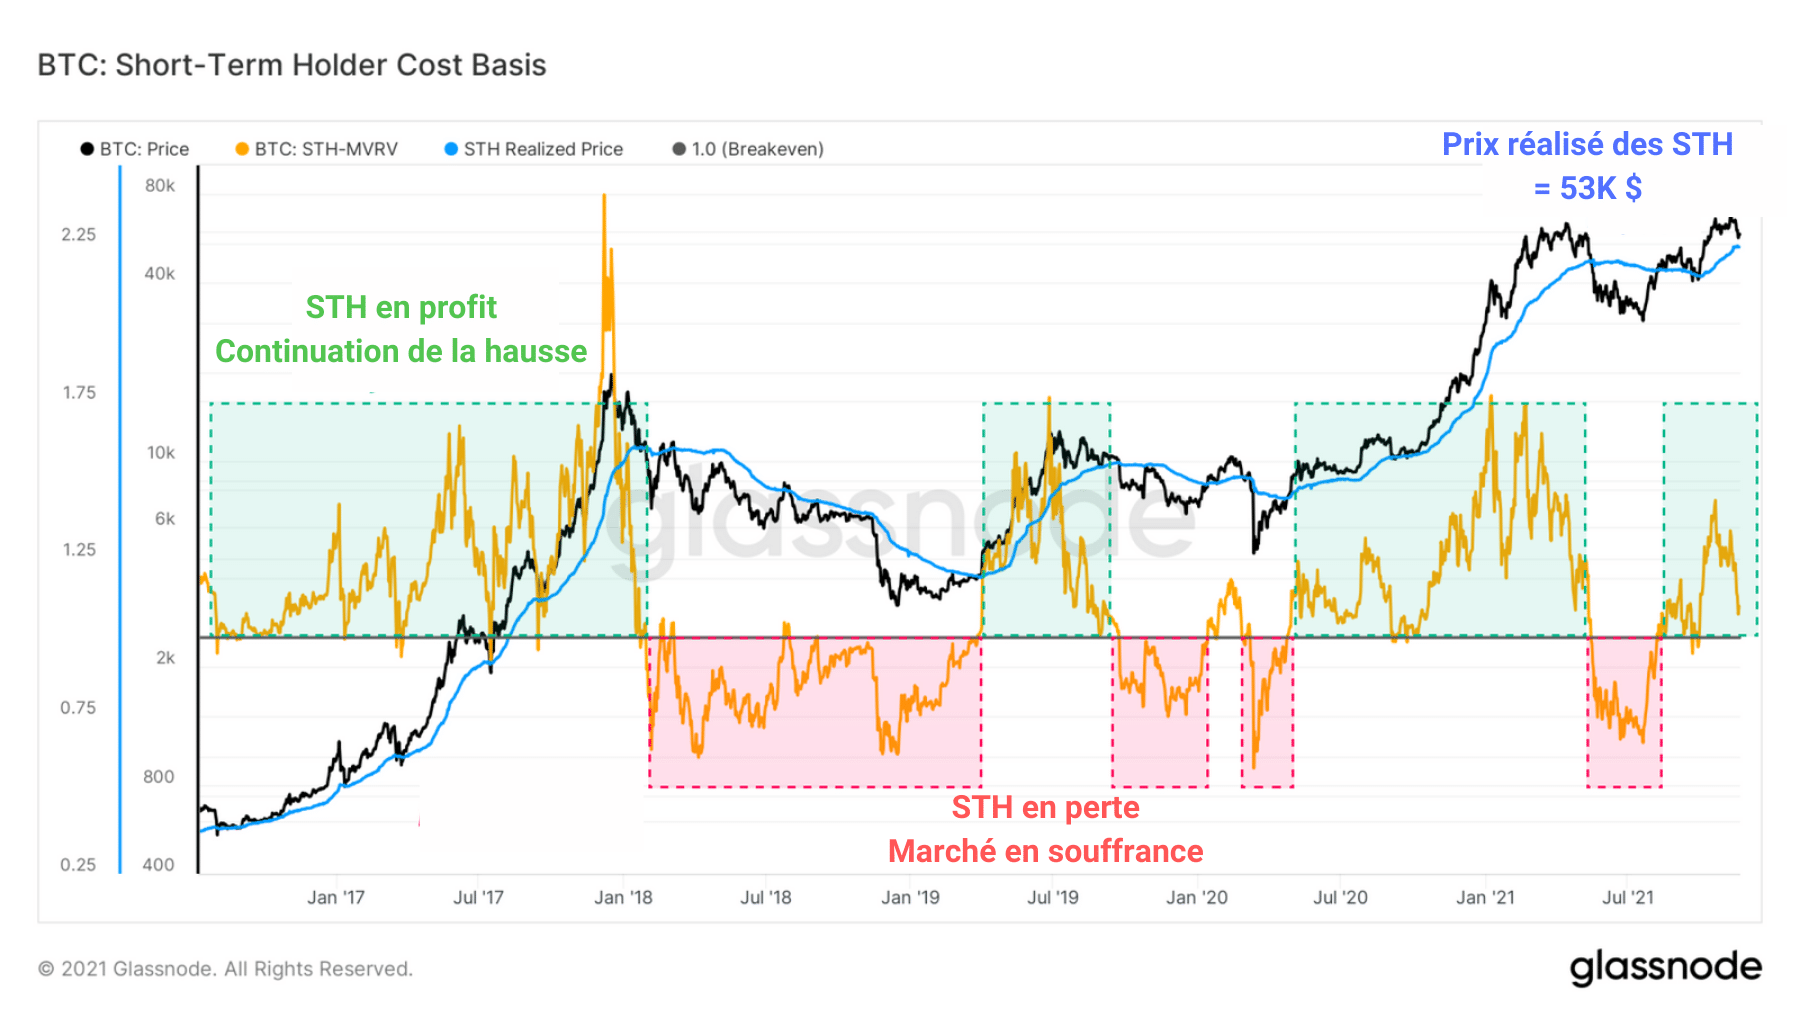
Graph of STH-MVRV and STH-rPrice (BTC) (Source: Glassnode)
What you are looking at is the relationship between the spot price of BTC and the profit index of short-term holders.
The observation is simple, whenever the spot price dips below the realized price, STHs start selling their tokens at a loss, until they reach a maximum pain point around a -50% return.
Conversely, during bullish phases, the spot price is often supported by the realised price as it rises, indicating buying opportunities when the STH-MVRV tests the neutrality threshold as support.
If such a thing were to happen, BTC would need to reach $53,000 in order to test the STH cost basis and trigger a resumption of the rise or a capitulation of this cohort.
The beginnings of a distribution
Let’s complete this analysis with the addition of a final reading prism, that of the long term holders, or LTH.
After accumulating BTC all summer, some entities in this category have twice spent a moderate amount of tokens at recent highs.
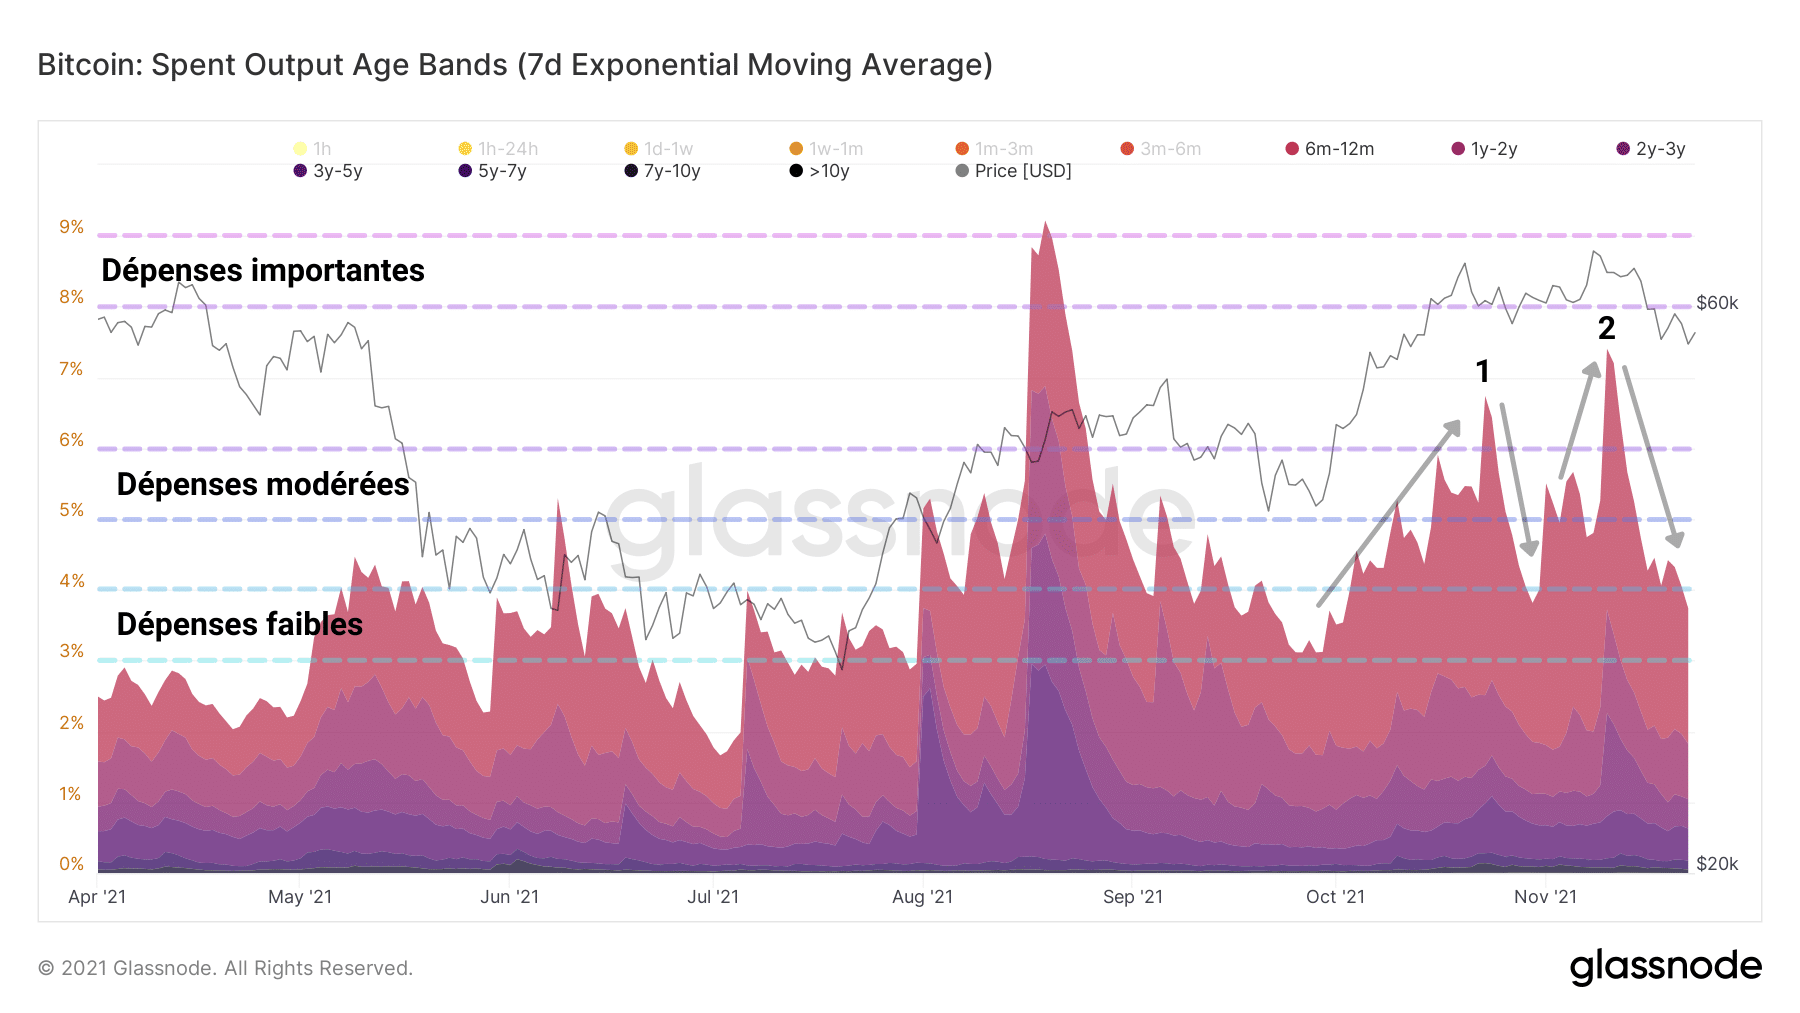
Bitcoin (BTC) SOAB Chart (Source: Glassnode)
As evidenced by the SVAB, these declining volumes signal a rigorous LTH that is controlling its selling pressure so as not to break the market’s momentum.
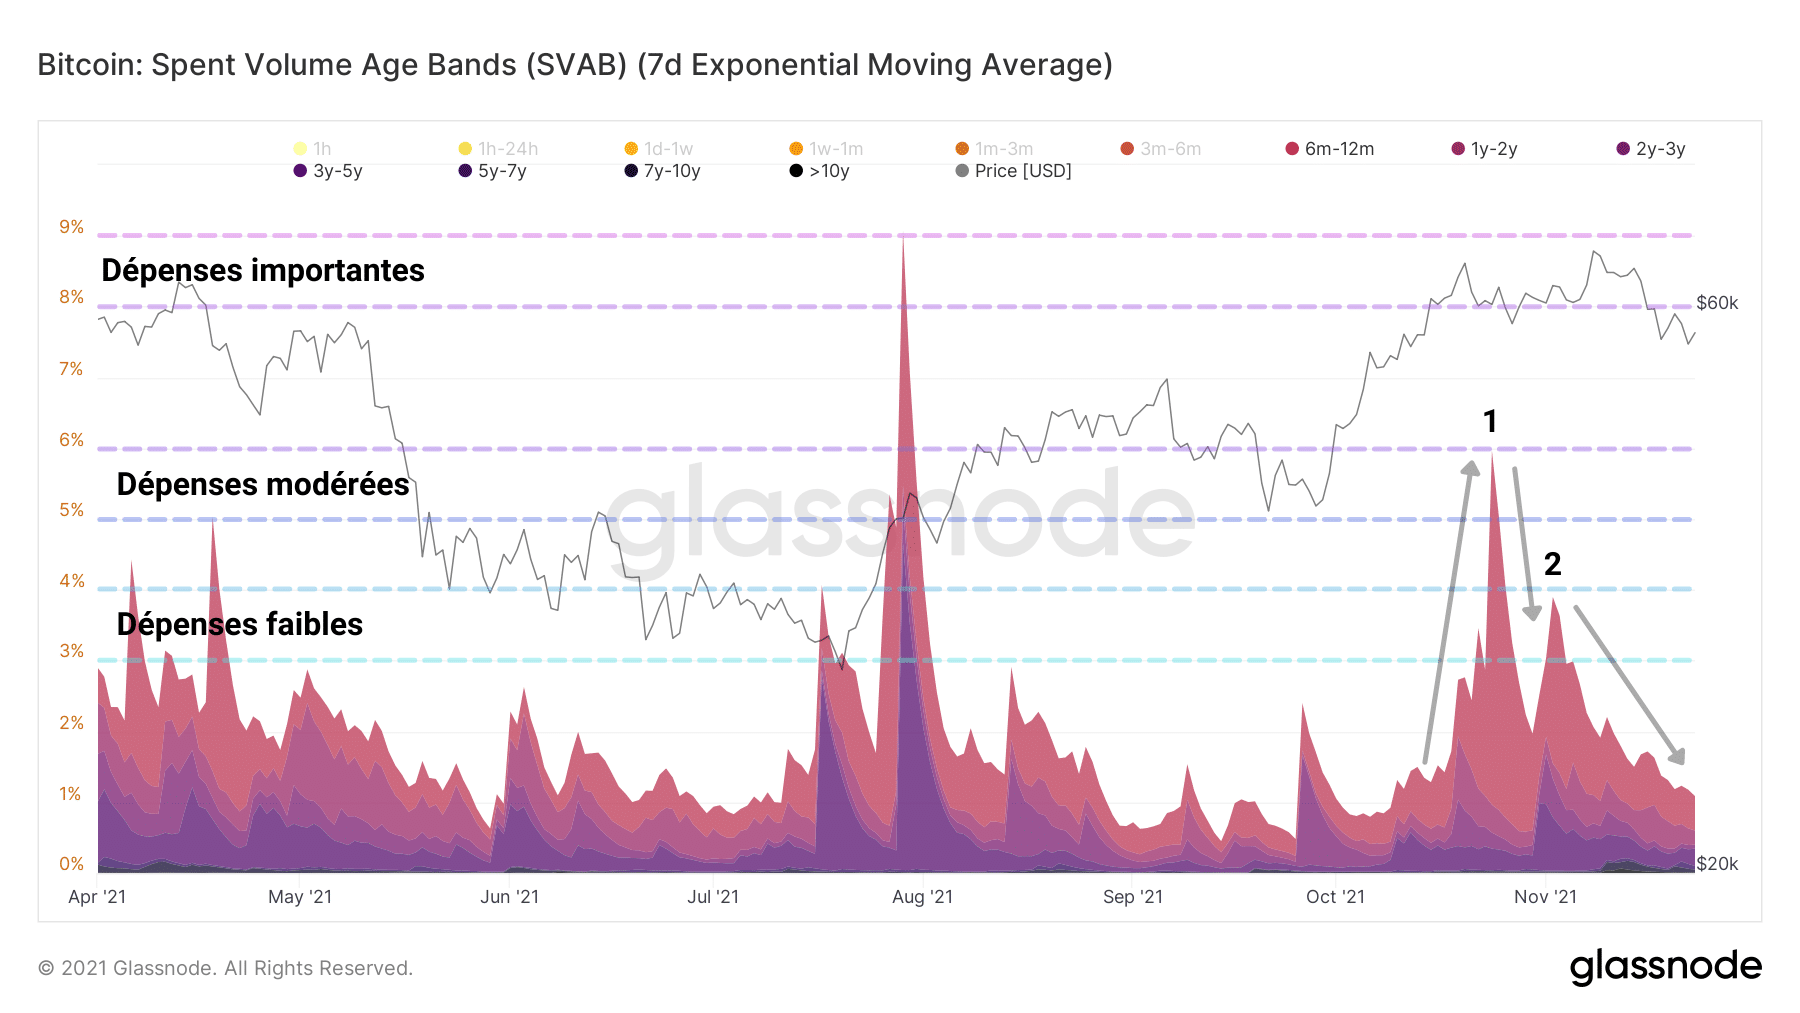
SVAB chart of bitcoin (BTC) (Source: Glassnode)
Slowly beginning to distribute their tokens at the ATH level, as is customary, these long-term holders are bringing a touch of liquidity to the market while realizing their gains as they rise.
This cyclical phenomenon is beginning to be seen on the bitcoin liveliness chart.
As more and more BTC come out of their dormant state and are reactivated, their Token Days (TDs) count is reset to zero.
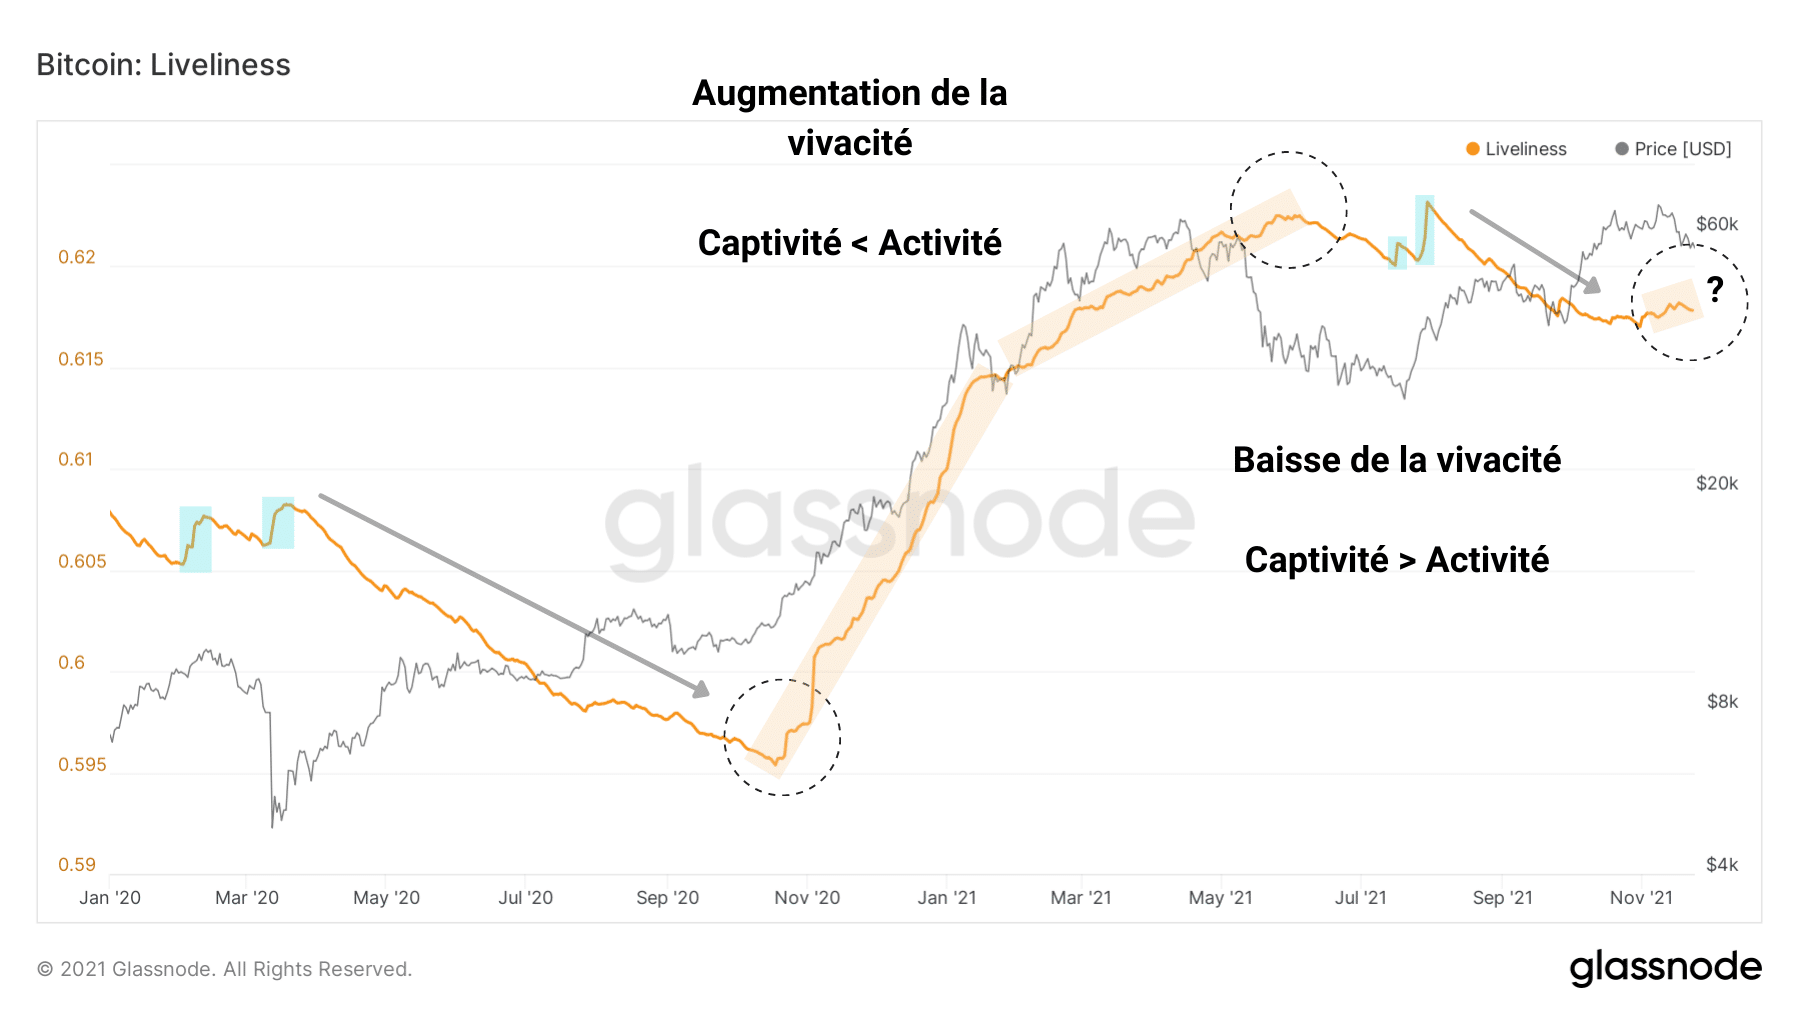
Bitcoin (BTC) liveliness chart (Source: Glassnode)
A destruction of JJ, synonymous with an upturn in economic activity, is looming and bending the curve, initiating a potential trend reversal in this indicator.
Detectable through the study of supply dynamics, this process of releasing captive BTC should begin to be identifiable once the supply held by LTH (blue) is transferred to STH (pink) on a more sustained basis.
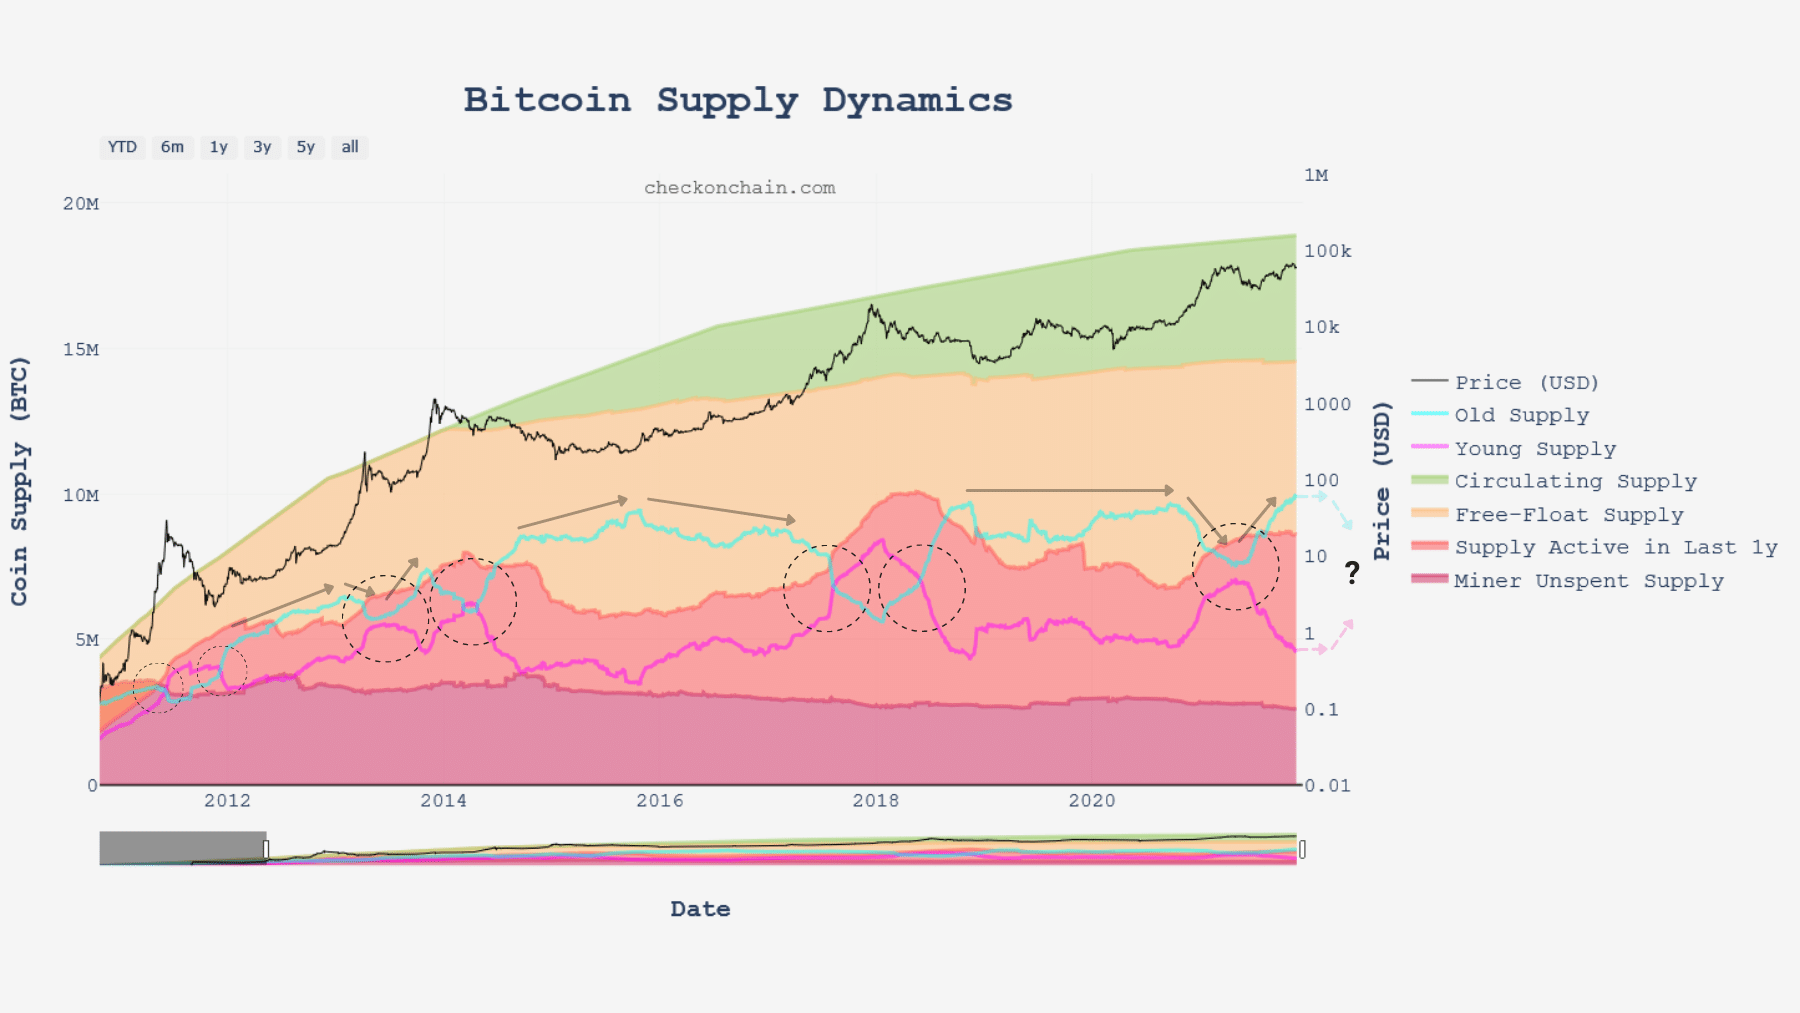
Bitcoin (BTC) supply distribution chart (Source: checkonchain.com)
Synthesis
Finally, it seems that the driver of the recent correction is quite nuanced and that the analysis of the past week can be refined by a broader view.
For example, amidst a lot of optimism, many STHs seem to have entered positions between $53,000 and $69,000, hoping for quick gratification from the market.
Partly taking possession of tokens sold by LTHs near the top, these entities were quickly disillusioned.
Reselling these tokens in response to the volatility of the correction, STHs then participated in the selling pressure from the derivatives markets.
In conclusion, this week’s study allows us to expand our understanding of the psychology of different cohorts and explain their behaviour within the current market environment.
We can now say that:
- the derivatives markets have been purged of excess risk-taking;
- STH have been caught short by the correction in play since 9 November;
- LTHs are slowly beginning to distribute their token holdings as the bitcoin price explores new highs.