
Faced with the prevailing uncertainty and low prices of market-leading assets, investors are reducing their risk exposure in a variety of ways. While a rotation of capital favours Bitcoin over Ether, speculators in the options markets are bracing for a further decline for the queen of cryptocurrencies. On-chain analysis of the situation.
Bitcoin crosses $31,000, Ether under $2,000
The price of Bitcoin (BTC) breaks through the $30,000 levels from above, offering a breath of fresh air to investors plagued by uncertainty. The price of the ether (ETH) is approaching $2,000, falling below its EMA21.
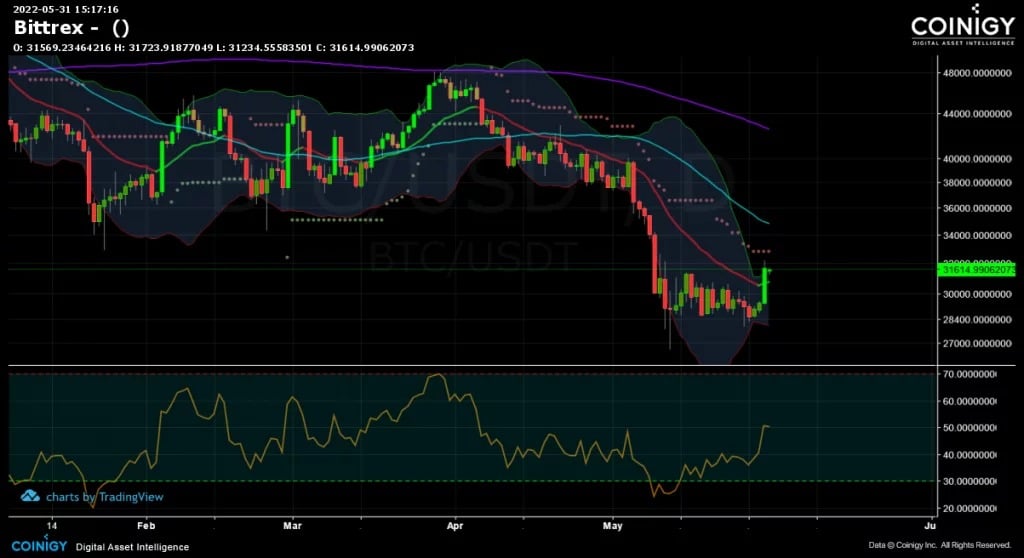
Figure 1: Daily Bitcoin (BTC) price
Given the uncertain macroeconomic environment and the ongoing bear market in the cryptocurrency sector, investors appear to be limiting their risk exposure.
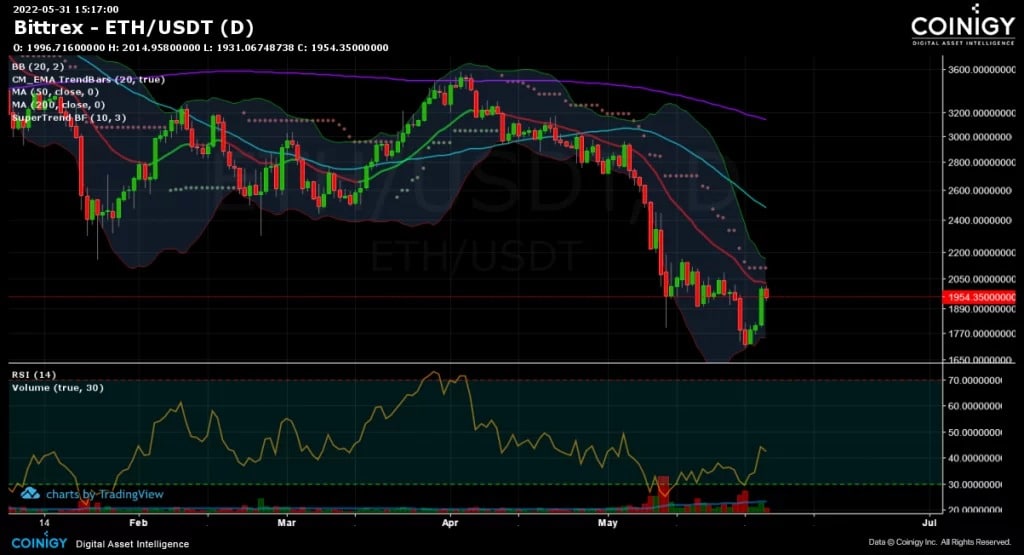
Figure 2: Daily Ether (ETH) price
This results in a rotation of capital from ETH to BTC, which can be seen on both channels.
This week, we will look at the close relationship Ether has had with Bitcoin since its arrival on the market through various metrics relating to their valuations and speculation in the derivatives market.
Capital is migrating from Ether (ETH) to Bitcoin (BTC)
Let’s begin our study by highlighting the increasing correlation between the two leading assets.
The chart below shows the historical correlation between BTC and ETH over the last six years and reads as follows:
- A value close to -1 means that Ether is negatively correlated to Bitcoin and follows an opposite path.
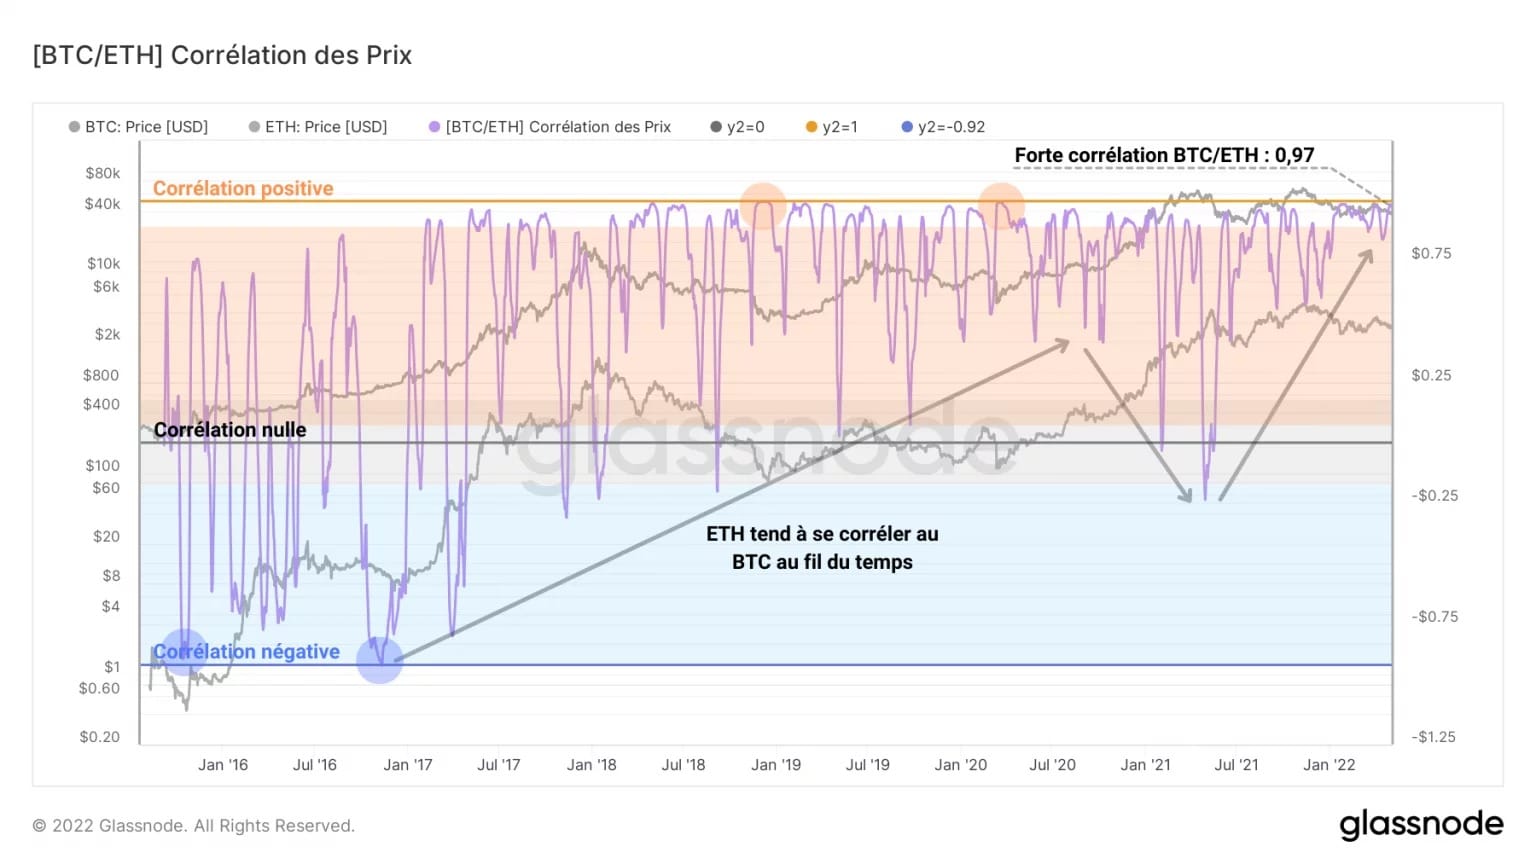
Figure 3: Correlation between BTC and ETH prices
After a quick read, it appears that despite its erratic start, Ether tends to correlate positively with Bitcoin as it matures. With a current correlation of 0.97, the ETH price tracks the BTC price assiduously, although its amplitudes are larger, both up and down.
In terms of profitability, the youth of the Ether market, which emerged in late 2015, is reflected in the number of Ethereum addresses in profit, shown below.
Reaching a low point of 3.2% during the Q1 2019 capitulation, the Ethereum network was then incubating an overwhelming majority of addresses in loss (96.8%), compared to 54% for the Bitcoin network.
The volatility of Ethereum address profitability appears to be diminishing over time, gradually embracing the same dynamics as the Bitcoin network. While a potential low point was reached a fortnight ago, a majority of Ethereum (61.33%) and Bitcoin (51.04%) addresses are still in profit.
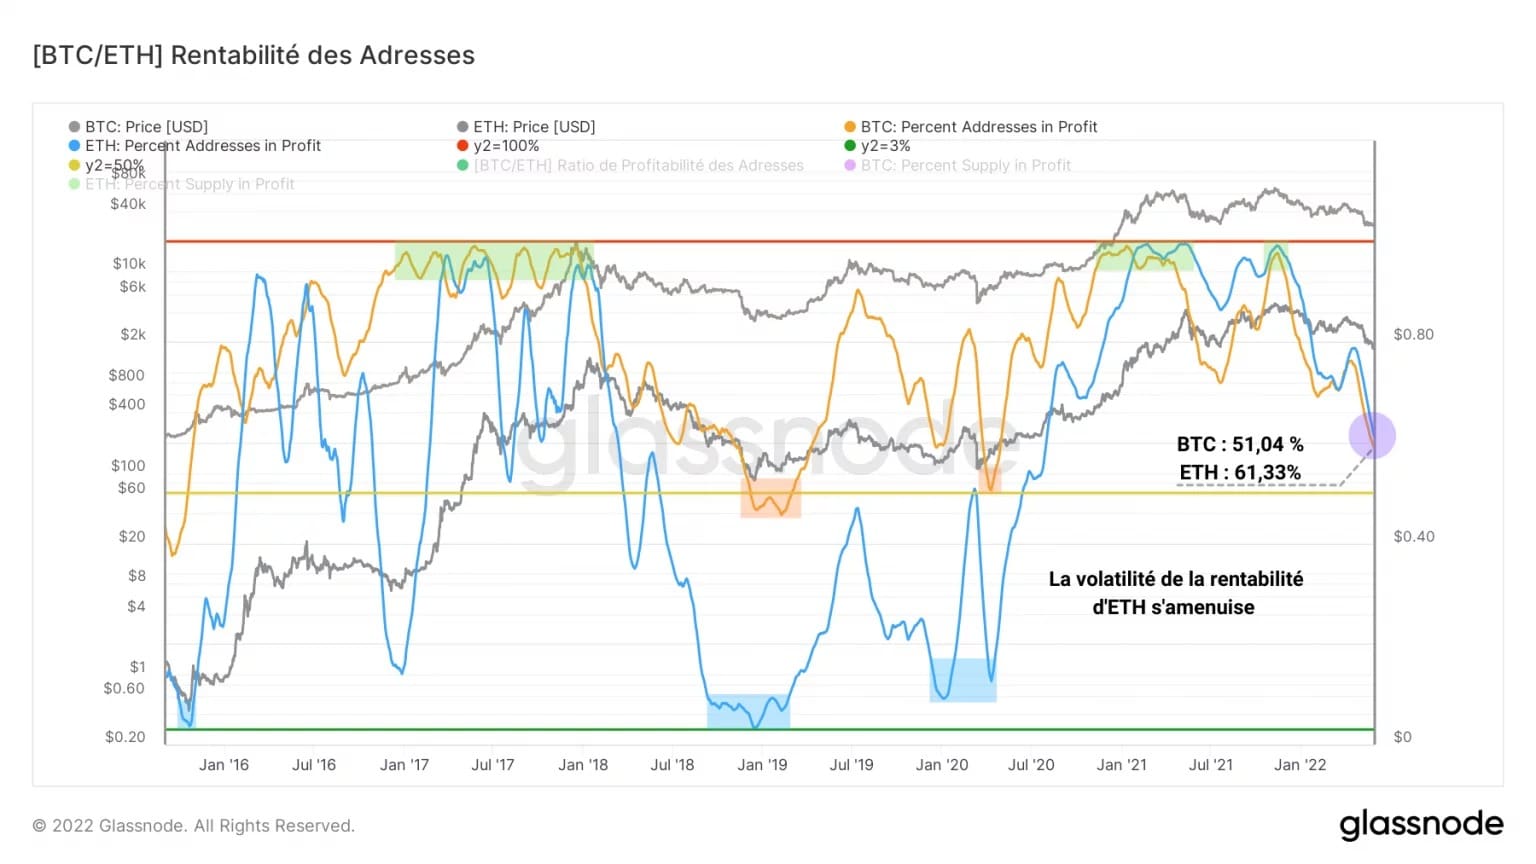
Figure 4: Profitability of Bitcoin and Ethereum addresses
In terms of the monthly returns of the two assets, a lag of a few weeks can be observed for ETH, although the charts tend to line up with the increasing correlation mentioned above.
Note, however, that Ether outperforms Bitcoin, both up and down, reflecting its higher volatility.
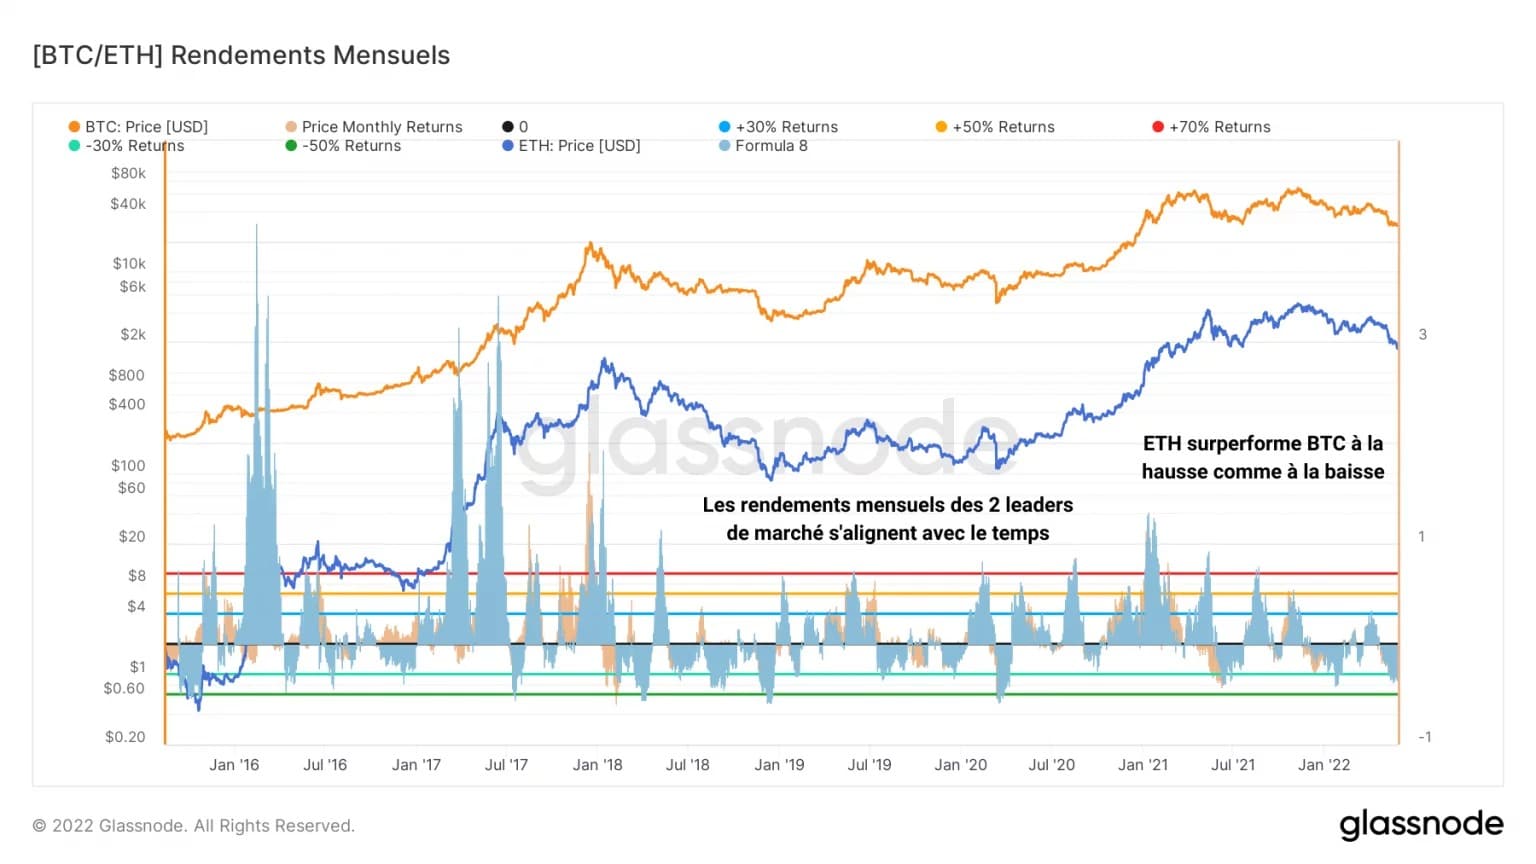
Figure 5: Monthly Returns of BTC and ETH
Finally, we can observe a sector rotation between the two largest market caps in different market phases.
The following chart represents the dominance ratio between the market caps of Bitcoin and Ether (in purple).
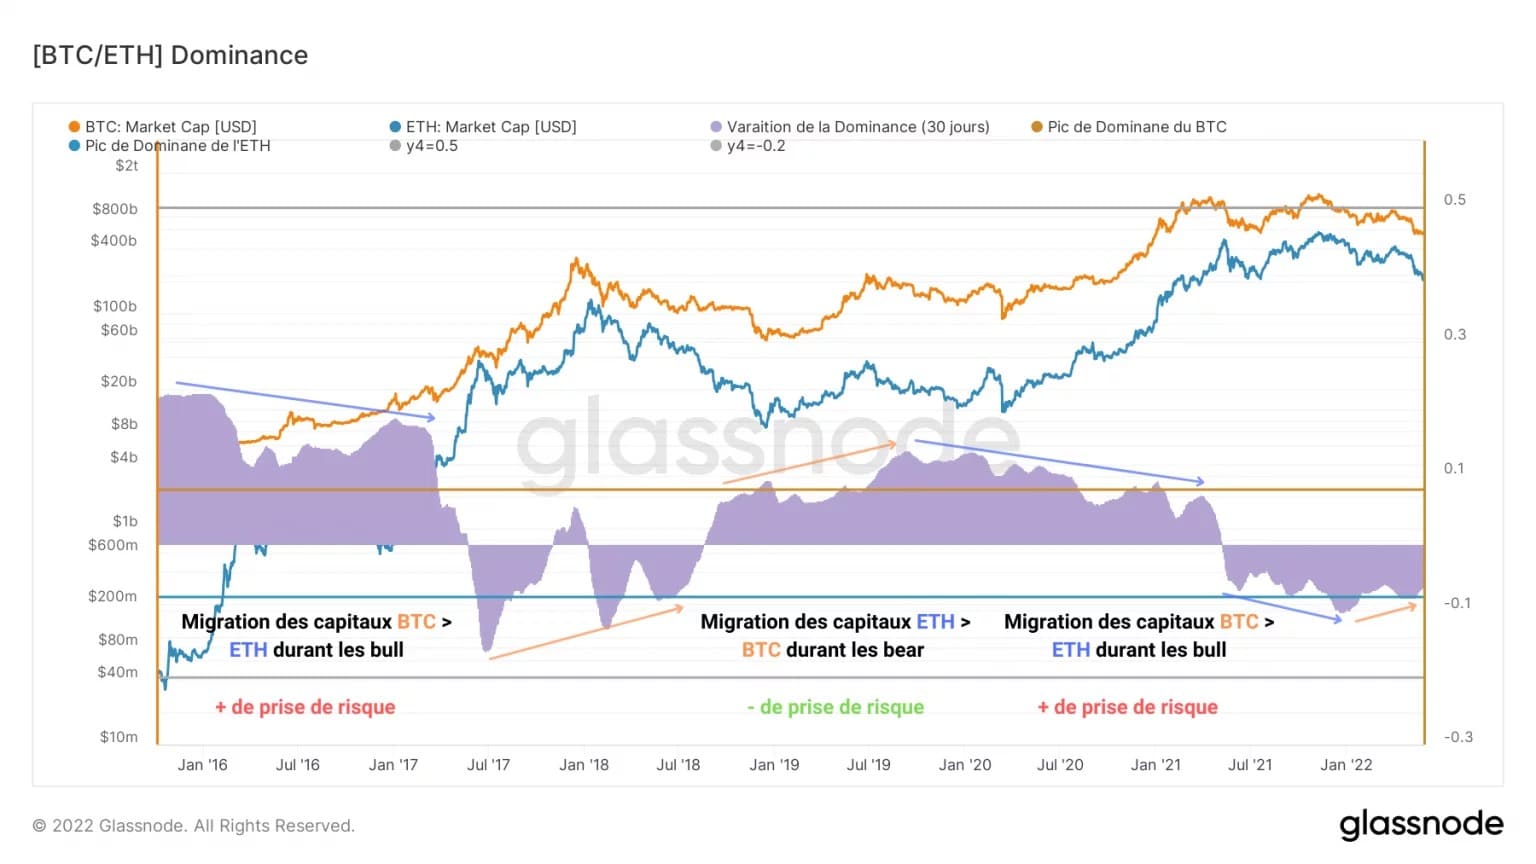
Figure 6: Dominance of BTC and ETH market caps
There are two opposing trends:
- At the end of bull markets/beginning of bear markets, capital leaves Ethereum and migrates to Bitcoin in a defensive move (orange arrow).
- During bull market ends/bear market starts, investors expose themselves to Ether’s bullish volatility and increase their risk taking, causing Bitcoin’s dominance to fall (blue arrow).
Speculative divergence for both market leaders
This behaviour is palpable within the derivatives markets: modelling the dominance of Open Interest (OI) towards ETH and BTC, one can note a notable change in strategy from 8 December onwards, at the beginning of the current correction phase.
Indeed, while speculators had been favouring Ether for over a year, the market’s unattractive price action has pushed them to Bitcoin, increasing its OI dominance, a sign that more capital is now being allocated to BTC derivatives.
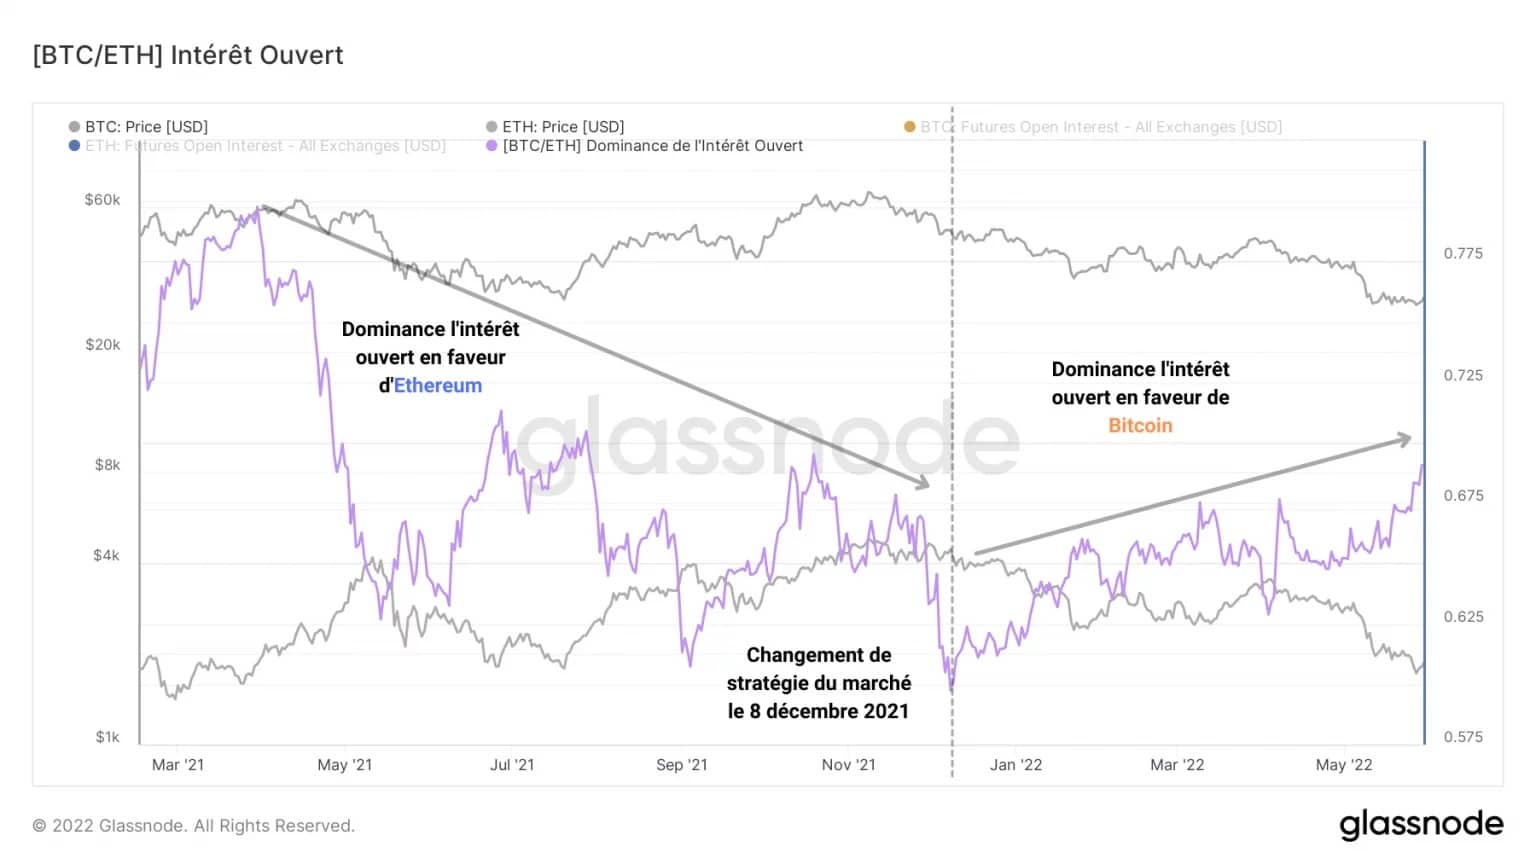
Figure 7: Dominance of open interest on BTC and ETH
Regarding the futures financing rates of the two market leaders, no significant disparity can be observed, indicating that speculators are trading both assets using similar strategies.
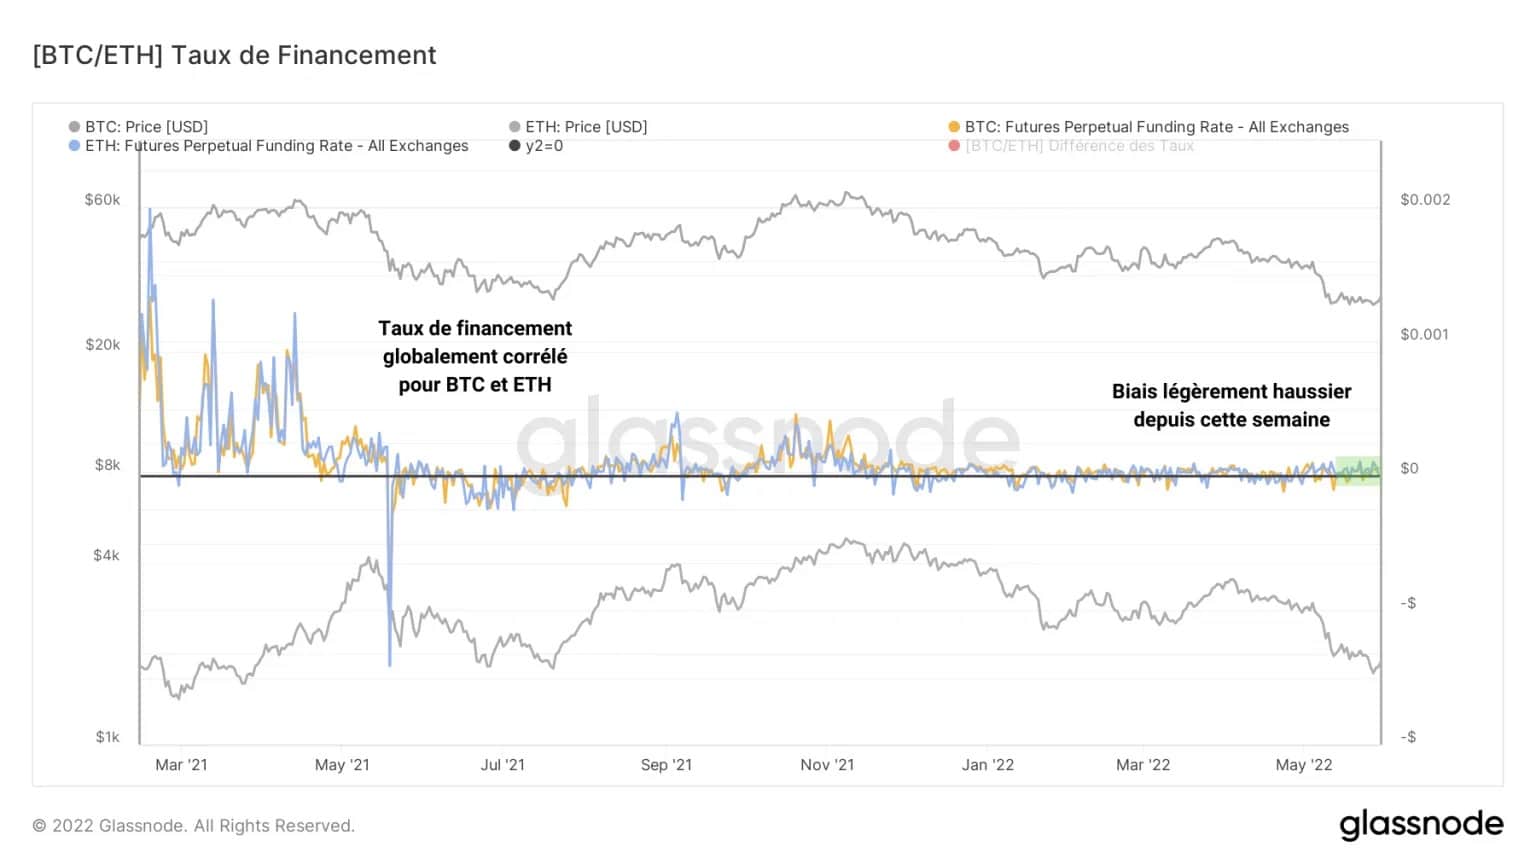
Figure 6: Funding rates for BTC and ETH futures contracts
Currently, this indicator signals the presence of a slight bullish bias in future contracts for ETH and BTC.
However, an opposite dynamic is present on the options market side, presenting the ratio of puts to calls for both assets.
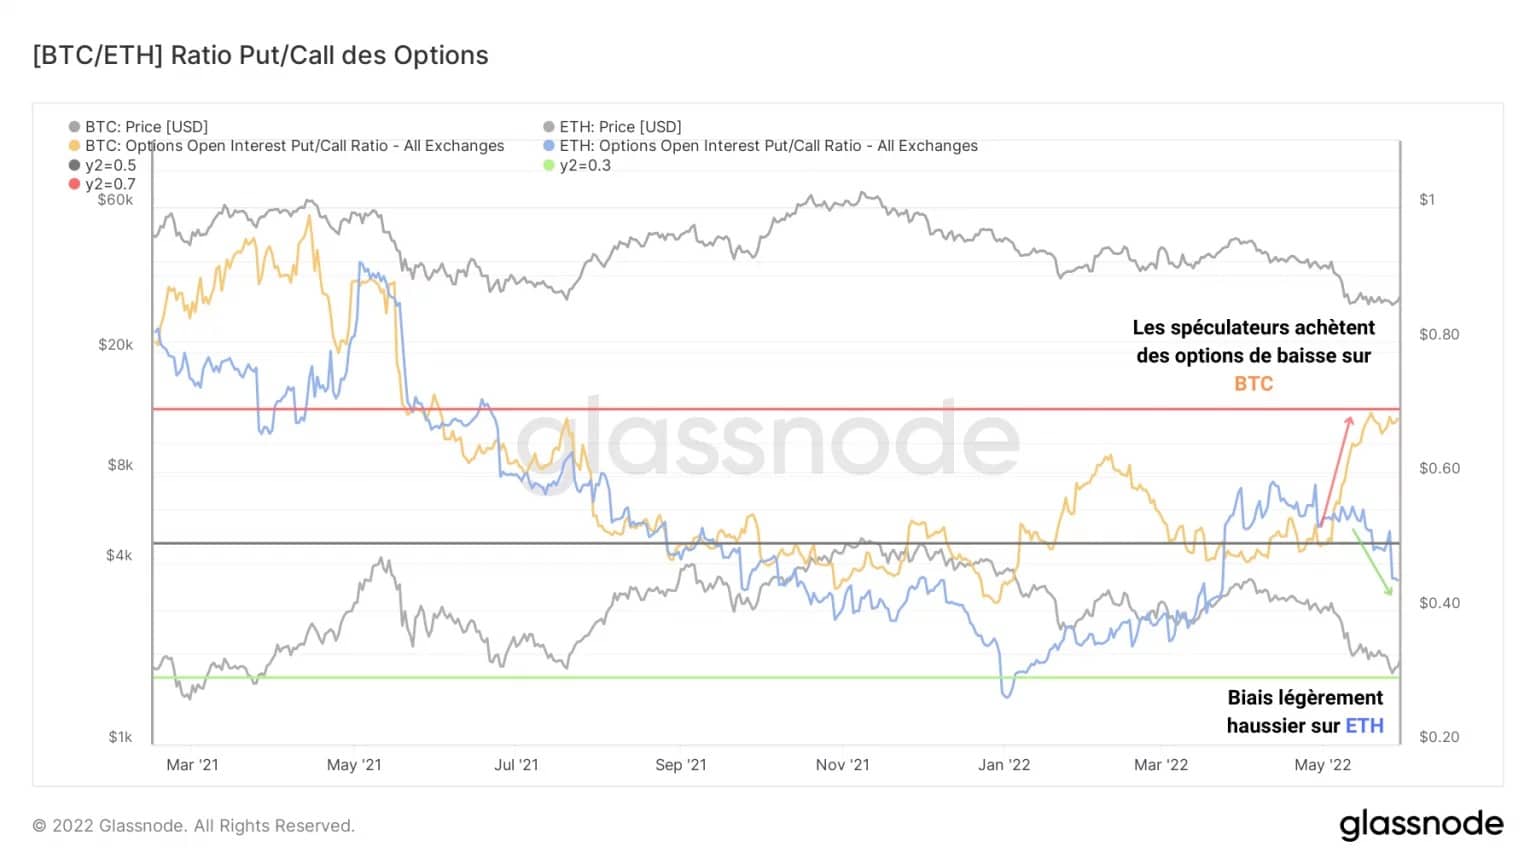
Figure 5: Put/Call Ratio of Options on BTC and ETH
The chart above shows a notable divergence:
- Speculators expect Bitcoin to fall and protect themselves by accumulating puts;
- the market shows a more mixed bias towards Ether and favours a slight rise in the short term.
Summary of this on-chain analysis
In sum, the Bitcoin (BTC) and Ether (ETH) markets are now more strongly correlated than ever.
While ETH tends to behave similarly to BTC despite its young age, its volatility persists and creates a performance asymmetry that speculators happily exploit.
Indeed, a sectoral rotation between the two market leading assets is once again at work, favouring Bitcoin, given the prevailing uncertainty.
This can be seen in the derivatives markets, where speculators are allocating more capital to Bitcoin, while preparing for a future decline in its price.