
As the economic, health and geopolitical environment shakes traditional finance, bitcoin (BTC) is somehow resisting the selling pressure. Hovering around the $40,000 mark, the queen of cryptocurrencies appears to be in a transitional phase to a still uncertain trend. At this stage, how is the supply in circulation distributed among the various market bodies and entities? On-chain analysis of the situation.
Bitcoin resists on its support
The price of Bitcoin (BTC) continues to hover around $40,000 support, giving short-term speculators a hard time.
Falling below all of its resistance lines (21EMA in red, 50MA in blue and 200MA in purple), the price of BTC for some portends a sharp drop, while others are calling for consolidation and a sharp accumulation.
Given the geopolitical (kinetic war in Ukraine), macroeconomic (Fed rate hike, IMF chief’s statements, escalating consumer prices) and health (Shanghai reconfiguration and supply chain disruption) context, the response from traditional markets has been swift and large capital losses are hitting companies such as Netflix, Apple, AramCo and Berkshire Hathaway.
Bitcoin, which has been positively correlated to technology and energy stocks since March 2020, seems to be weathering this global uncertainty as best it can, and is now less volatile and bearish than many traditional commodities.
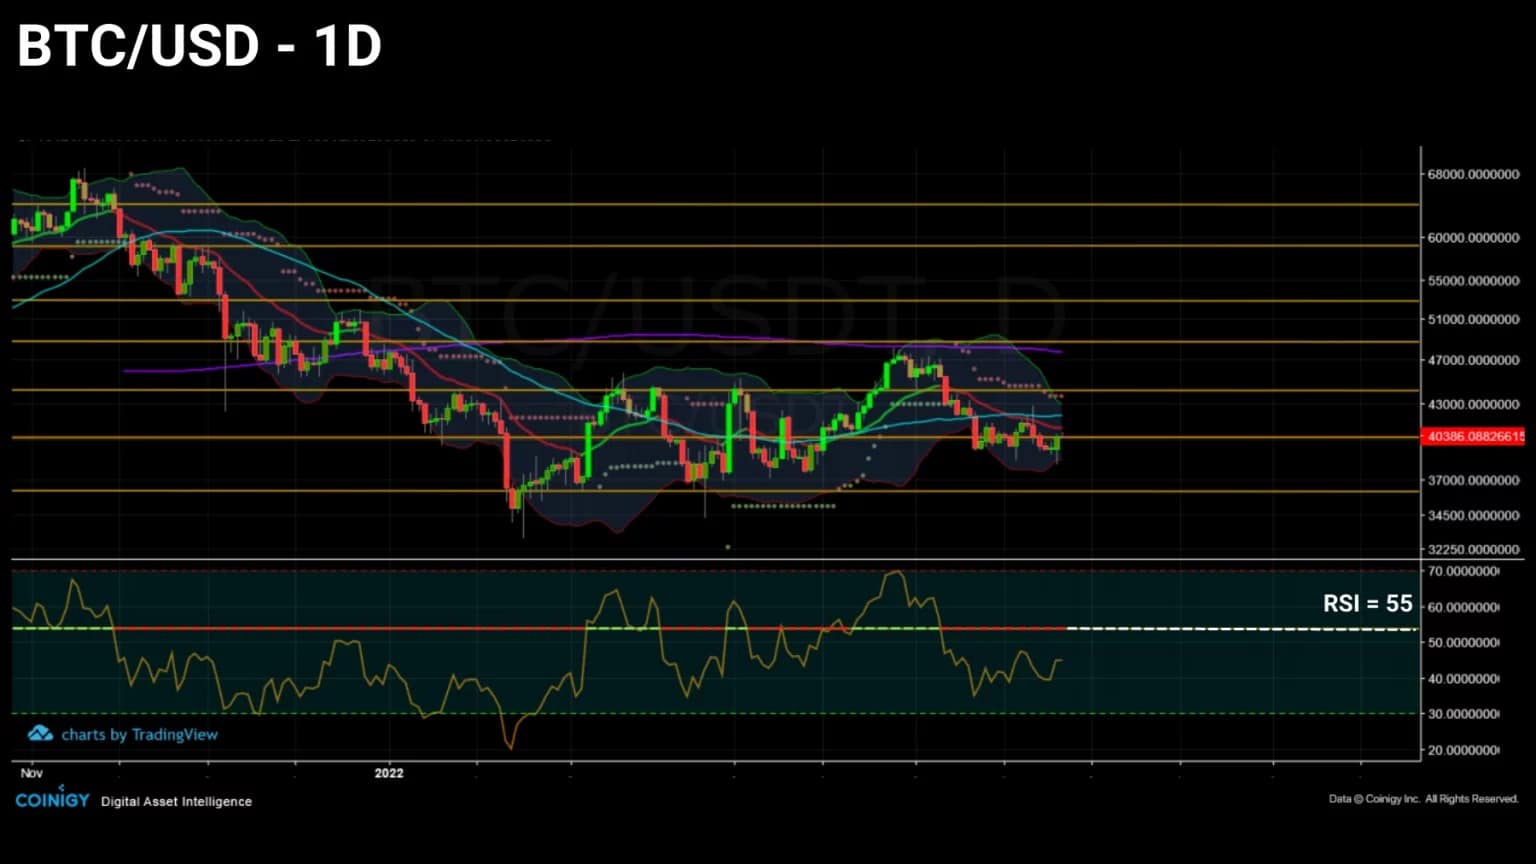
Figure 1: Daily price of bitcoin (BTC)
This week’s special edition takes a long look at the distribution of the supply of BTC in circulation. The aim today is to take stock of the current market distribution in order to study how it will evolve over the coming months.
To do this, we will discuss a wide range of metrics relating to the nature and distribution of the supply of BTC in circulation in order to assess its liquidity, distribution and dynamics before concluding this analysis with a touch of moderate optimism.
A market with new structures
Let’s start this study by highlighting a key fact for the BTC market. Indeed, in December 2021, the 18,900,000th has been mined, leaving the last tenth of the supply about 120 years to be mined. The year 2022 therefore marks a pivotal point in terms of supply and demand dynamics.
90% of total Bitcoin supply has already been mined.
98% of the world doesn’t own Bitcoin yet!
Number will go up! 🚀😉
– Bitcoin Archive 🗄🚀🌔 (@BTC_Archive) December 13, 2021
With less than 10% of the world’s money supply left to be mined today, the competition among nations, companies and individuals will be fierce as the economic and social utility of Bitcoin (the network) and bitcoin (the currency) is confirmed or disproved by the challenges and crises ahead.
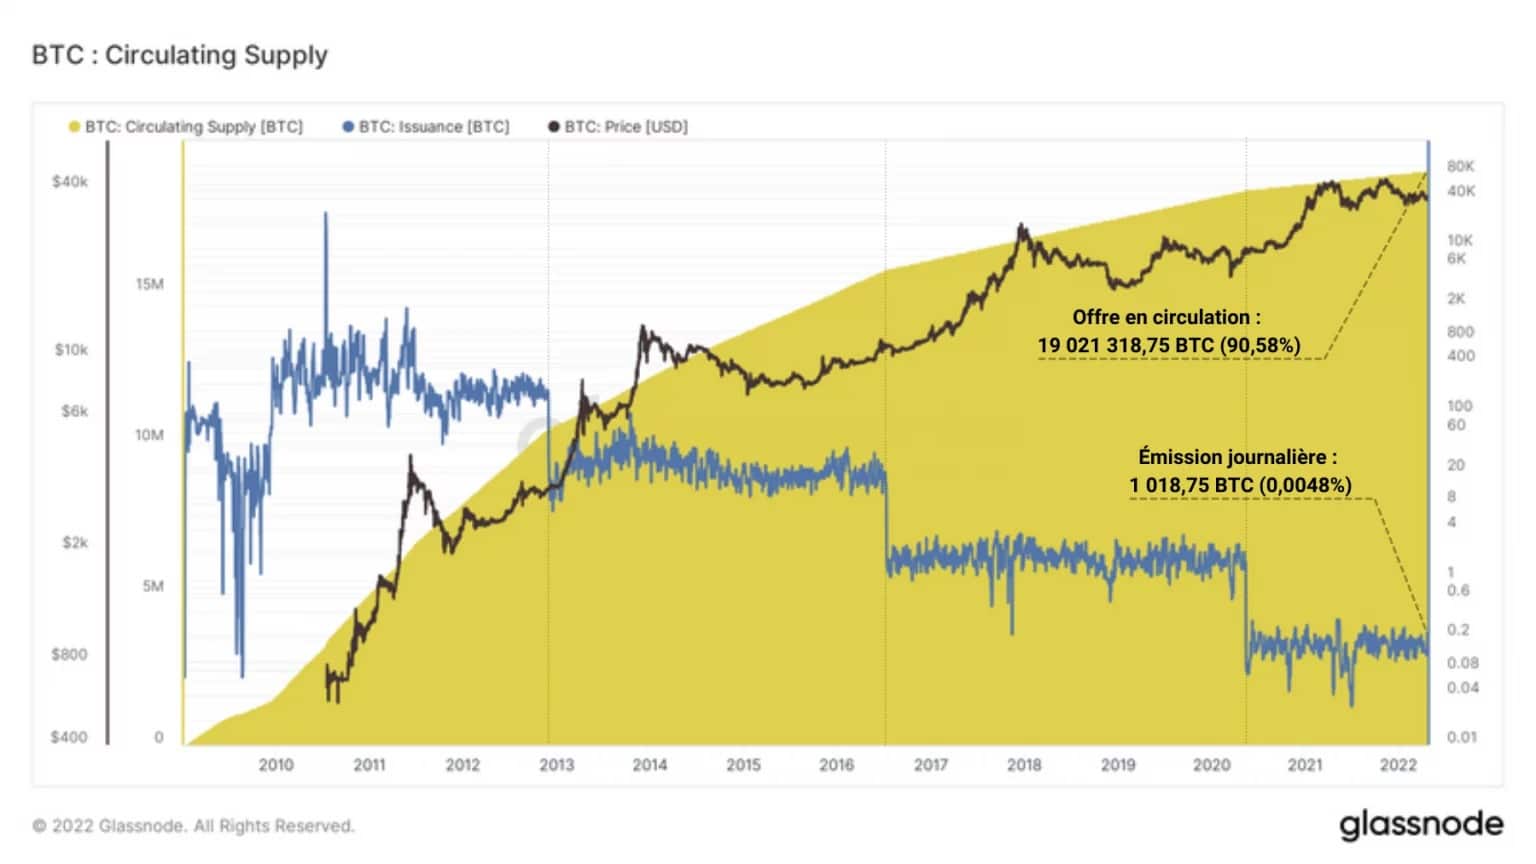
Figure 2: Supply in circulation
At an average daily currency issuance of 1,018.75 BTC, until the next halving, estimated to be around 2024, at block 840,000, that is 0.0048% of the total supply being mined each day.
However, it would be ambitious to claim that the entire supply currently in circulation is available. Indeed, many BTC are currently lost, forgotten or inaccessible, reducing the actual supply available and decreasing the total selling pressure of the market.
The lost coins only make other people’s bitcoins more valuable. Think of it as a gift to the community.” – Satoshi Nakamoto
Glassnode estimates that, by deducting from the supply in circulation all BTC that have not been active for at least 7 years, the real available supply (called Adjusted Supply) would be limited to about 15.5 million BTC, representing 73.88% of the total supply.
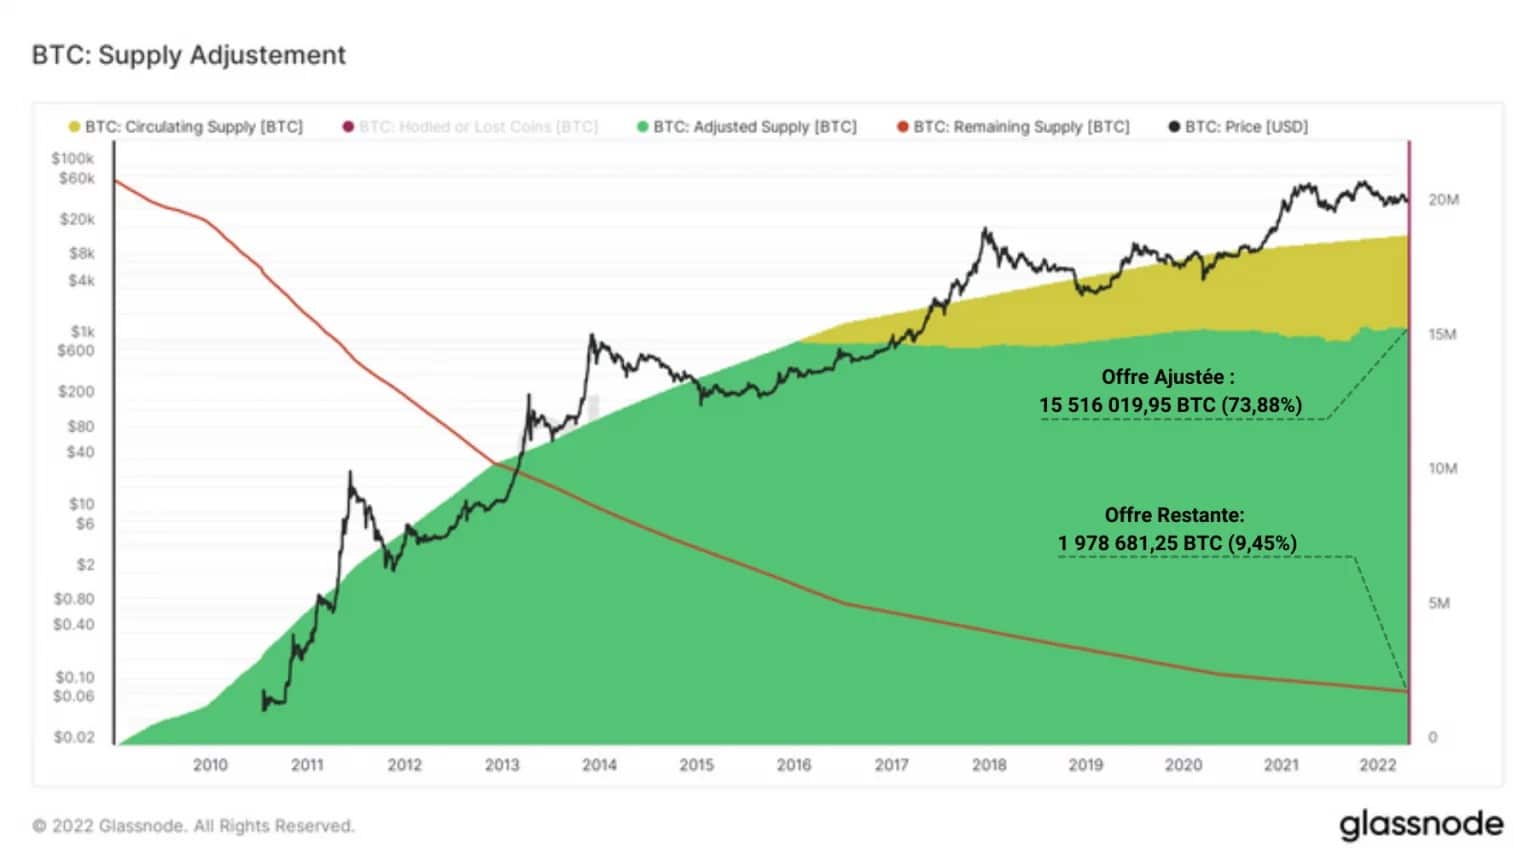
Figure 3: Adjusted Supply
Thus, 16.7% of all BTC created (about 3.5 million) would already be frozen forever. And this while the remaining supply to be mined, representing less than 2 million BTC or 9.45% of the total supply, is today fiercely coveted by a multitude of entities.
Let us then look at the liquidity of the supply in circulation. The study of bitcoin’s liquidity is essential to understand its market dynamics. Indeed, if many bitcoins are held back and saved by participants, a phenomenon called liquidity shock takes place, having the effect of weakening selling pressure.
Put another way: A sustained increase in illiquid bitcoins is an indication of strong HODLing sentiment among investors and is a potential bullish signal.
The supply of BTC then breaks down into three categories:
-
illiquid BTC, with little or no spending history, mostly held outside exchanges over the long term with strong conviction;
- liquid BTC, regularly moved on exchanges, subject to speculation by short-term investors;
- highly liquid BTC, in constant movement, often associated with coins used by decentralised finance (DeFi), under the aegis of WBTC.
The chart below shows the illiquid supply (purple) and the sum of the liquid and highly liquid supply (blue) over time.
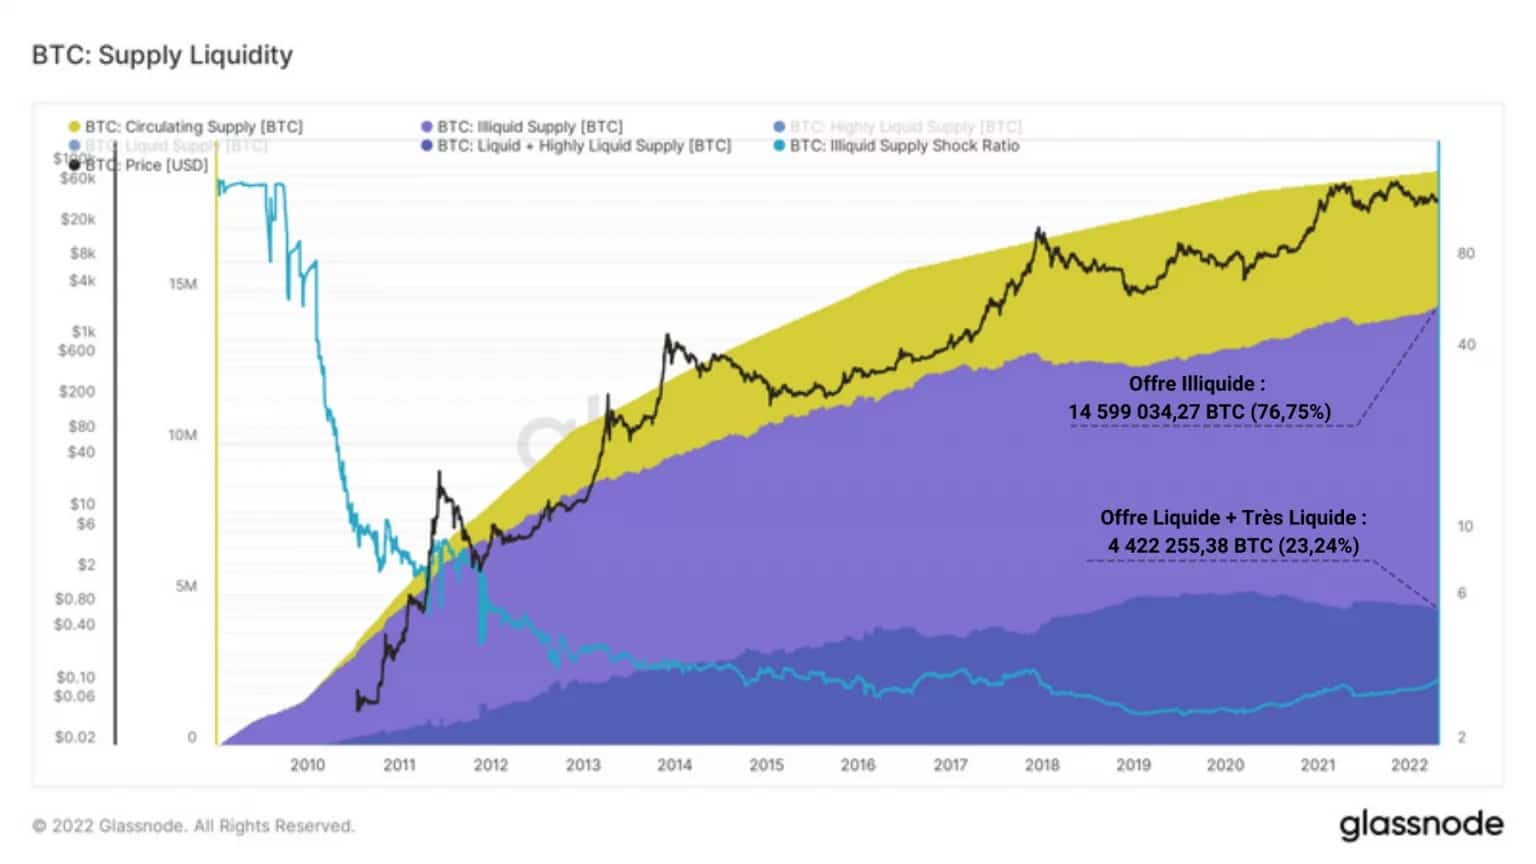
Figure 4: Liquidity of outstanding supply
It appears from his observation that almost 15 million (76.75%) of the outstanding supply is currently illiquid, a score that has been increasing almost constantly over the history of bitcoin excluding the bear market of 2018 – 2019 and the capitulation of May 2021.
On the other side, it seems important to mention the gradual decline of the liquid and highly liquid supply, which today represents less than a quarter of the outstanding supply (4.4 million BTC).
Identified in our previous analyses, this propensity of the market to withdraw BTC from the market in order to retain it for the long term is indicative of a paradigm shift by investors from spending to saving.
An increasingly coveted offer
Let’s begin this unpacking of the supply of BTC by looking at the holdings of several types of entities. Following the historical path of bitcoins from issuance to distribution, we will study the holdings of miners, exchanges, long-term investors (LTH) and then short-term investors (STH).
There are only two ways to acquire bitcoins, earn them or buy them. The cohort of miners, because of their essential role as block forgers, belong to those entities that are paid in BTC.
Both compulsive sellers, because they have to cover their CAPEX and OPEX costs, and seasoned accumulators, miners today concentrate 1.8 million BTC, i.e. 9.58% of the supply in circulation.
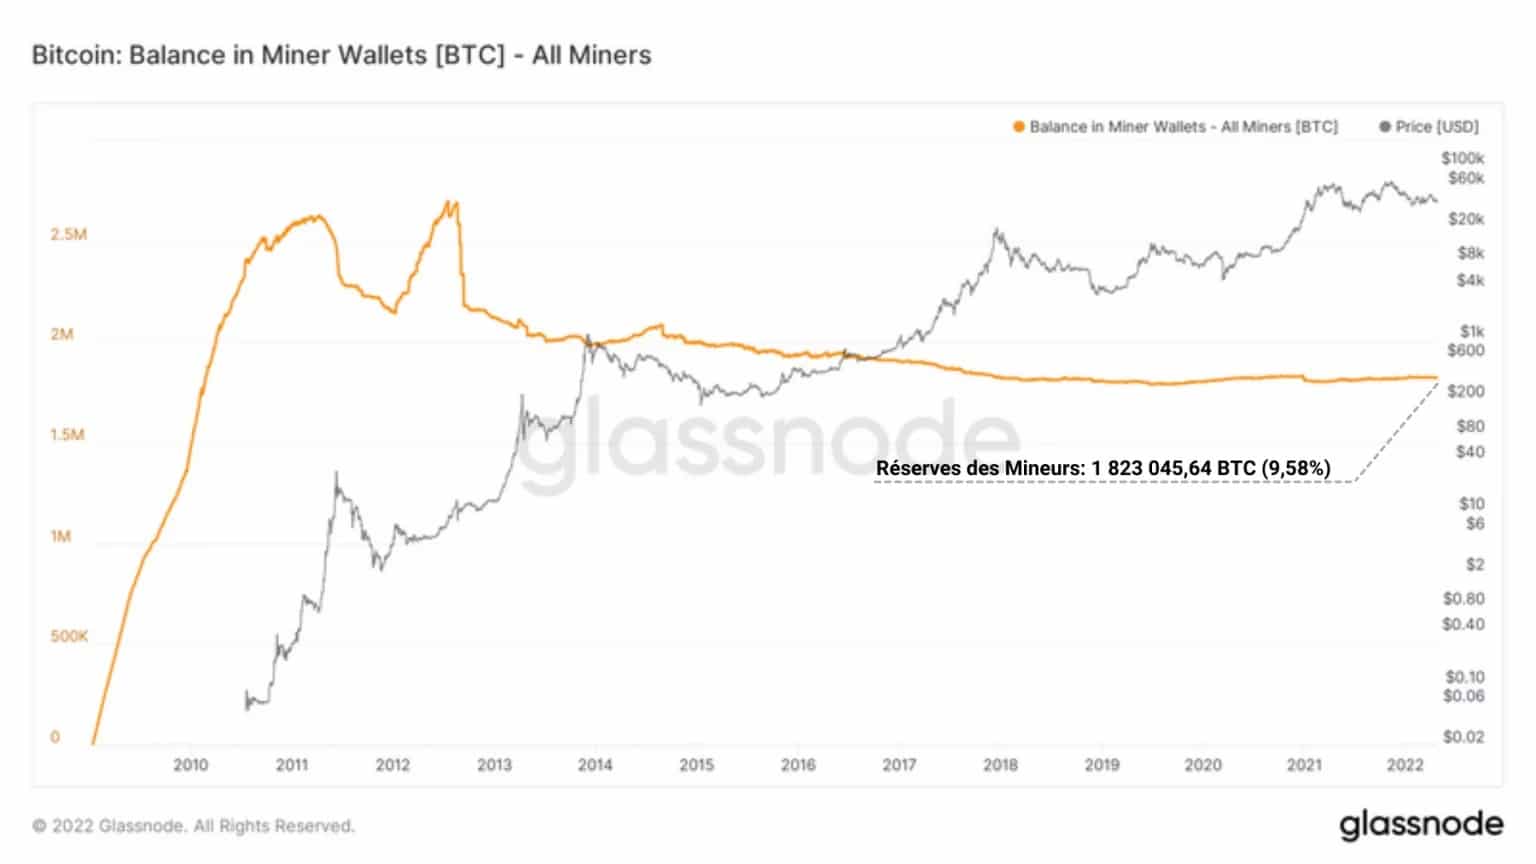
Figure 6: Miners’ reserves
From the historical evolution of the reserves held by this cohort, it appears at first glance that their holdings are tending to stabilise, as less and less BTC is needed to spend as the price increases.
Once spent, the miners’ BTC are mostly available on exchanges, which are mostly centralised platforms offering many types of financial services, including the purchase of bitcoins, at the market (spot) price.
These exchanges, which were expanding their reserves between 2012 and 2020, increased both their number and their stock of BTC before starting a clear reversal of the trend in March 2020.
With the exception of Binance, Kraken, FTX and Bittrex, the holdings of these platforms then fall structurally without faltering. The capitulation of May 2021 will bring some liquidity back to these markets, but it will be short-lived.
By the November 2021 ATH, reserves on all exchanges begin to melt and plunge in concert under waves of consecutive withdrawals. With nearly 2.4 million BTC now in circulation, or 12.66% of the supply in circulation, it’s a safe bet that exchanges will experience large waves of withdrawals in the future.
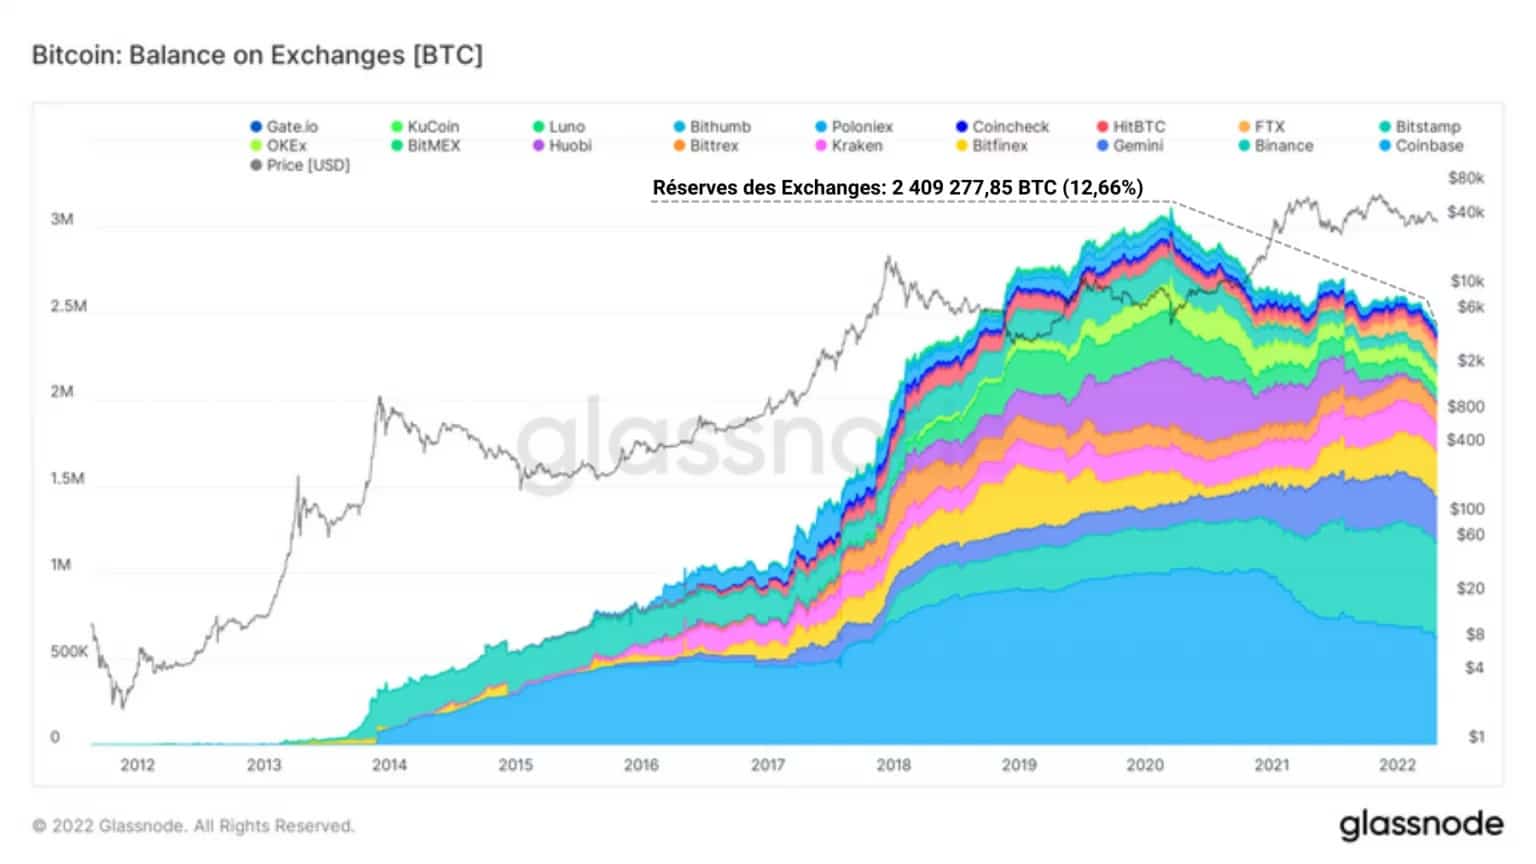
Figure 7: Exchange Reserves
Among the cohorts of investors participating in this exodus of BTC from exchanges to cold storage tools and individual portfolios, short-term (STH) and long-term (LTH) investors are two particularly active groups.
STHs, entities with a short time horizon, sensitive to price volatility and holding their holdings for less than 155 days, are statistically more likely to give in to market selling pressure. They are very often top buyers, making them the casualties of late bull markets.
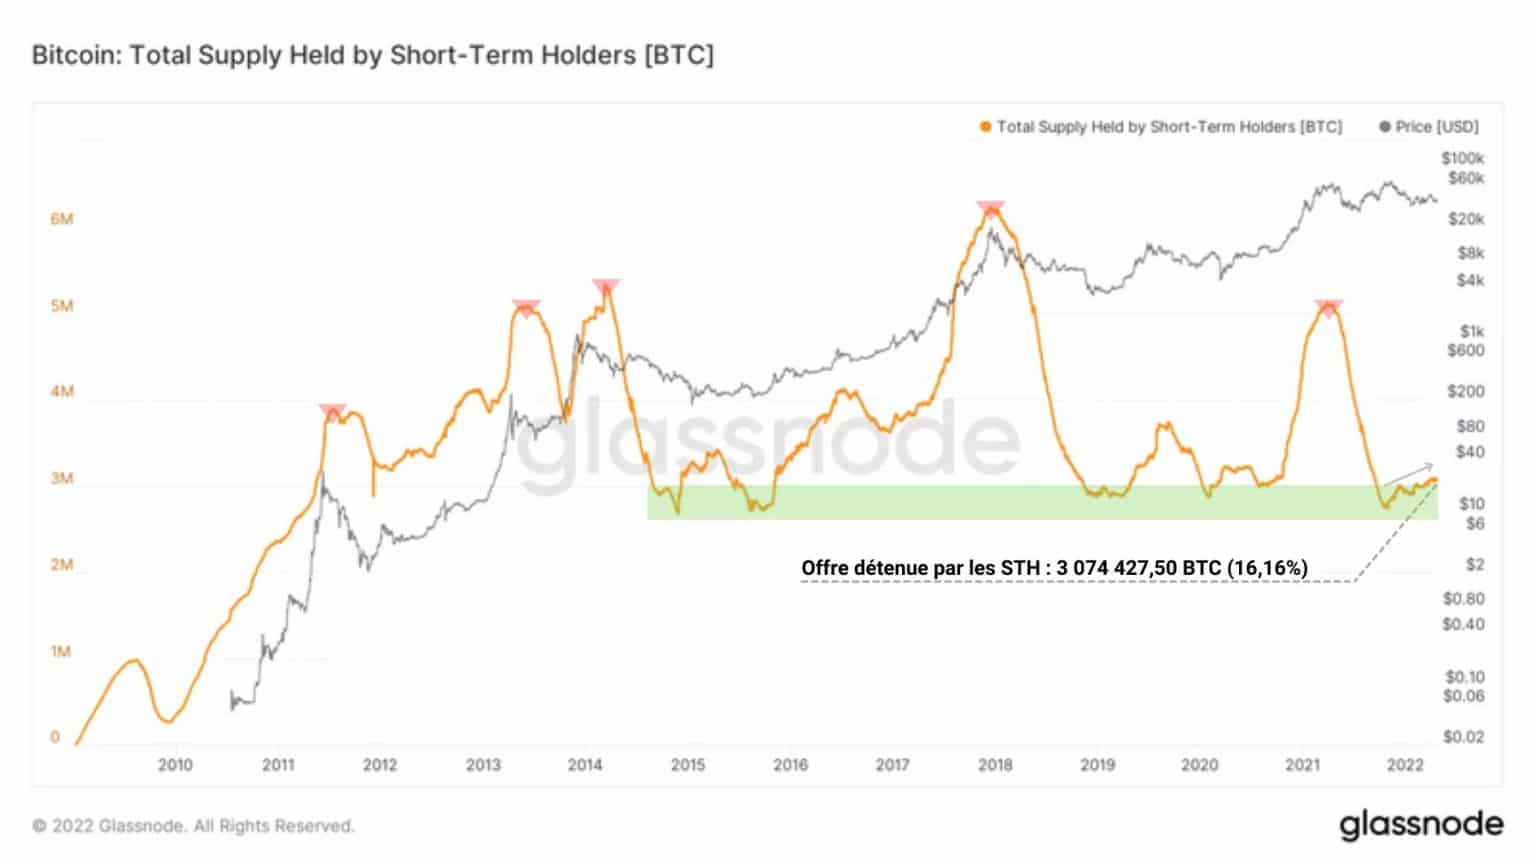
Figure 8: Supply held by STH
As such, they have little involvement in the bitcoin retention phenomenon and mostly handle liquid BTC. Accumulating to date more than 3 million BTC (16.16% of the outstanding supply), STHs continue the accumulation phase started at the end of 2021 despite uncertain price action.
Long-term investors (LTHs) generally behave in the opposite way to STHs. Seasoned investors, steeped in the HODLing philosophy and buyers of last resort, these entities demonstrate patience, price insensitivity and a strong belief in the economic and social virtues that Bitcoin brings.
Distributing their holdings during strong bull markets and accumulating deep in bear markets, these entities hold their BTC for more than 155 days and often for more than several years before they are willing to realize their profits.
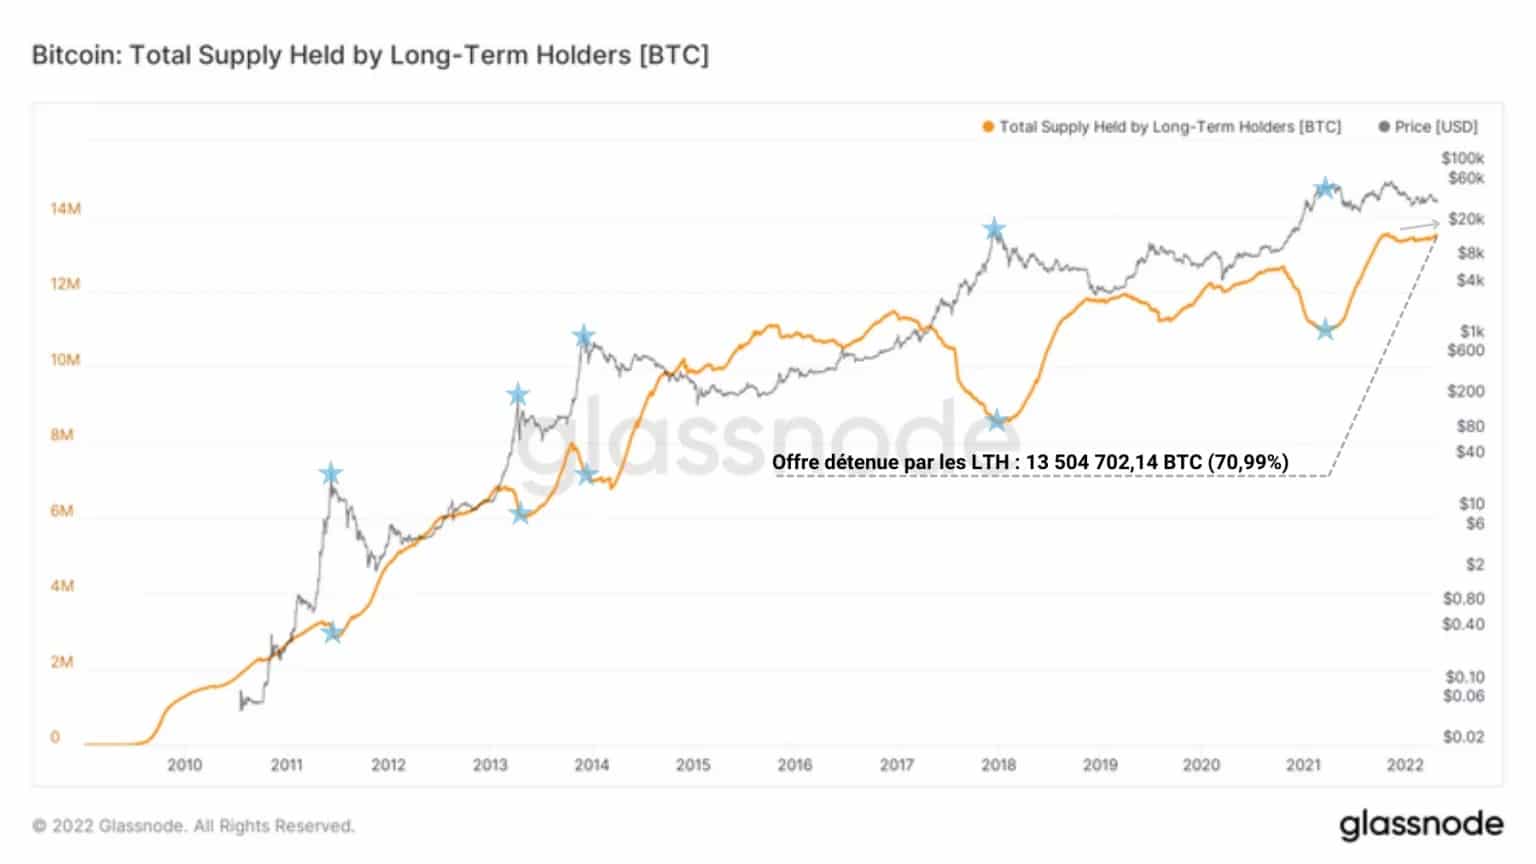
Figure 9: Supply held by LTH
Actively involved in making BTC increasingly illiquid, they currently hold over 70% of the outstanding supply (13.5 million BTC) and also appear to be reaccumulating.
Note that it is extremely rare for these two cohorts (LTH and STH) to show signs of accumulation in a synchronised manner. This is a very constructive signal that demand is currently outstripping supply in the spot markets.
Encouraging signals … but nothing immediate
Let’s briefly conclude this analysis by looking at two meaningful metrics: the SLRV and the aSOPR.
The SRLV, an indicator developed by Ark Invest, measures the momentum of demand in the short and long term in order to detect bear market entries (red) following bull market tops (green).
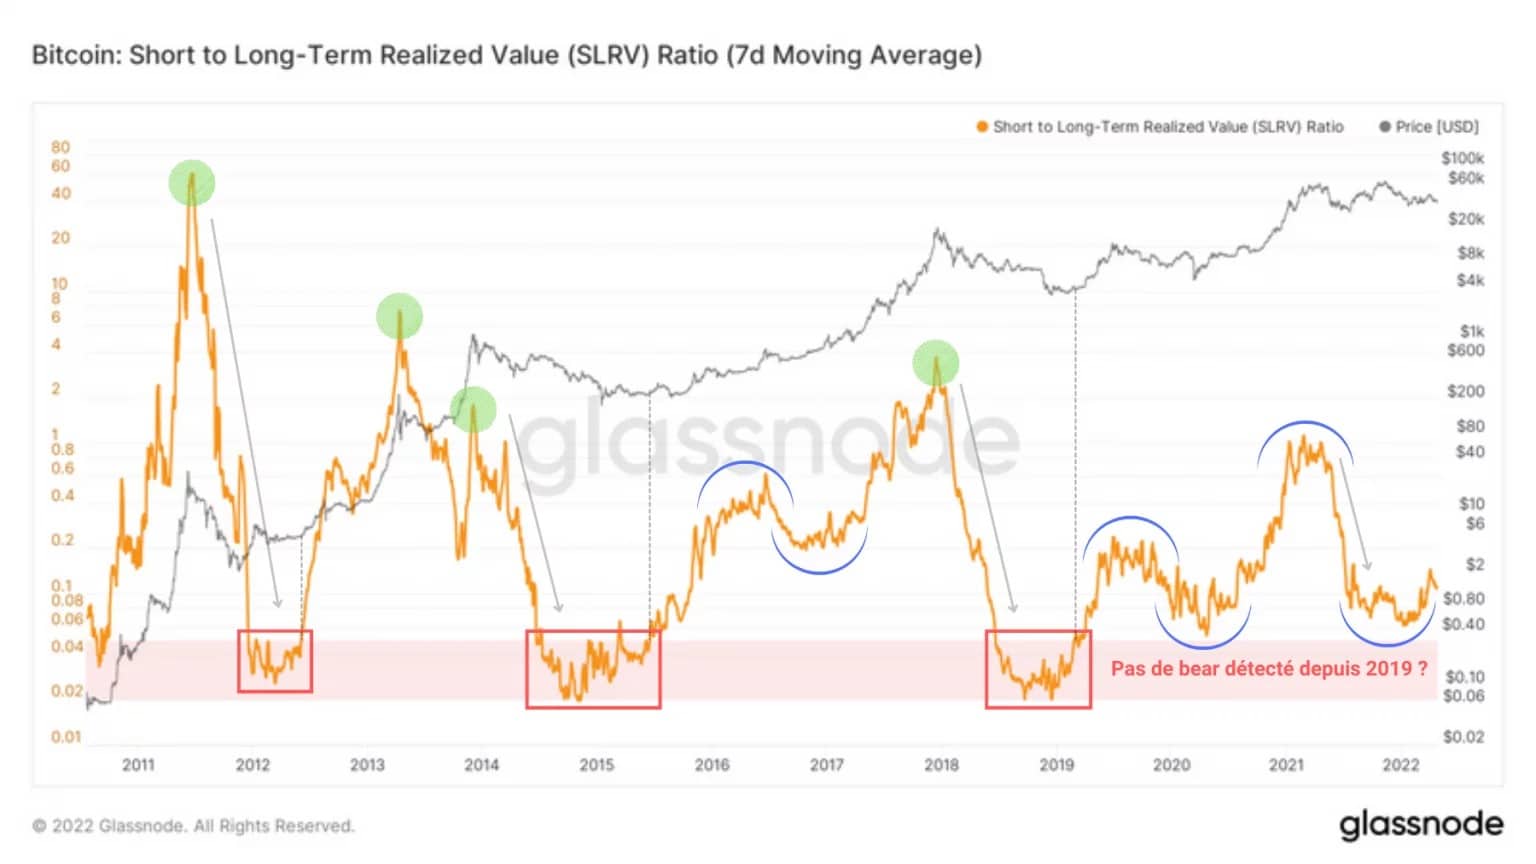
Figure 10: SLRV
An interesting point here is that this indicator has not signalled an entry into a bear market since 2019, signalling not that we are in a bull market (that definition being relatively unclear), but rather that we are experiencing a novel market structure.
Indeed, the increased interest in STHs during 2020 and 2021, coupled with the aggressive accumulation of LTHs seems to be creating sufficiently consistent demand for this metric to register large curved reversal phases (blue).
Currently in a bullish reversal phase, the SLRV indicates that a potential upside is ahead, given the cumulative demand of these two cohorts.
The aSOPR represents the profitability ratio of expenses. It is a proxy for market profitability and indicates the phases of negative (red), moderate (blue), strong (green) and maximum (yellow) profitability.
A pattern then emerges that reveals an underlying market dynamic: the influence of market profitability through spending. In fact, the behaviour that attracts our attention here is the formation of a base as a transitional event between profit-taking and loss-taking phases.
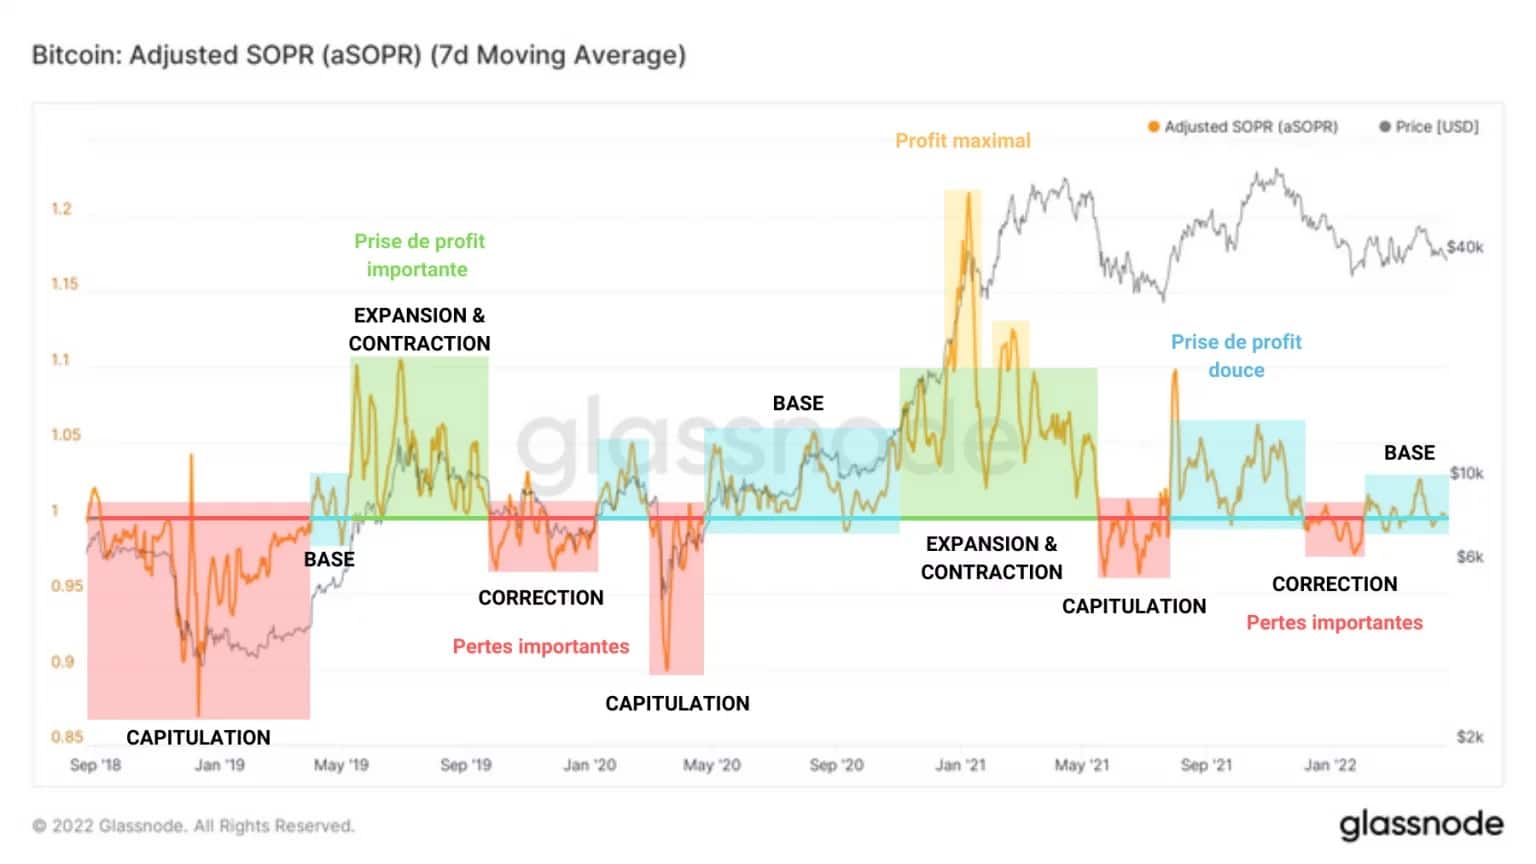
Figure 11: aSOPR
Having recently gone through two phases of significant loss taking, the market is again forming a base by attempting to take support on the neutrality threshold (aSOPR = 1).
Thus, the market has been in a transitional phase since February, the outcome of which is not certain, although many on-chain signals favour the bullish hypothesis.
Summary of this on-chain analysis
Finally, the current distribution of outstanding supply is unprecedented, to say the least. As more and more BTC leave the exchanges and enter the wallets of LTHs, illiquid supply is growing unabated and increasing the likelihood of a bullish liquidity shock.
With less than 10% of bitcoins left to be mined, a fierce competition for the last few bitcoins is gradually taking place, drastically increasing buying pressure and giving long-term investors confidence in the upcoming uptrend.