
The bitcoin price has been trying to preserve the bullish impulse of late June, the so-called “ETF projects” impulse, for 6 weeks now. The market price has corrected to a 38.2% Fibonacci retracement and is now trading in a range between support at $29,000 and resistance at $30,500. It is within this chartist framework that a new enemy is presenting itself to the BTC, the second wave of inflation forged on the rebound in the price of oil
Can the rebound in oil prices create a second wave of inflation?
The price of Bitcoin (BTC), in its annual upward recovery, which even began last November once the bearish effects of the FTX bankruptcy had passed, has encountered multiple “enemies”. These obstacles to the recovery, whose sole aim is to bring the crypto star back on the ropes or even eject him from the ring, are fundamental and technical in nature.
Here is a non-exhaustive list: the very high absolute level of market interest rates, the rebound in the US dollar since mid-July, the correction in the Nasdaq indices and tech stocks in the United States after having previously returned to their record highs at the end of 2021, issues specific to the fund security ecosystem, regulation, status (as a security or not, with SEC proceedings in the USA) and, more generally, the attractiveness of risk on the stock market at a time when the debate on the likelihood of a recession in the West has just been reignited by the resurgence of the banking crisis in the United States.
All these factors combine to put downward pressure on BTC, which can only rely on its strengths and promising prospects in 2024 to defend its performance over the past 10 months.
Let’s wish bitcoin well, because from August onwards it will have to face an enemy that we may have dismissed too early: inflation. Inflation is expected to rebound from July’s figures (published this August) in nominal terms due to the more than 20% rise in the price of oil on the commodities market since the end of June.
Admittedly, the US inflation rate (the main barometer for the Federal Reserve’s monetary policy outlook) is only expected to rebound from 3% to 3.5%, or even 4% for the August figures (published in September), but this represents a pause in the disinflationary trend that has been in place for 12 months. More importantly, the gap will widen again in relation to the FED’s 2% target.
How will the bitcoin price react? It will depend on whether this rebound in inflation is cyclical or structural – the answer is not known at this stage.
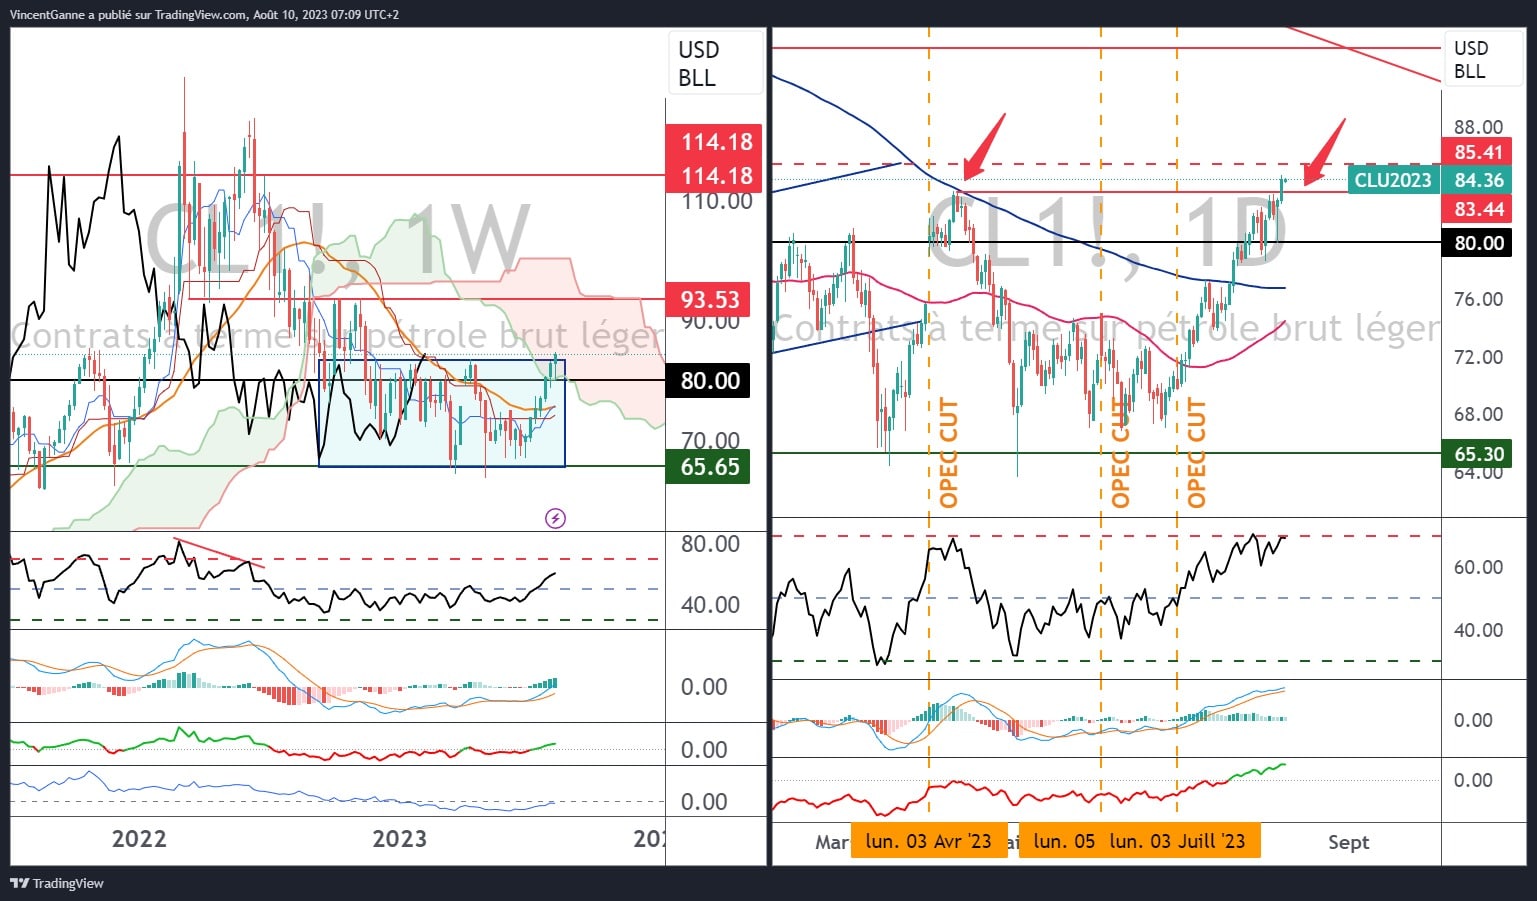
Chart showing weekly (left) and daily (right) Japanese candlesticks for the price of US crude oil (WTI)
Bitcoin technical analysis for the next few weeks
In terms of technical analysis of the price of bitcoin, here are the scenarios that seem possible for the next few weeks according to technical pivot levels:
- Continuation of the trading range between support at $29,000 and resistance at $30,500 (25% probability);
- The break of support at $29,000 (38.2% retracement of the ETF impulse) and continuation of the correction towards support at $27,300 (61.8% Fibonacci retracement);
- Crossing resistance at $30,500 and a return to annual highs.
It’s a closing price in daily data that will indicate the market’s choice.
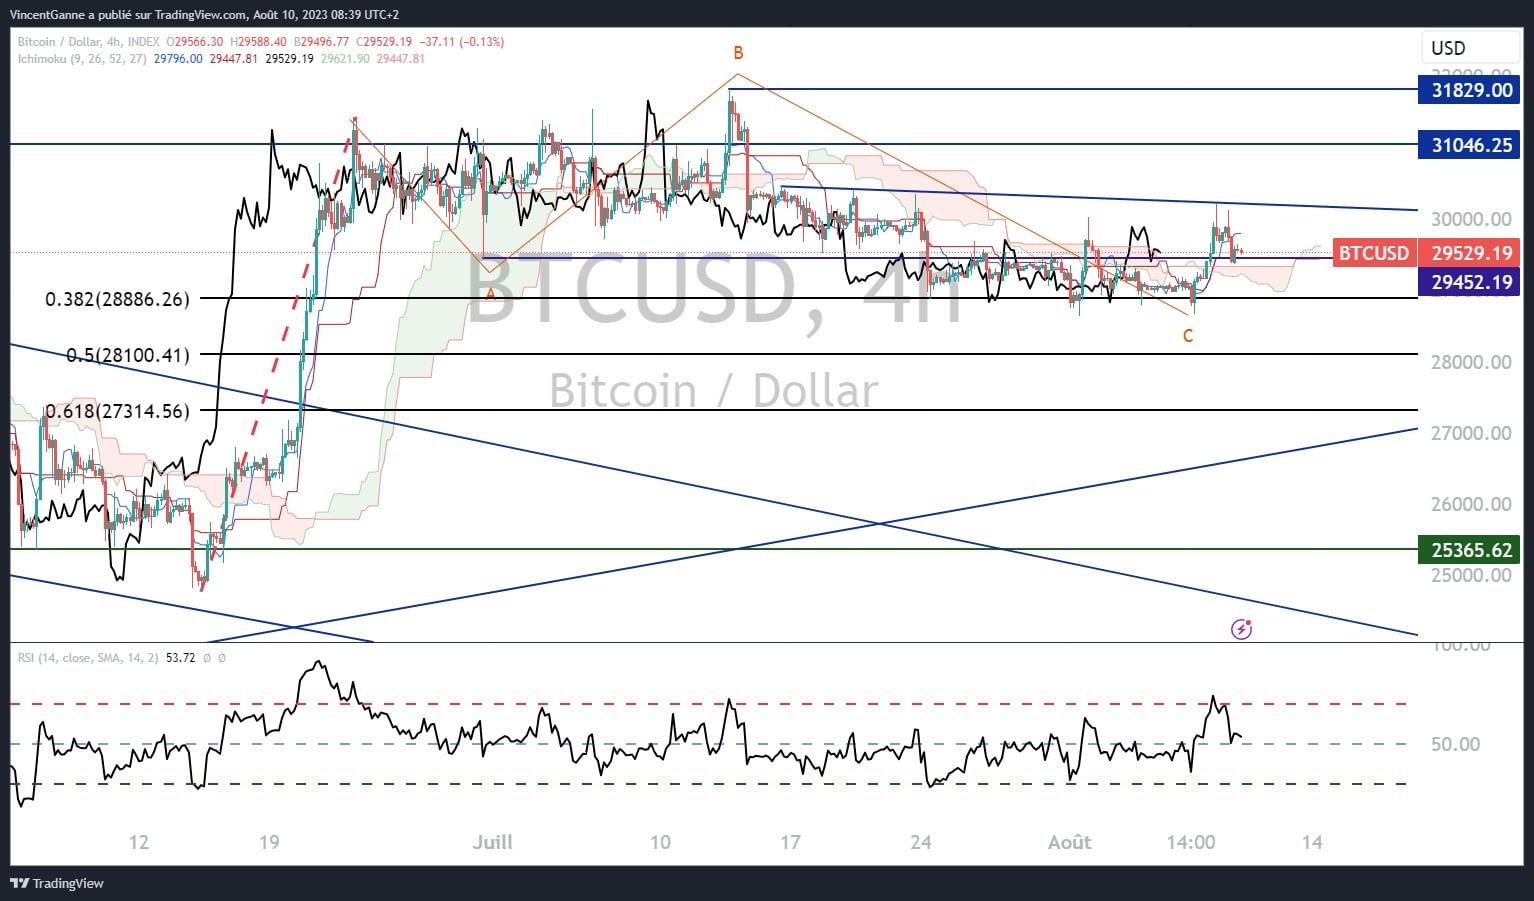
Graph created with the TradingView website and displaying intraday candlesticks (4-hour candlesticks) for the bitcoin price (BTC/USD)